

Mechanical Properties of Ceramics and Composites
.pdf150 |
Chapter 3 |
FIGURE 3.11 MgAl2O4 σ–G-1/2 data. The curve marked Bailey and Russell reflects not only their data [84, 85] but also other data of an earlier survey [86]. Subsequent data of Chay et al. [87], Rhodes et al. [88], Jacobs [89], Bakker and Lindsay [90], and Rice [13, 67] are shown corrected to 0 porosity using b=3, 6, and 8 (respectively low, middle, and high points of vertical bars); the limited % porosity of Rice’s specimens is shown next to those data points. Data of Kanai et al. [91], Gentleman [92], and Rice are shown as measured with machined surfaces. Vertical bars are the standard deviation, and the numbers underneath them, the number of tests; S=sintering, H=hot-pressing. While there is considerable uncertainty in the specific finer G slopes of all of the data (except that represented by Bailey and Russell), all such slopes are > 0.
Grain Dependence of Ceramic Tensile Strengths at 22°C |
151 |
A
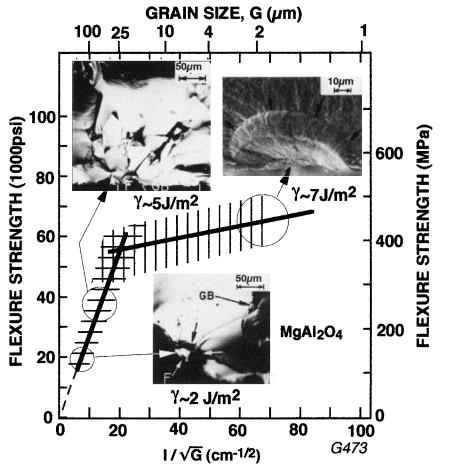
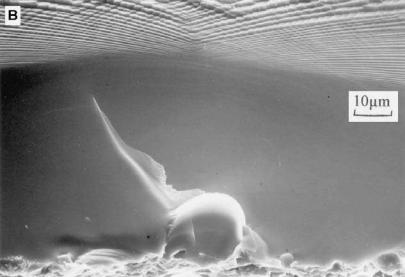
FIGURE 3.12 MgAl2O4 strength and fracture. (A) σ–G-1/2 data for dense sintered and hot pressed MgAl2O4 from an earlier survey with fractographic inserts showing specific fracture origins in the strength and G ranges circled. (After Rice [12], published with the permission of Plenum Press.) (B) Fracture origin from a machining flaw in a stoichiometric MgAl2O4 crystal machined parallel with the subsequent stress axis normal to (100), on which fracture occurred at 370 MPa. Note the mist and hackle at the left edge of the photo (and in the top left insert of (A)) indicating that the failure crack had become catastrophic well before it exited the large grain.
152 |
Chapter 3 |
FIGURE 3.12 Continued.
reasonable data, e.g. for Y2O3 (Figure 2.12) and MgAl2O4 (Figure 2.13), which show limited or no toughness dependence on G. The limited decrease of strength with increasing G in the finer G branch is explained by effects on flaw size in Section VI.A and the greater strength decrease at larger G by the transition to single crystal or grain boundary toughness control (Chap. 2, Sec. III.E; (Chap. 3) Sec. VII.A). Thus this data is clearly consistent with the two-branch model (Fig. 3.1). Such comments also apply to much of the failure of materials having limited plastic induced fracture, especially those tranisitioning to preexisting flaw failure, e.g. MgO (Figs. 2.12, 3.5). However, SiC, addressed in the following section, shows serious discrepancies between the G dependences of toughness (Figure 2.14) and strength (Fig. 3.13) similar to those often found for noncubic materials discussed later.
B.Cubic Carbides and Refractory Metals
The most extensive data for a cubic nonoxide is for SiC (Fig. 3.13). Though some data is for bodies of some to all α-SiC content which is noncubic, it has limited anisotropy and is thus generally consistent with cubic (β) data. Previous surveys [3, 11, 13] of earlier SiC data [95, 96] clearly established part of the large G branch and finer G branches, based on Ga, generally agreeing, as does that of
Grain Dependence of Ceramic Tensile Strengths at 22°C |
153 |
A
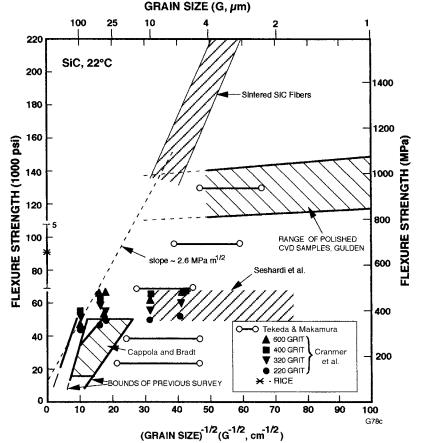
FIGURE 3.13 Strength versus G-1/2 for various, mostly β-, SiC bodies at 22°C.
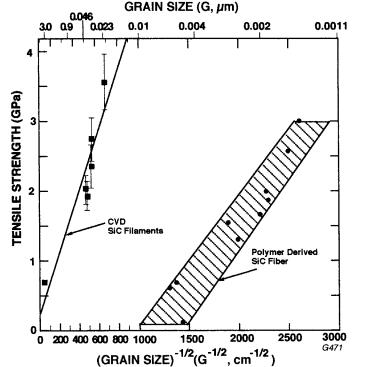
(A) Data for mostly dense sintered or hot pressed SiC bodies, including bounds from earlier surveys [3, 11, 13], along with earlier [95–97] and more recent data [98, 99], showing different finer G branches and one larger G branch consistent with the expected model. This is also supported by data of Larson et al. [100] (not shown for clarity). Again limited strengths for similarly machined small, single crystal bars [101, 102] are above much of the polycrystalline values. Note data for extruded and as-sintered SiC fibers ( 50 µm dia., 103), which appear to be an extension of the larger G branch, consistent with similar σ – G-1/2 behavior for asfired surfaces. (B), Data for polymer-derived SiC fibers containing typical [104] and low [105] oxygen levels tested as-fired and as-deposited CVD SiC filaments [106]. Note that the compressed G-1/2 scale gives the appearance of high slopes in (B) but they are actually 0.4 and 0.2 MPa·m1/2, consistent with being finer G branches, as is their fine G.
154 |
Chapter 3 |
B
FIGURE 13 Continued.
Cranmer et al. [26] (using Gm). Prochazka and Charles’ data for sintered β bodies [96] also generally agrees with other data when strengths (<140 to 350 MPa) are plotted versus the effective G (taken as 1/10 the length) of the long tabular (exaggerated) α-grains at fracture origins in the β-SiC matrix, rather than the grain length, as used by the authors. Gulden’s [97] CVD SiC data (0.6 ± 0.5% porosity), based on Ga, is also consistent, recognizing the higher strength due to the use of small polished specimens (with some possible preferred orientation), and it supports a positive fine G slope, as does Cranmer et al.’s surface finish study. The latter again show different finer G branches as a function of machining grit size, with less differentiation in the larger G branch. Seshardri et al.’s [98] (sintered α,1.6% porosity) SiC data also showed a finer G branch of low slope. Takeda and Nakamura’s [99] SiC (sintered to 98–99% theoretical density, mostly with 1–2% of AIN, BN, B, or B4C) data tends to fall to the right of the other data whether plotted versus Ga or Gm from general microstructure evaluation (measurement specifics not given). This data being to the right of other data probably reflects G
Grain Dependence of Ceramic Tensile Strengths at 22°C |
155 |
measurement issues, especially the inability to determine a true Gm on other than the fracture surface, so the values given are likely to be <Gm at fracture origins (not determined), especially at medium and larger G. Correction for this would likely bring their data into agreement with the other SiC. Larsen et al.’s [100] SiC strength data versus measured Gm (based on fractography), as well as variable Ga values for various SiC materials, is consistent with other SiC data and the model of Fig. 3.1, e.g. similar to their data for Si3N4 (Fig. 3.29). This showed that most higher strength failures occurred from undetermined origins (i.e. no dominant features such as large grains in the origin area), thus being more consistent with Ga values and on finer G branches (of which there should be more than one, substantial scatter, or both in view of different and varying flaw populations), while lower strengths (e.g. <450 MPa) showed failure from various flaws, tabular grains (e.g. in the GE β SiC), or both. Again, note various polycrystalline strengths extending down to 20% or less of the average strengths of small α single crystal bars (oriented for easy fracture, e.g. on (100) [101, 102] with similar surface machining as the polycrystalline bodies and basic inconsistencies with K–G data (Figure 2.14), especially at finer G.
While the above bulk SiC data is for machined samples, as is typical for most materials, various SiC fibers provide data on as-fired or as-deposited surfaces (and some possible surface damage), as is the case for alumina-based fibers discussed below (Fig. 3.18). Data of Srinivasan and Venkateswaran [103] for SiC fibers made by green extrusion of SiC powders and sintering clearly falls along an extension of the larger G branch for bulk SiC to strengths of 1500 MPa (Fig. 3.13A). This is consistent with its grain size range, the as-fired surfaces, and fractography indicating fracture origins from flaws with c G. Data for polymer-derived SiC-based fibers (Fig. 3.13B) also shows a clear G dependence [104, 105], extending well into the nanograin regime. Data of Elkind and Barsoum [106] on commercial CVD SiC filaments tested as-received or after heat treated to increase G, both by itself and combined with the one much larger G specimen [107], shows a distinct G dependence. This is corroborated by data of Bhatt and Hull [108, 109] showing similar decreases in strength with heat treatments and associated qualitative changes in G and by the microstructural characterization of such fibers by Nutt and Wawner [110]. Differences between these sets of as-fired polymer-derived and as-deposited or as-fired CVD fibers are attributed primarily to the G differences and composition, especially significant dilution of the SiC content, primarily in the polymer-derived fibers, as well as to some test differences (e.g. loading rates, gage lengths, etc.). Other microstructural differences, especially elongated grains with an axial preferred [111] alignment with the carbon core of the CVD filaments, also are probably a source of the difference in σ–G-1/2 behavior between the fibers. However, these fiber results clearly show that such as-fired surfaces follow similar G dependences as machined surfaces.
156 |
Chapter 3 |
Another |
SiC data source providing additional insight is very fine G |
(0.01–0.1 µm), small rods ( 1.5 mm dia.) of SiC deposited on W wire cores ( 200 µm dia.). This is a transition between the above SiC bulk and filament data. As-deposited surfaces were very smooth, giving strengths averaging 1400–1800 MPa depending on whether they were respectively tested in fouror three-point flexure, despite an indicated internal stress from W–SiC expansion differences of the order of 700 MPa [111, 112]. Limited fracture origin identification indicated failure from surface flaws from handling damage, indicating such bodies would fall on a fine G branch, as was expected. These results were corroborated by three-point flexure of lightly and more heavily abraded surfaces (respectively with 600 and 320 grit SiC paper in the axial direction), giving average strengths of 1000 and 600 MPa respectively (the latter also obtained for oxidized surfaces). Substantial fracture origin determinations showed that fractures in abraded rods occurred from machining flaws substantially larger than the handling flaws and the G, confirming their placement on finer G branches.
A previous survey [11] of more limited data of Cr3C2, HfC, TaC, and ZrC showed larger G behavior like that of other ceramics, as well as reasonable evidence of finer G branches (e.g. TaC, TiC, and ZrC), the latter sufficient to indicate a positive slope. Subsequent data by Miracle and Lipsett [113] for TiCx (x = 0.66, 0.75, 0.83, or 0.93 with G = 22, 21, 20, and 14 µm respectively) is consistent with the other TiC data; i.e. effects of G dominate over, or are a reflection of, stoichiometry. ZrC data of Bulychev et al. [114] for G 10–24 µm indicates intersection of the finer and larger G branches in the range of G 15–20 µm.
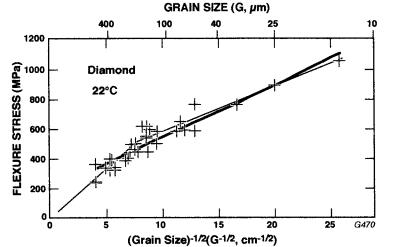
Recently, Savage et al. [115] presented fairly extensive data for CVD diamond showing a clear G-1/2 dependence of strength (Fig. 3.14). Though they showed a single line through their data, there is reasonable indication of a change from a finer to a larger G branch, with the intersection of the two branches in the 100–250 µm range and a larger G branch slope of 6 MPa·m1/2. Both these values are in reasonable agreement with the model (Table 3.1), especially given uncertainties due to the elongated, oriented grain structure from CVD.
While some refractory metals such as Nb and Ta commonly exhibit macroscopic ductility (hence also commonly following a Petch relation), others such as Cr, Mo, and W commonly have limited or no macroscopic ductility. Thus when there are cracks, pores, impurity particles, etc. of sufficient size and concentration to be failure causing flaws [116], failure is brittle, e.g. as shown by effects of surface finishing on ductility in W [117]. In such cases there may be relations of strength to G via relations of the flaw sizes or of toughness to G, or both. In the absence of such flaws, these commonly brittle materials fail by slipinduced (cleavage) fracture, e.g. down to temperatures of 100° K [118] which is corroborated by their strengths following a Petch relation. However, there are some departures to a lower Petch plot slope, e.g. at G > 0.25 mm in Mo that re-
Grain Dependence of Ceramic Tensile Strengths at 22°C |
157 |
3.14 Flexure strength of CVD diamond at 22°C as a function of the inverse square root of grain size (G-1/2). Note that while they drew a single line through all of the data, it is fitted better by two lines consistent with the model for machining flaw–grain interactions. (From Ref. 115, published with the permission of the SPIE.)
sults in intercept stresses higher than those projected from finer G, e.g. by 50%. This and other variations may arise from differing brittle-to-ductile transition temperatures at different G values, e.g. in W 300° K at fine G and < 200° K for large G [119] with brittle fracture following the Griffith equation [120]. Such higher transition temperatures in finer G bodies would suggest the occurrence of brittle fracture in some finer G bodies with slip-induced fracture in larger G bodies, i.e. as in Fig. 3.1. However, it is not clear whether this combination as found in ceramics has been clearly demonstrated in brittle metals, though an earlier combination of strengths of a few different W bodies to give a broader G range [11] suggests that possibility.
IV. NONCUBIC CERAMICS FAILING FROM PREEXISTING FLAWS
A.Al2O3 Machined and As-Fired
Al2O3 has the most extensive data base, providing substantial data not only on the basic σ – G-1/2 and related fractography, but also on effects of different mechanical testing, additives and second phases (especially to inhibit grain growth), and machined and as-fired surfaces. Though much of this data is limited by the

158 |
Chapter 3 |
grain size range covered and the accuracy and detail of microstructural characterization, it clearly provides extensive demonstration of the two branch behavior of Fig. 3.1, as was shown in previous surveys [2, 8, 9, 11–13] summarized here. Thus the area labeled previous surveys in Fig. 3.15 covers the range of almost all data with only a limited amount of data falling outside of this area and only to a limited extent. Thus earlier data on commercial and similar aluminas, often with some (e.g. 3–8%) porosity, second phase (1–7%, mainly silicate), or both [121–127] falls mostly in the lower half or somewhat below this area but individually or collectively agree with the two-branch model. This includes Alford et al.’s [27] data for specimens machined from somewhat porous pressed discs [2] and that of Evans and Tappin [125] (sintered, diamond ground) Al2O3 with 2 σ–G-1/2 branches with a reduced but > 0 slope in the fine G region, but somewhat lower σ due to 5% porosity. Correction for effects of porosity and silicate phase (Fig. 3.30) of sintered bodies moves this data further toward the mean of
FIGURE 3.15 Strength versus G-1/2 for alumina bodies at 22°C. A summary of trends from previous surveys [2, 3, 11, 13] is shown along with more recent results for mainly high-purity, dense sintered bodies [128–136] and results of true tensile testing of large hot pressed specimens [67, 138]. Note data for Verneuil crystals ground parallel or perpendicular to the tensile axis [15] (open and closed symbols respectively).
Grain Dependence of Ceramic Tensile Strengths at 22°C |
159 |
the data survey and into better agreement with hot pressed data, which fell mostly near the central-to-upper portion of the survey area [13, 53, 128–130]. Subsequent studies of higher purity bodies, mostly sintered close to theoretical density [131–136], also agree individually or collectively with the previous survey, including that of Koyama et al. [135] with small additions of CaO, SiO2, or both giving elongated Al2O3 grains (Fig. 3.17). Two exceptions to these trends are for submicron G bodies of Spriggs et al. [64] and Krell and Blank [137] with strengths for (unspecified) machined dense Al2O3 of 450–550 MPa (G 0.6–0.8 µm) and 582 MPa (G 0.4 µm). The lower level of these strengths relative to that expected from extrapolation of data of Fig. 3.15 to finer G is attributed to grain boundary contamination left from raw materials and processing used to achieve the finer G (Sect. V.A).
Data of Fig. 3.15 also allows comparison of different test techniques, though most data is from various flexure tests, which is probably a factor in the data range. Chantikul et al.’s data [131] in biaxial flexure of small discs tends to fall higher in strength, especially at finer G, which may reflect some benefits of avoiding edge failures (and probably also reflects some benefits of polished versus ground surfaces, as is discussed below), but it still falls in the typical range for other studies. True tensile testing of much larger hot pressed Al2O3 samples is shifted to larger G values due to the large specimen volume tested and the occurrence of isolated single large grains or clusters of a few of them, e.g. reaching dimensions of ≥ 500 µm [67, 138]. While some of these grains or clusters may exceed the flaw size, indicating a somewhat higher than real slope, the slope of the resultant larger G branch is still in the range of the other studies of Fig. 3.15 (see also Sec. VII). This true tension data also shows some of the finer G branch consistent with the other data. Further, diametral tensile testing of mostly hot pressed bodies [139–141] falls near the lower bound of the survey range in Fig. 3.15 and clearly shows a consistent intersection of larger and finer G branches [13]. Thus while different testing may shift the results due to stressing of different volumes of material and thus sampling different ranges of failure causing flaws, the σ–G-1/2 behavior shifts accordingly, e.g. in slopes and intersections, but remains consistent with the basic model, which is thus reinforced.
Consider next machining studies, which were an important factor in developing the model of Fig. 3.1. The demonstration that there was significant anisotropy of tensile strength as a function of machining direction relative to the subsequent stress direction in uniaxial tensile or flexure testing [15, 17] was a major factor in indicating the two-branch character of σ–G-1/2 behavior. Initial studies showed that machining parallel versus perpendicular to the tensile axis resulted in respectively higher and lower strengths at both finer and large G (and also generally in single crystals), thus indicating different finer G branches. Subsequent studies of Tressler et al. [24] showed different machining σ effects in the finer, than in the larger, G region. Coarser abrasive finishing in the finer G region