

ПРАКТИЧЕСКАЯ РАБОТА
КАРТИНА МИРА
АНАЛИЗ СТАТИСТИКИ
ЗАДАНИЯ
На основе статистических данных выявите основные тенденции мирового экономического развития и ответьте на следующие вопросы:
Какова динамика мирового ВВП и ВВП развитых и развивающихся стран?
Каковы тенденции мировых инвестиций и мировой торговли?
Какова динамика цен на мировых рынках?
Какие новые тенденции в экономическом развитии стран можно отметить?
Какие противоречия в экономическом развитии развитых и развивающихся стран будут сохраняться в ближайшем будущем?
Каким образом проявляется взаимозависимость стран и регионов?
Где вы видите допустимую грань между взаимозависимостью и безопасностью?
Country Group Name |
Subject Descriptor |
Units |
Scale |
Series-specific Notes |
2008 |
2009 |
2010 |
2011 |
2012 |
2013 |
2014 |
2015 |
||
World |
Gross domestic product, current prices |
U.S. dollars |
Billions |
|
61,187.163 |
57,843.376 |
61,963.429 |
65,417.340 |
69,125.034 |
73,111.569 |
77,405.039 |
81,962.902 |
||
World |
Gross domestic product based on purchasing-power-parity (PPP) valuation of country GDP |
Current international dollar |
Billions |
|
69,947.117 |
70,040.547 |
74,004.249 |
78,092.199 |
82,698.914 |
87,747.271 |
93,320.221 |
99,336.199 |
||
World |
Investment |
Percent of GDP |
|
|
23.738 |
21.594 |
22.588 |
23.225 |
23.864 |
24.315 |
24.693 |
25.049 |
||
World |
Trade volume of goods and services |
Percent change |
|
|
2.875 |
-11.011 |
11.384 |
6.953 |
n/a |
n/a |
n/a |
n/a |
||
World |
Import volume of goods and services |
Percent change |
|
|
3.004 |
-11.244 |
11.468 |
6.800 |
n/a |
n/a |
n/a |
n/a |
||
World |
Export volume of goods and services |
Percent change |
|
|
2.746 |
-10.777 |
11.300 |
7.106 |
n/a |
n/a |
n/a |
n/a |
||
World |
Current account balance |
U.S. dollars |
Billions |
|
210.739 |
216.579 |
202.256 |
296.594 |
309.530 |
369.151 |
442.402 |
489.401 |
||
World |
Commodity Price Index includes both Fuel and Non-Fuel Price Indices |
Index, 2005=100 |
|
|
172.131 |
118.796 |
142.483 |
144.213 |
n/a |
n/a |
n/a |
n/a |
||
World |
Commodity Non-Fuel Price Index includes Food and Beverages and Industrial Inputs Price Indices |
Index, 2005=100 |
|
|
151.037 |
122.746 |
143.379 |
140.499 |
n/a |
n/a |
n/a |
n/a |
||
World |
Commodity Industrial Inputs Price Index includes Agricultural Raw Materials and Metals Price Indices |
Index, 2005=100 |
|
|
145.471 |
109.367 |
140.741 |
139.754 |
n/a |
n/a |
n/a |
n/a |
||
World |
Commodity Food and Beverage Price Index includes Food and Beverage Price Indices |
Index, 2005=100 |
|
|
156.548 |
135.991 |
145.990 |
141.235 |
n/a |
n/a |
n/a |
n/a |
||
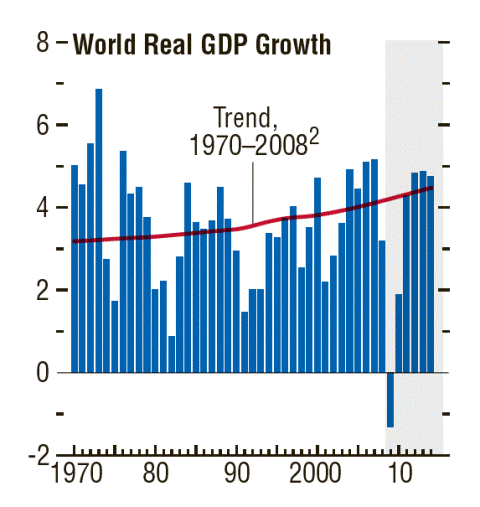
World
Real GDP Growth Rate (Year 1970 to Year 2014)
|
Real
GDP Growth Rate (Year 1970 to Year 2015) – Emerging and
Developing Economies vs. Advanced Economies
|
|
||||||||||||

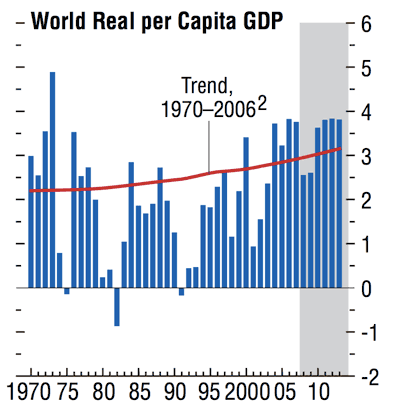
World Real per Capita GDP Growth Rate (Year 1970 to Year 2013) (C) |
|
Real GDP Growth Rate |
|
World Economic Outlook 2010 http://www.imf.org/external/pubs/ft/weo/2010/01/index.htm |

Consumer Prices (Annual Percent Change, Year 1970 to Year 2014) – Emerging and Developing Economies vs. Advanced Economies (C) |
|
World Economic Outlook 2009 http://www.imf.org/external/pubs/ft/weo/2009/02/index.htm |
World Trade Volume (Annual Percent Change, Year 1970 to Year 2015) |
|
World Economic Outlook 2010 http://www.imf.org/external/pubs/ft/weo/2010/01/index.htm |


Group Name |
Subject Descriptor |
Units |
Scale |
2008 |
2009 |
2010 |
2011 |
2012 |
2013 |
2014 |
2015 |
Emerging and developing economies |
Gross domestic product, constant prices |
Percent change |
|
6.013 |
2.513 |
7.073 |
6.435 |
6.517 |
6.582 |
6.649 |
6.659 |
Emerging and developing economies |
Gross domestic product, current prices |
U.S. dollars |
Billions |
18,999.236 |
17,961.997 |
20,765.729 |
22,757.084 |
24,821.798 |
27,062.401 |
29,498.517 |
32,149.296 |
Emerging and developing economies |
Investment |
Percent of GDP |
|
30.048 |
29.939 |
30.815 |
31.229 |
31.431 |
31.631 |
31.849 |
32.087 |
Emerging and developing economies |
Import volume of goods and services |
Percent change |
|
9.018 |
-8.156 |
14.313 |
9.883 |
n/a |
n/a |
n/a |
n/a |
Emerging and developing economies |
Export volume of goods and services |
Percent change |
|
4.565 |
-7.803 |
11.932 |
9.101 |
n/a |
n/a |
n/a |
n/a |
Emerging and developing economies |
General government gross debt |
Percent of GDP |
|
34.837 |
37.692 |
36.908 |
36.697 |
36.199 |
35.398 |
34.250 |
32.833 |
Emerging and developing economies |
Current account balance |
U.S. dollars |
Billions |
703.368 |
339.140 |
312.324 |
325.198 |
371.721 |
474.540 |
615.846 |
763.781 |
Emerging and developing economies |
External debt, total |
U.S. dollars |
Billions |
4,653.753 |
4,902.992 |
5,125.217 |
5,453.056 |
n/a |
n/a |
n/a |
n/a |
Emerging and developing economies |
External debt, total |
Percent of GDP |
|
24.494 |
27.296 |
24.681 |
23.962 |
n/a |
n/a |
n/a |
n/a |
Emerging Market and Developing Countries Net Capital Flows (Year 2002 to Year 2011, in billions of USD)

Population in 2009
|
|

World Population Development (Year 1750 to Year 2050) (C) |
|

Balance on Current Account (Year 2002 to Year 2015, in % of GDP) (T) |
|
World Economic Outlook 2010 http://www.imf.org/external/pubs/ft/weo/2010/01/index.htm |

External Debt (in usd)
RANK |
Country |
Debt-External |
Date |
|
|
|
|
1 |
United States |
$ 13,980,000,000,000 |
30 June 2010 |
2 |
European Union |
$ 13,720,000,000,000 |
30 June 2010 |
3 |
United Kingdom |
$ 8,981,000,000,000 |
30 June 2010 |
4 |
Germany |
$ 4,713,000,000,000 |
30 June 2010 |
5 |
France |
$ 4,698,000,000,000 |
30 June 2010 |
6 |
Japan |
$ 2,441,000,000,000 |
30 September 2010 |
7 |
Ireland |
$ 2,253,000,000,000 |
30 September 2010 |
8 |
Norway |
$ 2,232,000,000,000 |
30 June 2010 |
9 |
Italy |
$ 2,223,000,000,000 |
30 June 2010 est. |
10 |
Spain |
$ 2,166,000,000,000 |
30 June 2010 |
11 |
Luxembourg |
$ 1,892,000,000,000 |
30 June 2010 |
12 |
Belgium |
$ 1,241,000,000,000 |
30 June 2010 |
13 |
Switzerland |
$ 1,200,000,000,000 |
30 September 2010 |
14 |
Australia |
$ 1,169,000,000,000 |
31 December 2010 est. |
15 |
Canada |
$ 1,009,000,000,000 |
30 June 2010 |
16 |
Sweden |
$ 853,300,000,000 |
30 June 2010 |
17 |
Austria |
$ 755,000,000,000 |
30 June 2010 |
18 |
Hong Kong |
$ 750,800,000,000 |
31 December 2010 est. |
19 |
Denmark |
$ 559,500,000,000 |
30 June 2010 |
20 |
Greece |
$ 532,900,000,000 |
30 June 2010 |
Human Development Index (hdi) Subscores in 2010
Very High Human Development High Human Development
|
|