Chapter 9.4 NMR Spectral Analysis
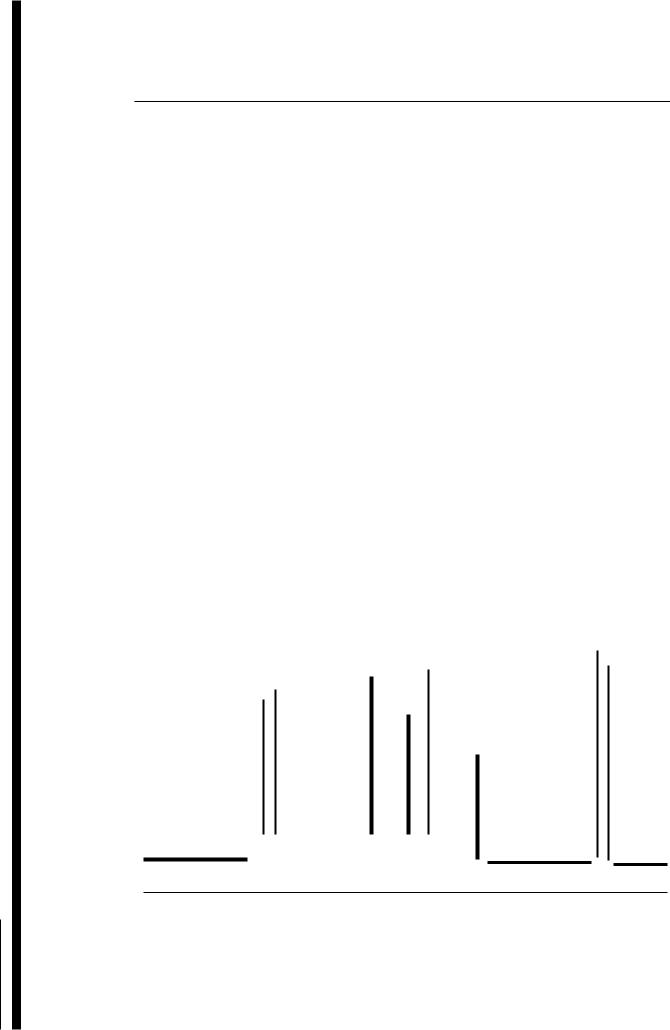
Portion of 100 MHz NMR spectrum of crotonic acid in CDC13 is given below. The upfield part of the spectrum, which is due to the methyl group, is less amplified to fit the page.
Problem 327
CHI
crotonic acid
,.
(a)Draw asplitting diagram and analyse this spectrum by first-order methods, i.e. extract all relevant coupling constants (J in Hz) and chemical shifts (8 in ppm) by direct measurement. Justify the use of first-order analysis.
(b)There are certain conventions used for naming spin-systems (e.g. AMX, AMX2, AM 2X3) . Note that this is a 5-spin system and name the spin system responsible for this spectrum (see Section 5.6).
/
i
!
CH 3 group
|
|
|
|
|
|
|
|
|
|
|
|
|
|
|
|
|
i |
I |
I |
j |
---0,----.,--....,..., -- |
|
iii |
I |
i |
730 |
720 |
710 |
700 |
690 |
600 |
590 |
580 |
570 |
200 |
190 |
180 |
(Hz from TMS)
Chapter 9.4 NMR Spectral Analysis
Problem 328
The 100 MHz IH NMR spectrum (5% in CDCl 3 ) of an a,p-unsaturated aldehyde C4H60 is given below.
(a)Draw a splitting diagram and analyse this spectrum by first-order methods, i.e. extract all relevant coupling constants (J in Hz) and chemical shifts (8 in ppm) by direct measurement.
(b) |
Justify the use of a first-order analysis (see Section 5.6). |
,. |
|
|
(c)Use the coupling constants to obtain the structure of the compound, inclu~ing the stereochemistry about the double bond (see Section 5.7).
1H |
|
|
'IH |
|
|
|
'IH |
|
|
I |
I |
|
i |
|
|
|
|
|
190 |
960 |
950 |
700 |
680 |
630 |
610 |
210 |
(Hz from TMS)
Chapter 9.4 NMR Spectral Analysis
Problem 329
Draw a schematic (line) representation of the pure first-order spectrum (AMX3) corresponding to the following parameters:
Frequencies (Hz from TMS): |
VA = 80; vM = 220; Yx = 320. |
|
Coupling constants (Hz): |
JAM = 10; JAX = 12; JMX = O. |
|
Assume that the spectrum is a pure first-order spectrum and ignore small distortions in |
|
relative intensities oflines that would be apparent in a "real" spectrum. |
r, |
(a)Sketch in "splitting diagrams" above the schematic spectrum to indicate which sp1ittings correspond to which coupling constants.
(b)Give the chemical shifts on the 8 scale corresponding to the above spectrum obtained with an instrument operating at 60 MHz for protons.
/
i
I
|
|
I I |
I I |
I |
I |
350 |
300 |
250 |
200 |
150 |
100 (Hz from TMS) |
Chapter 9.4 NMR Spectral Analysis
Problem 330
A portion of the 90 MHz IH NMR spectrum (5% in CDCl 3) of one of the six possible isomeric dibromoanilines is given below. Only the resonances of the aromatic protons are shown.
U Br |
y |
BrAJ |
lJ |
;;'yBr |
Brn\I ,. Br |
|
|
|
NHz |
|
NHz |
):Br |
hBr |
):Br Br~Br |
|
|
|
Br |
|
|
Br |
|
, 1 |
2 |
3 |
4 |
5 |
6 |
Determine which is the correct structure for this compound using arguments based on symmetry and the magnitudes of spin-spin coupling constants (see Section 5.7).
/
|
|
|
|
|
|
|
|
|
|
|
|
|
|
|
|
|
|
|
|
|
|
|
|
|
|
|
|
|
|
|
|
|
|
|
|
|
|
|
|
|
|
|
|
|
|
|
|
|
|
|
|
|
|
2H |
|
1H |
|
|
|
|
|
|
|
|
|
|
7.4 |
|
|
|
6.4 ppm from TMS |
Chapter 9.4 NMR Spectral Analysis
Problem 331
The 400 MHz 1H NMR spectrum (5% in CDCl3 after DzO exchange) of one of the six possible isomeric hydroxycinnamic acids is given below.
|
OH |
en |
|
I |
COOH |
|
OH |
|
|
OH |
|
|
~COOH |
Y" I |
~ |
2 |
~3 |
|
~ I 1 |
~ |
COOH |
~ ~ |
|
|
|
|
|
OH |
HO~5 |
|
,. |
|
HO~OOH \I |
|
Cu°OH |
Y"I |
|
|
~ I |
~ 6 |
|
~ |
~ COOH |
|
~ I ~ 4 |
|
|
|
|
|
|
|
|
,
Determine which is the correct structure for this compound using arguments based on symmetry and the magnitudes of spin-spin coupling constants (see Section 5.7).
1H
1H 1H
1H
1H
Chapter 9.4 NMR Spectral Analysis
~"
|
I |
|
Problem 332 |
|
H CI |
C lOH6Cl2 · |
:0:CI H |
In a published paper, the 90 MHz IH NMR spectrum |
|
given below was assigned to 1,5-dichloronaphthalene, |
|
|
1,5-dichloronaphthalene |
(a)Why can't this spectrum belong to 1,5-dichloronaphthalene?
(b)Suggest two alternative dichloronaphthalenes that would have structures consistent with the spectrum given.
|
|
|
|
|
CHCI 3 |
|
|
|
|
|
|
|
|
|
|
|
|
|
|
|
|
|
|
|
|
|
|
|
|
|
|
|
|
|
|
|
|
|
|
|
|
|
|
|
|
|
|
|
|
|
|
|
|
|
|
|
|
|
|
|
|
|
|
|
|
t |
|
|
|
|
|
|
|
|
|
|
|
|
1 |
|
|
|
|
|
|
|
J \.,.J \.. |
\.0,.,, __ |
V \....I V |
|
|
|
|
|
|
|
|
|
|
|
|
|
|
|
|
|
|
7.4 |
|
7.2 |
7.0 |
|
6.8 ppm from TMS |