

page 52
5. QFD (QUALITY FUNCTIONAL DEPLOYMENT)
•Basically this relates the customer requirements (i.e., product specifications) to the product design parameters (i.e., final designs) mathematically. The result is a mathematically driven product redesign.
•Also known as House of Quality
•Advantages,
-reduction of the product design time
-cost reduction
-exposes design trade-offs early
-provides written documentation of design decisions
-design errors and corrections reduced
-provides clarity for decisions
•STEP 1: Voice of the Customer
•Identify the customers needs, wants and requirements, also known as the Voice Of the Customer (VOX).
•This ensures that the product design decisions are based on the customer and not just on the perceived customer needs.
•this should involve all groups in a company that get any feedback from customers. Special programs may also be set up to poll customers.
•the relative value that customers place on these items should also be identified.
•STEP 2: Customer Requirements Refinement
•take customer requirements and expand it to more specific points.
•this can be done with a What-to-How technique.
•for each requirement ask “What must be accomplished?”, “How will this be accomplished?”
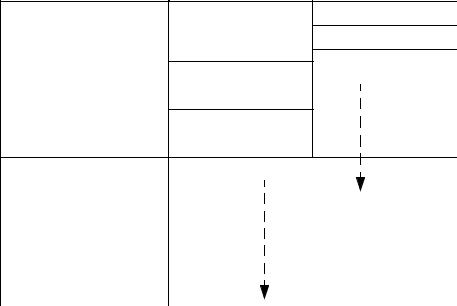
•a chart can be constructed,
page 53
REQUIIREMENTS |
WHAT |
HOW |
no breakdowns
trouble free
non-critical parts don’t break
dependable |
long life |
|
simple fast repairs
economical
• The how list should be expanded until each point is a measurable quantity (called the final-product-control-characteristic)
• Step 3: Begin Laying out the Planning Matrix
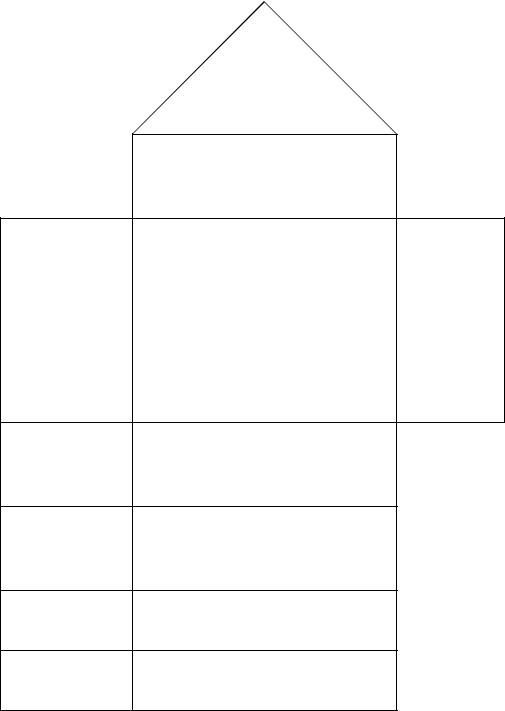
customer requirements |
customer requirements |
“WHAT” |
|
|
|
control characteristics competitive evaluation
target values
degree of technical difficulty
characteristics chosen for deployment
page 54
correlation matrix
final product
control characteristic “HOW”
relationship matrix
customer importance rating |
market evaluations |
|
|
• ************ INCLUDE FIGURE FROM pg 76 Eureka, W.E., “Quality Functional Deployment Simplified”, Technical Report, American Supplier Institute, Michigan, 1987.
page 55
|
|
|
|
|
|
rating |
market evaluations |
||||
|
|
Ride Steering Handling Reliability Durability Serviceability |
Safety |
Performance |
EconomyFuel |
customerimportance |
1 |
2 |
3 |
4 |
5 |
Requirements |
Final Product |
|
|
|
|
poor |
|
acceptable |
|
good |
|
|
|
Control |
|
|
|
|
|
|
|
|
|
Customer |
Characteristics |
|
|
|
|
|
|
|
|
|
|
|
|
|
|
|
|
|
|
|
|
||
|
reliable |
always starts |
|
|
|
|
|
|
|
|
|
Dependableis |
trouble |
functions |
|
|
|
|
|
|
|
|
|
|
free |
no trouble |
|
|
|
|
|
|
|
|
|
|
|
that stops car |
|
|
|
|
|
|
|
|
|
Product |
|
no inoperable |
|
|
|
|
|
|
|
|
|
|
no incon- |
|
|
|
|
|
|
|
|
|
|
|
|
|
|
|
|
|
|
|
|
|
|
|
|
venience |
|
|
|
|
|
|
|
|
|
|
lasts a |
no unexpected |
|
|
|
|
|
|
|
|
|
|
component fails |
|
|
|
|
|
|
|
|
|
|
|
long |
|
|
|
|
|
|
|
|
|
|
|
|
|
|
|
|
|
|
|
|
|
|
|
time |
no unexpected |
|
|
|
|
|
|
|
|
|
|
|
body deterioration |
|
|
|
|
|
|
|
|
|
|
easily |
fast servicing |
|
|
|
|
|
|
|
|
|
|
|
|
|
|
|
|
|
|
|
|
|
|
and |
parts available |
|
|
|
|
|
|
|
|
|
|
quickly |
|
|
|
|
|
|
|
|
|
|
|
service effective |
|
|
|
|
|
|
|
|
|
|
|
serviced |
|
|
|
|
|
|
|
|
|
|
|
|
|
|
|
|
|
|
|
|
|
|
•STEP 4: Fill out the Correlation Matrix to determine how factors relate,
-relate positive changes to any one of the Control Characteristics to the others. In this case 1 is a very negative effect, up to 4 which is a very positive effect. Unrelated factors have no entry.
-If too many, or too few of these spots are filled, the customer requirements should be reexamined for accuracy, etc.
-The product and process should be reconsidered if in general there are more negative
than positive effects.

page 56
|
|
correlation matrix ratings: |
|
|
|
|
|
|
|
|
|
|
|
|
||
|
|
1 - strong negative |
|
|
2 |
4 |
|
|
|
|
rating |
market evaluations |
||||
|
|
|
|
4 |
|
|
|
|
||||||||
|
|
2 - negative |
|
2 |
|
4 |
4 |
|
|
|
|
|
|
|
|
|
|
|
|
|
|
|
|
|
|
|
|
|
|
||||
|
|
3 - positive |
|
|
4 |
4 |
4 |
|
|
|
|
|
|
|
|
|
|
|
4 |
3 |
|
|
3 |
2 |
|
importancecustomer |
|
|
|
|
|
||
|
|
Ride |
Reliability |
Durability |
Safety |
EconomyFuel |
1 |
2 |
3 |
4 |
5 |
|||||
|
|
Steering |
Handling |
Serviceability |
Performance |
|||||||||||
|
|
4 - strong positive |
3 |
4 |
|
4 |
|
|
3 |
1 |
|
|
|
|
|
|
Requirements |
Final Product |
|
|
|
|
|
|
|
|
|
poor |
|
acceptable |
|
good |
|
|
|
Control |
|
|
|
|
|
|
|
|
|
|
|
|
|
|
Customer |
Characteristics |
|
|
|
|
|
|
|
|
|
|
|
|
|
|
|
|
|
|
|
|
|
|
|
|
|
|
|
|
|
|
||
|
reliable |
always starts |
|
|
|
|
|
|
|
|
|
|
|
|
|
|
Dependableis |
trouble |
functions |
|
|
|
|
|
|
|
|
|
|
|
|
|
|
|
free |
no trouble |
|
|
|
|
|
|
|
|
|
|
|
|
|
|
|
|
that stops car |
|
|
|
|
|
|
|
|
|
|
|
|
|
|
Product |
|
no inoperable |
|
|
|
|
|
|
|
|
|
|
|
|
|
|
|
no incon- |
|
|
|
|
|
|
|
|
|
|
|
|
|
|
|
|
|
|
|
|
|
|
|
|
|
|
|
|
|
|
|
|
|
|
venience |
|
|
|
|
|
|
|
|
|
|
|
|
|
|
STEP 5: Complete the relationship matrix and importance rating values.
-The relationships between the “WHATS” and “HOWS” are made in this matrix by assigning weights. For example 0-9 where 0 is none and 9 in very strong.
-The column values are then summed to give an importance rating
-This should result in a few clearly important features, and a few that are clearly not
important.

page 57
|
Relationship matrix ratings: |
|
|
|
|
4 |
|
|
|
|
rating |
|
|
|
|
|
|
|
* - strong (value = 9) |
|
|
|
|
|
|
|
|
market evaluations |
|||||||
|
|
|
|
2 |
4 |
4 |
|
|
|
||||||||
|
o - medium (value = 3) |
|
|
|
|
4 |
|
|
|
|
|
|
|
|
|
||
|
|
|
2 |
|
4 |
4 |
|
|
|
|
|
|
|
|
|
||
|
x - weak (value = 1) |
|
|
|
4 |
|
|
|
|
|
|
|
|
||||
|
|
4 |
3 |
|
|
3 |
2 |
|
importancecustomer |
|
|
|
|
|
|||
|
|
|
|
|
|
|
|
|
|
|
|
||||||
|
|
|
Ride |
Reliability |
Durability |
Safety |
EconomyFuel |
1 |
2 |
3 |
4 |
5 |
|||||
|
|
|
Steering |
Handling |
Serviceability |
Performance |
|||||||||||
|
|
|
|
3 |
4 |
|
4 |
|
|
3 |
1 |
|
|
|
|
|
|
Requirements |
Final Product |
|
|
|
|
|
|
|
|
|
|
poor |
|
acceptable |
|
good |
|
|
|
Control |
|
|
|
|
|
|
|
|
|
|
|
|
|
|
|
Customer |
Characteristics |
|
|
|
|
|
|
|
|
|
|
|
|
|
|
|
|
|
|
|
|
|
|
|
|
|
|
|
|
|
|
|
|
||
|
reliable |
always starts |
|
|
|
* |
* |
x |
|
* |
|
|
|
|
|
|
|
Dependableis |
trouble |
functions |
|
|
|
|
|
|
|
|
|
|
|
|
|
|
|
|
free |
no trouble |
|
|
|
* |
* x x * |
|
|
|
|
|
|
|
|||
|
|
that stops car |
|
|
|
|
|
|
|
|
|
|
|||||
|
|
|
|
|
|
|
|
|
|
|
|
|
|
|
|
|
|
|
|
no inoperable |
|
|
|
* |
* |
|
|
* |
|
|
|
|
|
|
|
Product |
|
|
|
|
|
|
|
|
|
|
|
|
|
|
|||
|
no incon- |
|
|
|
* |
* |
o |
|
o |
|
|
|
|
|
|
|
|
|
|
|
|
|
|
|
|
|
|
|
|
|
|||||
|
|
venience |
|
|
|
|
|
|
|
|
|
|
|
||||
|
|
|
|
|
|
|
|
|
|
|
|
|
|
|
|
|
|
|
lasts a |
no unexpected |
|
|
|
* |
* |
|
o |
* |
|
|
|
|
|
|
|
|
component fails |
|
|
|
|
|
|
|
|
|
|
|
|||||
|
long |
|
|
|
|
|
|
|
|
|
|
|
|
|
|
|
|
|
|
|
|
|
|
|
|
|
|
|
|
|
|
|
|
|
|
|
time |
no unexpected |
|
|
|
|
* |
|
|
|
|
|
|
|
|
|
|
|
|
body deterioration |
|
|
|
|
|
|
|
|
|
|
|
|
|
||
|
|
|
|
|
|
|
|
|
|
|
|
|
|
|
|
||
|
easily |
fast servicing |
|
|
|
|
|
* |
|
|
|
|
|
|
|
|
|
|
|
|
|
|
|
|
|
|
|
|
|
|
|
|
|
|
|
|
and |
parts available |
|
|
|
|
|
|
|
|
|
|
|
|
|
|
|
|
quickly |
|
|
|
|
|
|
|
|
|
|
|
|
|
|
|
|
|
service effective |
|
|
|
|
|
* |
|
|
|
|
|
|
|
|
|
|
|
serviced |
|
|
|
|
|
|
|
|
|
|
|
|
|
|
||
|
|
|
|
|
|
|
|
|
|
|
|
|
|
|
|
|
|
importance rating |
0 |
0 |
0 |
45 54 23 4 |
39 0 |
|
|
|
|
|
|
||||||
STEP 6: Customer Importance Rating and Market Evaluations
-The opinions of the customer (as collected in step 1) are quantified in terms of importance of the requirements “WHAT”s, these numbers are entered in the customer importance rating column.
-The overall ratings for the competitors products, as well as yours are ranked for each requirement “WHAT” as poor to good. These values are derived from information gathered in step 1, and entered in the Market Evaluations column.
-these sections will clearly identify the strengths and weaknesses of the product within the consumers objectives and compared to the competition.
-if these values have a reasonable distribution, the customer requirements should be reex-
amined.

page 58
|
|
|
|
|
|
|
4 |
|
|
|
|
rating |
market evaluations |
||||
|
|
|
|
|
|
2 |
4 |
4 |
|
|
|
||||||
|
|
|
|
|
2 |
|
4 |
|
|
|
|
|
|
|
|
|
|
|
|
|
|
|
|
4 |
4 |
4 |
|
|
|
|
|
|
|
|
|
|
|
|
|
4 |
3 |
|
|
3 |
2 |
|
importancecustomer |
|
|
|
|
|
|
|
|
|
Ride |
Reliability |
Durability |
Safety |
EconomyFuel |
1 |
2 |
3 |
4 |
5 |
|||||
|
|
|
Steering |
Handling |
Serviceability |
Performance |
|||||||||||
|
|
|
|
3 |
4 |
|
4 |
|
|
3 |
1 |
|
|
|
|
|
|
Requirements |
Final Product |
|
|
|
|
|
|
|
|
|
|
poor |
|
acceptable |
|
good |
|
|
|
Control |
|
|
|
|
|
|
|
|
|
|
|
|
|
|
|
Customer |
Characteristics |
|
|
|
|
|
|
|
|
|
|
|
|
|
|
|
|
|
|
|
|
|
|
|
|
|
|
|
|
|
|
|
|
||
|
reliable |
always starts |
|
|
|
* |
* |
x |
|
* |
|
2 |
A |
X |
|
B |
|
Dependableis |
trouble |
functions |
|
|
|
|
|
|
|
|
|
|
|
|
|
|
|
|
free |
no trouble |
|
|
|
* |
* |
x |
x |
* |
|
2 |
|
B |
X |
A |
|
|
|
that stops car |
|
|
|
|
|
|
|||||||||
|
|
|
|
|
|
|
|
|
|
|
|
|
|
|
|
|
|
|
|
no inoperable |
|
|
|
* |
* |
|
|
* |
|
3 |
|
X |
A |
B |
|
Product |
|
|
|
|
|
|
|
|
|
|
|||||||
|
no incon- |
|
|
|
* |
* |
o |
|
o |
|
3 |
|
X |
B |
A |
|
|
|
|
|
|
|
|
|
|
|
|||||||||
|
|
venience |
|
|
|
|
|
|
|
||||||||
|
|
|
|
|
|
|
|
|
|
|
|
|
|
|
|
|
|
|
lasts a |
no unexpected |
|
|
|
* |
* |
|
o |
* |
|
2 |
|
A |
B |
X |
|
|
component fails |
|
|
|
|
|
|
|
|||||||||
|
long |
|
|
|
|
|
|
|
|
|
|
|
|
|
|
|
|
|
|
|
|
|
|
|
|
|
|
|
|
|
|
|
|
|
|
|
time |
no unexpected |
|
|
|
|
* |
|
|
|
|
1 |
A |
|
|
B |
X |
|
|
body deterioration |
|
|
|
|
|
|
|
|
|
||||||
|
|
|
|
|
|
|
|
|
|
|
|
|
|
|
|
||
|
easily |
fast servicing |
|
|
|
|
|
* |
|
|
|
1 |
B |
X |
A |
|
|
|
|
|
|
|
|
|
|
|
|
|
|
|
|
|
|
|
|
|
and |
parts available |
|
|
|
|
|
|
|
|
|
|
|
|
|
|
|
|
quickly |
|
|
|
|
|
|
|
|
|
|
|
|
|
|
|
|
|
service effective |
|
|
|
|
|
* |
|
|
|
2 |
|
A |
B |
X |
|
|
|
serviced |
|
|
|
|
|
|
|
|
|
|
||||||
|
|
|
|
|
|
|
|
|
|
|
|
|
|
|
|
|
|
importance rating |
0 |
0 |
0 |
45 54 23 4 |
39 0 |
|
|
|
|
|
|
||||||
•STEP 7: Control Characteristics Competitive Evaluation
-Competitors products, and the internal product are compared technically. The performance criteria are done in terms of the Final Product Control Characteristics.
-Values are entered in the Control Characteristics Competitive Evaluation section of the chart, and are ranked good to poor.
-when these numbers are compared to the numbers in the Importance rating row, the tech-
nical deficiencies of the product, and it’s importance are clear.
page 59
|
|
|
|
|
|
|
|
4 |
|
|
|
|
|
rating |
market evaluations |
||||
|
|
|
|
|
|
|
2 |
4 |
4 |
|
|
|
|
||||||
|
|
|
|
|
|
2 |
|
4 |
|
|
|
|
|
|
|
|
|
|
|
|
|
|
|
|
|
|
4 |
4 |
4 |
|
|
|
|
|
|
|
|
|
|
|
|
|
|
|
4 |
3 |
|
|
3 |
|
2 |
|
importancecustomer |
|
|
|
|
|
|
|
|
|
|
Ride |
Reliability |
Durability |
Safety |
|
EconomyFuel |
1 |
2 |
3 |
4 |
5 |
|||||
|
|
|
|
Steering |
Handling |
Serviceability |
Performance |
||||||||||||
|
|
|
|
|
3 |
4 |
|
4 |
|
3 |
1 |
|
|
|
|
|
|
||
Requirements |
Final Product |
|
|
|
|
|
|
|
|
|
|
|
|
poor |
|
acceptable |
|
good |
|
|
|
Control |
|
|
|
|
|
|
|
|
|
|
|
|
|
|
|
|
|
Customer |
Characteristics |
|
|
|
|
|
|
|
|
|
|
|
|
|
|
|
|
||
|
|
|
|
|
|
|
|
|
|
|
|
|
|
|
|
|
|
||
|
reliable |
always starts |
|
|
|
|
* |
* |
x |
|
|
* |
|
2 |
A |
X |
|
B |
|
Dependableis |
trouble |
functions |
|
|
|
|
|
|
|
|
|
|
|
|
|
|
|
|
|
|
free |
no trouble |
|
|
|
|
* |
* |
x |
x |
|
* |
|
2 |
|
B |
X |
A |
|
|
|
that stops car |
|
|
|
|
|
|
|
|
|||||||||
|
|
|
|
|
|
|
|
|
|
|
|
|
|
|
|
|
|
|
|
|
|
no inoperable |
|
|
|
|
* |
* |
|
|
|
* |
|
3 |
|
X |
A |
B |
|
Product |
|
|
|
|
|
|
|
|
|
|
|
|
|||||||
|
no incon- |
|
|
|
|
* |
* |
o |
|
|
o |
|
3 |
|
X |
B |
A |
|
|
|
|
|
|
|
|
|
|
|
|
|
|||||||||
|
|
venience |
|
|
|
|
|
|
|
|
|
||||||||
|
|
|
|
|
|
|
|
|
|
|
|
|
|
|
|
|
|
|
|
|
lasts a |
no unexpected |
|
|
|
|
* |
* |
|
o |
|
* |
|
2 |
|
A |
B |
X |
|
|
component fails |
|
|
|
|
|
|
|
|
||||||||||
|
long |
|
|
|
|
|
|
|
|
|
|
|
|
|
|
|
|
||
|
|
|
|
|
|
|
|
|
|
|
|
|
|
|
|
|
|
|
|
|
time |
no unexpected |
|
|
|
|
|
* |
|
|
|
|
|
1 |
A |
|
|
B |
X |
|
|
body deterioration |
|
|
|
|
|
|
|
|
|
|
|||||||
|
|
|
|
|
|
|
|
|
|
|
|
|
|
|
|
|
|||
|
easily |
fast servicing |
|
|
|
|
|
|
* |
|
|
|
|
1 |
B |
X |
A |
|
|
|
|
|
|
|
|
|
|
|
|
|
|
|
|
|
|
|
|
|
|
|
and |
parts available |
|
|
|
|
|
|
|
|
|
|
|
|
|
|
|
|
|
|
quickly |
|
|
|
|
|
|
|
|
|
|
|
|
|
|
|
|
|
|
|
service effective |
|
|
|
|
|
* |
|
|
|
|
2 |
|
A |
B |
X |
|
||
|
serviced |
|
|
|
|
|
|
|
|
|
|
|
|||||||
|
|
|
|
|
|
|
|
|
|
|
|
|
|
|
|
|
|
|
|
importance rating |
|
0 |
0 |
0 |
45 54 23 4 |
|
39 0 |
|
|
|
|
|
|
||||||
|
|
poor 1 |
|
|
|
X |
|
|
|
|
A |
|
|
Technical difficulty ratings: |
|||||
control characteristics |
2 |
B B A |
|
X |
|
|
|
B B |
|
1 - easily achieved |
|
||||||||
|
|
|
|
|
2 - limited technical difficulty |
||||||||||||||
competitive evaluation |
3 |
|
|
|
|
|
|
|
|
|
|
|
|||||||
A |
X |
B |
A |
A |
X |
B |
|
|
A |
|
3 - limited technical problems, but |
||||||||
|
|
|
|
|
|
||||||||||||||
|
|
|
4 |
X |
|
|
B |
|
A |
X |
|
|
X |
|
|
higher cost |
|
|
|
|
|
|
|
|
|
|
|
|
4 - high technical difficulty and cost |
||||||||||
|
|
good 5 |
|
A |
X |
|
B |
B |
A |
|
X |
|
|
5 - very highly technical and costly |
|||||
•STEP 8: Evaluate the Chart
-the chart at this point contains enough information to do some critical evaluations.
-the control characteristics competitive evaluation, and the importance rating should indicate candidates for change. Primarily a high importance rating, where the competi-
tors product is rated better.
page 60
-the candidates selected should be checked to see how the correlate to the Customer Importance Rating and market evaluations. If the choice is not considered important to the customer, or less important then consider it less important. (Use the planning matrix to find effects).
-If any of the customer requirements are unanswered, then the requirements/control characteristics list must be reconsidered.
STEP 9: Develop new target values
-using current implemented design parameters, and the relative importance exposed in the last step, new target values should be selected.
-the values determined for the competitors products should be used as well as in-house data for the product.
-a separate sheet, or document may be used here because descriptions may become bulky.
STEP 10: Technical Difficulty
-considering the target values and previous production performance, the difficulty of achieving the target value should be estimated.
-a ranking for this is entered in the “Degree of Technical Difficulty” row.
page 61
|
|
correlation matrix ratings: |
|
|
|
|
|
|
|
|
|
|
|
|
|
||||
|
|
1 - strong negative |
|
|
2 |
4 |
|
|
|
|
|
rating |
market evaluations |
||||||
|
|
|
|
4 |
|
|
|
|
|
||||||||||
|
|
2 - negative |
|
|
|
2 |
|
4 |
4 |
|
|
|
|
|
|
|
|
|
|
|
|
|
|
|
|
|
|
|
|
|
|
|
|
|
|
||||
|
|
3 - positive |
|
|
|
|
4 |
4 |
4 |
|
|
|
|
|
|
|
|
|
|
|
|
|
|
4 |
3 |
|
|
3 |
|
2 |
|
importancecustomer |
|
|
|
|
|
||
|
|
|
|
Ride |
Reliability |
Durability |
Safety |
|
EconomyFuel |
1 |
2 |
3 |
4 |
5 |
|||||
|
|
|
|
Steering |
Handling |
Serviceability |
Performance |
||||||||||||
|
|
4 - strong positive |
3 |
4 |
|
4 |
|
3 |
1 |
|
|
|
|
|
|
||||
Requirements |
Final Product |
|
|
|
|
|
|
|
|
|
|
|
|
poor |
|
acceptable |
|
good |
|
|
|
Control |
|
|
|
|
|
|
|
|
|
|
|
|
|
|
|
|
|
Customer |
Characteristics |
|
|
|
|
|
|
|
|
|
|
|
|
|
|
|
|
||
|
|
|
|
|
|
|
|
|
|
|
|
|
|
|
|
|
|
||
|
reliable |
always starts |
|
|
|
|
* |
* |
x |
|
|
* |
|
2 |
A |
X |
|
B |
|
Dependableis |
trouble |
functions |
|
|
|
|
|
|
|
|
|
|
|
|
|
|
|
|
|
|
free |
no trouble |
|
|
|
|
* |
* |
x |
x |
|
* |
|
2 |
|
B |
X |
A |
|
|
|
that stops car |
|
|
|
|
|
|
|
|
|||||||||
|
|
|
|
|
|
|
|
|
|
|
|
|
|
|
|
|
|
|
|
|
|
no inoperable |
|
|
|
|
* |
* |
|
|
|
* |
|
3 |
|
X |
A |
B |
|
Product |
|
|
|
|
|
|
|
|
|
|
|
|
|||||||
|
no incon- |
|
|
|
|
* |
* |
o |
|
|
o |
|
3 |
|
X |
B |
A |
|
|
|
|
|
|
|
|
|
|
|
|
|
|||||||||
|
|
venience |
|
|
|
|
|
|
|
|
|
||||||||
|
|
|
|
|
|
|
|
|
|
|
|
|
|
|
|
|
|
|
|
|
lasts a |
no unexpected |
|
|
|
|
* |
* |
|
o |
|
* |
|
2 |
|
A |
B |
X |
|
|
component fails |
|
|
|
|
|
|
|
|
||||||||||
|
long |
|
|
|
|
|
|
|
|
|
|
|
|
|
|
|
|
||
|
|
|
|
|
|
|
|
|
|
|
|
|
|
|
|
|
|
|
|
|
time |
no unexpected |
|
|
|
|
|
* |
|
|
|
|
|
1 |
A |
|
|
B |
X |
|
|
body deterioration |
|
|
|
|
|
|
|
|
|
|
|||||||
|
|
|
|
|
|
|
|
|
|
|
|
|
|
|
|
|
|||
|
easily |
fast servicing |
|
|
|
|
|
|
* |
|
|
|
|
1 |
B |
X |
A |
|
|
|
|
|
|
|
|
|
|
|
|
|
|
|
|
|
|
|
|
|
|
|
and |
parts available |
|
|
|
|
|
|
|
|
|
|
|
|
|
|
|
|
|
|
quickly |
|
|
|
|
|
|
|
|
|
|
|
|
|
|
|
|
|
|
|
service effective |
|
|
|
|
|
* |
|
|
|
|
2 |
|
A |
B |
X |
|
||
|
serviced |
|
|
|
|
|
|
|
|
|
|
|
|||||||
|
|
|
|
|
|
|
|
|
|
|
|
|
|
|
|
|
|
|
|
importance rating |
|
0 |
0 |
0 |
45 54 23 4 |
|
39 0 |
|
|
|
|
|
|
||||||
|
|
poor 1 |
|
|
|
X |
|
|
|
|
A |
|
|
Technical difficulty ratings: |
|||||
control characteristics |
2 |
B B A |
|
X |
|
|
|
B B |
|
1 - easily achieved |
|
||||||||
|
|
|
|
|
2 - limited technical difficulty |
||||||||||||||
competitive evaluation |
3 |
|
|
|
|
|
|
|
|
|
|
|
|||||||
A |
X |
B |
A |
A |
X |
B |
|
|
A |
|
3 - limited technical problems, but |
||||||||
|
|
|
|
|
|
||||||||||||||
|
|
|
4 |
X |
|
|
B |
|
A |
X |
|
|
X |
|
|
higher cost |
|
|
|
|
|
|
|
|
|
|
|
|
4 - high technical difficulty and cost |
||||||||||
|
|
good 5 |
|
A |
X |
|
B |
B |
A |
|
X |
|
|
5 - very highly technical and costly |
|||||
target values |
|
Relationship matrix ratings: |
|
|
|
||
degree of technical difficulty |
3 3 4 1 2 4 3 55 |
* - strong (value = 9) |
|
o - medium (value = 3) |
|||
|
|
||
|
|
x - weak (value = 1) |
|
characteristic chosen for |
X |
||
|
|||
deployment |
|
||
|
|
page 62
•STEP 11: Deployment Selection
-quality has a cost, and at this point the cost/benefit trade-off is made.
-one or more factors can be selected. If there are not a few clear choices, the process should be reexamined
-the main objectives here are to select the elements with the lowest technical difficulties, but the greatest importance ratings
-this decision will be slightly arbitrary, but it should not be far outside of what the chart suggests.
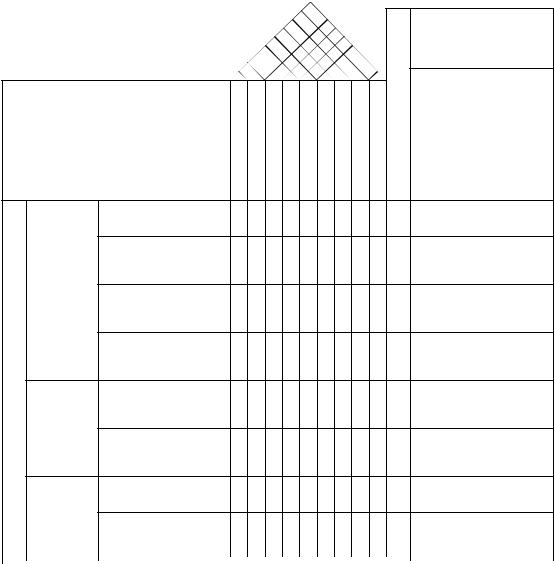
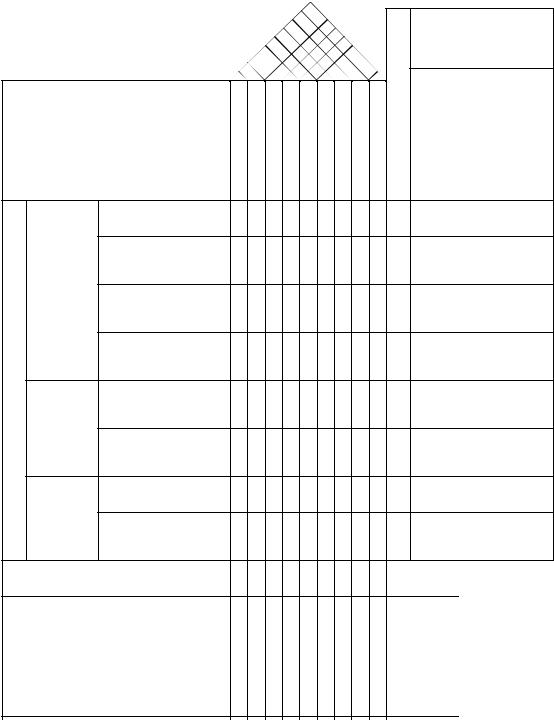
•STEP 12: Deployment Matrices
-for each control characteristic selected in the last step a deployment matrix is developed
-the top of the matrix is developed using factors discussed in development of the planning matrix
-the relationship between testable components and the “WHAT”s of durability are put here.
-the control characteristics measured for all products, and the target values are positioned below.
-the bottom matrix is system components that can be affected by design. On the left are the systems they affect, and the components in those systems. On the right are the measurable variables, and in the centre are the locations to track the relative quality of the components.

page 63
|
|
|
|
|
|
power train |
body |
|
|
front end |
|
|
||
|
strong effect = x |
|
|
|
|
|
|
|
|
|
|
|||
|
|
operationweathercold |
operationweatherhot |
environmentsalt |
environmenthumid |
resistantscratch |
surfaceroadrough |
resistanceimpact |
|
|
||||
|
mild effect = o |
|
|
|
||||||||||
|
|
|
|
|
|
|
|
|
|
|
||||
|
|
|
|
|
|
|
|
|
|
|
|
|
|
|
durability |
|
power train |
|
x |
o |
|
|
|
|
|
|
|
||
|
|
|
|
|
|
|
|
|
|
|||||
|
|
|
|
|
|
|
|
|
|
|
|
|
|
|
|
|
body |
|
|
|
|
|
x |
|
o |
|
|
|
|
|
|
|
|
|
|
|
|
|
|
|
|
|
|
|
|
|
front end |
|
|
|
|
|
|
x |
x |
|
|
||
|
|
|
|
|
|
|
|
|
|
|
|
|
||
control |
|
vehicle |
95 |
95 |
90 |
90 |
90 |
105 |
105 |
|
|
|||
characteristics |
X |
|
|
|||||||||||
competitive |
|
A |
105 |
105 |
105 |
105 |
105 |
110 |
110 |
|
|
|||
evaluations |
|
|
B |
110 |
110 |
100 |
100 |
100 |
110 |
110 |
|
|
||
|
|
|
|
|
|
|
|
|
|
|
||||
control charateristics |
115% |
115% |
115% |
115% 115% |
115% |
115% |
|
|
||||||
targets |
|
|
|
|
|
|||||||||
|
|
|
|
|
|
|
|
|
|
|
|
|||
|
|
|
|
|
|
|
|
|
|
|
||||
subsystem |
component |
|
|
|
|
|
|
|
finished comp- |
|||||
|
|
|
|
|
|
|
|
|
|
|
|
|
onent characteristic |
|
front |
springs |
|
|
|
|
|
|
|
|
rate |
|
|||
|
|
|
|
|
|
|
|
|
|
|||||
suspension |
|
|
|
|
|
|
|
|
|
|
|
|
||
|
|
|
|
|
|
|
|
|
|
free height |
||||
|
|
|
|
|
|
|
|
|
|
|
|
|
||
|
|
|
|
|
|
|
|
|
|
|
|
|
|
|
|
|
|
|
shocks |
|
|
|
|
|
|
|
|
damping |
|
|
|
|
|
|
|
|
|
|
|
|
|
|
|
|
|
|
|
|
|
|
|
|
|
|
|
|
|
|
|
|
|
|
|
|
|
|
|
|
|
|
|
|
choke spring |
|
carburetor |
|
choke |
|
|
|
|
|
|
|
|
tension |
|||
|
|
|
|
|
|
|
|
|
|
|
||||
|
|
|
|
|
|
|
|
|
|
|
|
|
thermal reaction |
|
|
|
|
|
|
|
|
|
|
|
|
|
|
|
|
•STEP 13: Design and test
-the deployment matrix is used to do design work, test the results, and compare them to