


Corrosion-passivation processes in a cellular automata |
703 |
|
|
In the initial implementation we used an elegant iteration scheme based on C construction of a function calling itself, which from site to site labels all sites pertaining to a cluster. It led however to stack overflows and we switched to a less elegant but more stable explicit depth-first search method [20]. The simulations presented here were performed on a Quad Dual Xeon 2.5 GHz PC. Single simulation run took up to 7 hours. The code is written in C and compiled with gcc version 4.1.2. The simulations of a similar but simpler problem avoiding connectivity checking in 3D for a similarly sized 1000 × 1000 × 500 box take a week on CUDA GPU Tesla C2050. Our first attempts to implement the connectivity checking extended this time to 1 month and led to introduction of a different approach to circumvent the connectivity problem. We do not see however how to apply the circumvention to more complicated problem of electrochemical reaction and are looking for another solution that would make 3D simulations more practical.
3 Results
The results of the simulations starting from the initial condition as in Fig. 3a are already published and discussed [17, 18]. Here we show some additional examples illustrating the peculiar behavior of the cavity shape and the main features of these results.
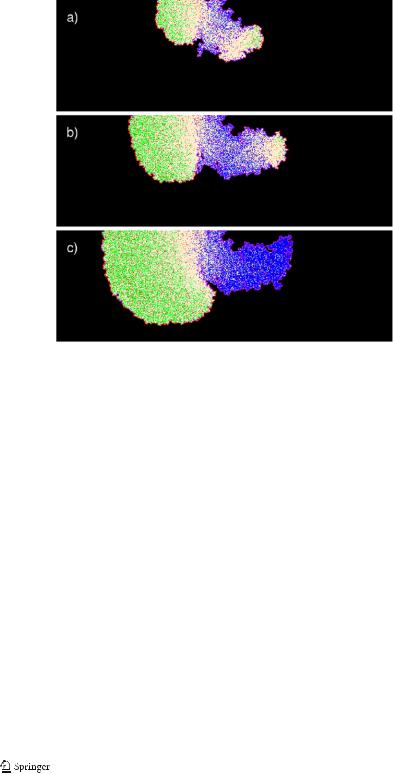
In a large domain of explored parameters the development of the cavity follows the same scenario. Initially the development of the corrosion cavity is isotropic and uniform characterized by a low corrosion rate due to a small depassivation probability. Initially the cavity shape is roughly a semicircle. It is neutral, as for the small cavity size diffusion is able to bring about mutual neutralization of B and A sites. This breaks down as soon as the cavity size goes beyond a critical size defined by an average incubation radius RI after an average incubation time tI . The zones of cathodic passivated sites appear. The solution gets basified in the vicinity of these zones. In the rest of the surface the reactive sites acidify the neighboring solution when dissolved in the anodic reaction. The zone separation leads to a speedup of corrosion by a simultaneous pit creation and pit merging process. We see a crossover from a slower to a higher corrosion rate. At this crossover the cavity shape is extremely unstable, depending on the random pattern of zones created by spontaneous symmetry breaking. An example of such a pattern formation and its further development is given in Fig. 4. In Fig. 4a we see the initial stage of the zone separation. The cavity resembles in shape a beetle with an abdomen, thorax and head. The abdomen and head are acidified and progress via anodic dissolution while the thorax in the middle is basified and preserves the rough structure of healed small pits resembling insect legs (Fig. 4b). Finally the head turns up and stops progressing due to basification (Fig. 4c). It makes us think about the lacy cover effect where the corroded cavity is covered by a layer of uncorroded material and the cavity development can make holes in the cover around the original orifice [23]. Another example (Fig. 5) shows how insidious localized corrosion can be proceeding inwards to the material and leaving the cavity orifice small. In both cases we see with bare eyes the relative smoothness of the anodic zones as compared to rough cathodic zones. This feature
704 |
J. Stafiej et al. |
|
|
Fig. 4 Cavity development that may lead to a lacy cover formation. The time steps are 1020, 1080 and 1140 for (a), (b) and (c), respectively, and poxi = 0.001, pcor1 = 0.0, pcor2 = 0.0, Ndiff = 100
is observed experimentally. It appears at an early stage of zone separation as seen in Fig. 6 for a higher diffusion rate of A and B . Here the rough structure of cathodic region is clearly seen to form from small anodic regions arising spontaneously and hiding in the pores against the neutralizing effect of the basic majority that preserves this structure. In contrast, anodic dissolution smooths out the pores dissolving material around them. This peculiar behavior of symmetry breaking and formation of rough cathodic and smooth anodic regions is experimentally found in experiments on corrosion of aluminum foil in quasi 2D experiments [24, 25].
When the cavity size is large compared to the incubation radius, the cavity shape assumes again a roughly circular form as the random symmetric breaking averages out at lengths much larger than the incubation radius. The solution may seem isotropic again. However, magnifying the image near the surface reveals that the solution is composed of basic and acidic regions that determine a higher rate constant of dissolution after the incubation.
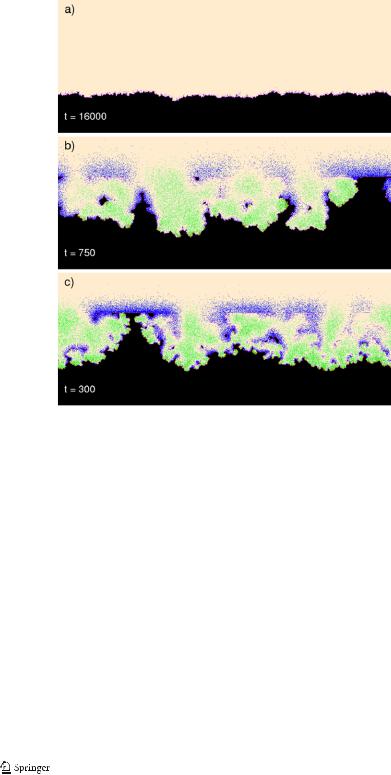
Let us present some results on the evolution in time of an initially planar front. We first study the effect of the delocalization of the anodic and cathodic reactions in a geometry which is no longer confined. In Fig. 7, starting from the case where there are no delocalized reactions, we observe for increasing values of the probability psse the evolution of the corrosion front. We see that both the corrosion rate and the roughness increase with increasing the delocalization probability of the anodic and cathodic reactions. The effect of the probability psse is to increase the heterogeneity
Corrosion-passivation processes in a cellular automata |
705 |
|
|
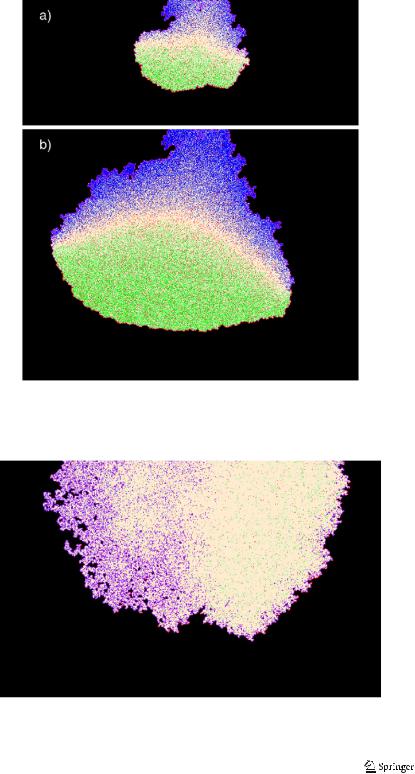
Fig. 5 Insidious cavity development inwards to the corroded material. The time steps are 1060 and 1380 for (a) and (b), respectively. Parameters identical to those of Fig. 4, only the initial random seed is modified
Fig. 6 Initial stage of zone separation for a higher diffusion rate Ndiff = 10,000 at the time step 1580 and remaining parameters identical to Fig. 4
706 |
J. Stafiej et al. |
|
|
Fig. 7 Snapshots of the corroding surface for equivalent corrosion depths and different time steps as
indicated. Simulation parameters are as follows: poxi = 0.005, pcor1 = 0.99, pcor2 = 0.002, Ndiff = 2 and psse = 0.0, 0.15, 0.50 respectively for (a), (b) and (c). The metal M is at the bottom and the solution at the top. The color codes are shown in Fig. 1
of the corrosion front with, in particular, the appearance of acidic regions with higher corrosion rates resulting in a more pronounced roughness of the corrosion front.
In Fig. 8 we show snapshots at selected values of simulation time for an intermediate value of psse. We observe an evolution from the initial flat state to a surface covered by corrosion pits. The pits develop and merge (t = 1650). When merging is mostly done, a relatively smooth surface reappears. Then large irregularities (t = 3550) of the surface show up again. The irregularities take form of fancy shaped peninsulas. The snapshots of the corrosion front from t = 1400 to t = 1650 show how the peninsula gets insulated from the main front and becomes an island. After the island detachment, the front is smoother. The island then gets corroded (t = 1650 and t = 1850), attacked mostly in the acidic region adjacent to it. This peculiar behavior of the corrosion front, alternatively smooth and rough, is seen in Fig. 9, which gives the plot of the front roughness as measured by σ , the root of the mean square deviation of the front position from its average.
Corrosion-passivation processes in a cellular automata |
707 |
|
|
Fig. 8 Snapshots of the corroding surface at selected time steps. Simulation parameters are as in Fig. 7 with psse = 0.15
The front roughness shows oscillatory behavior owing to alternative pit formation, pit merging and detachment of islands from corroded peninsulas. Island detachment is observed already for other models of corrosion and in the real world experiments. It gives an explanation for anomalous dissolution as the chunk effect [21]. The discussion of this effect, in the case of silver dissolution, dating back to 1958 corresponds well to our model [26]. A more recent account on the chunk effect can also be found [27].
Here we should explain why we illustrate our simulations with just a single run. It does not differ qualitatively from about a hundred of independent similar runs and illustrates a typical situation. However, averaging over these runs gives a featureless quasi-monotonous curve with no resemblance to the typical roughness profile. Clearly we cannot describe correctly this corrosion process by an average roughness profile. Averaging loses a vital part of information that we perceive visually even if we do not know how to describe it quantitatively.