

02a_EU_policies-regional_policy
.pdfMANAGEMENT
Disparities across the European Union
Hi |
Lo |
Ratio |
GDP per cap |
Luxembourg |
Bulgaria |
|
(% EU27 |
251% |
33% |
7.6* |
average) |
|
||
|
|
|
|
|
|
|
|
Population |
Germany |
Malta |
|
|
82.5 million |
404,000 |
204 |
|
|
*In US, this difference is only 2.5 and in Japan 2
MANAGEMENT
How much does it cost?
One third of the EU budget 2007-2013 €347 billion over 7 years

MANAGEMENT
What does the EU citizen get for this?
The three funds target:
•ERDF (€201 billion): regional development, economic decline in industrial or rural areas, competitiveness and co-operation
•(ESF) (€76 billion): employment, social inclusion and tackling discrimination
•Cohesion Fund (€70 billion): environment and transport
with overarching aim of “boosting growth and employment”
MANAGEMENT
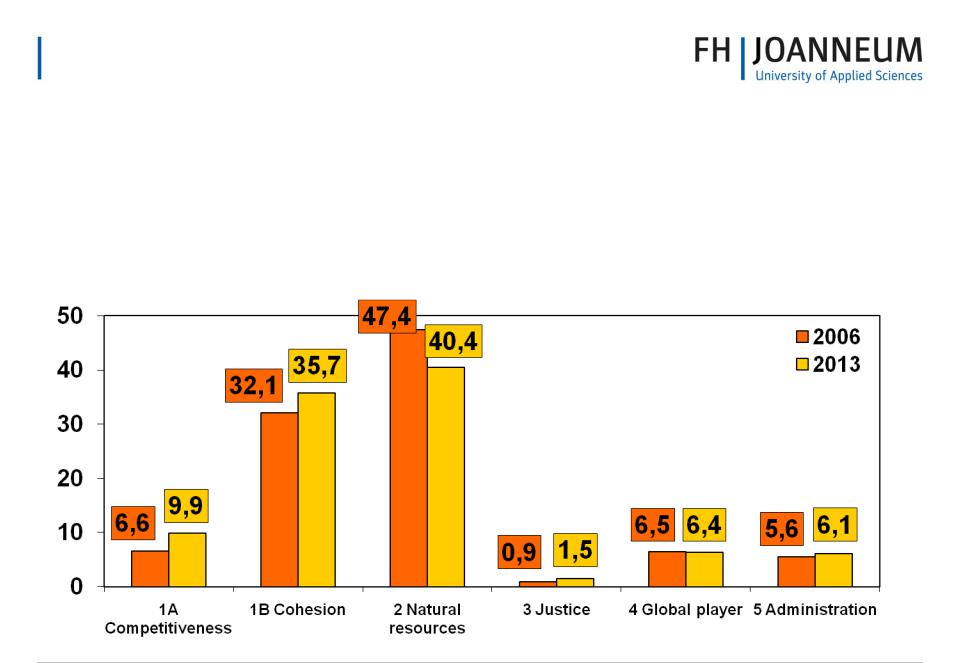
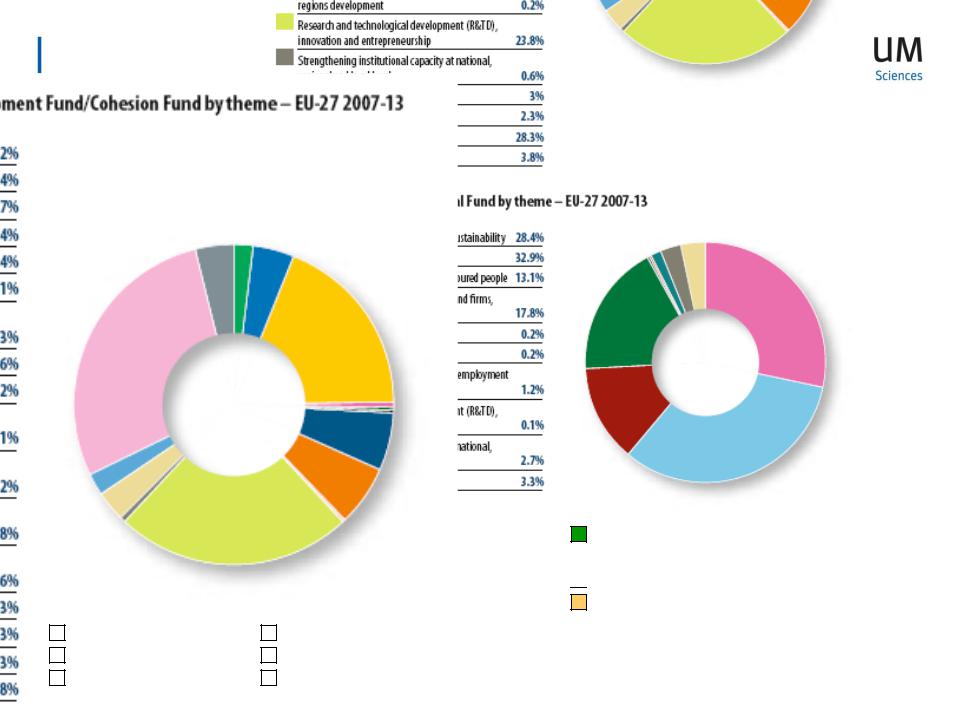
What do we spend the money on?
European Regional Development Fund |
European Social Fund (€76 billion) |
and Cohesion Fund (€271 billion) |
|
Employment
Environment
Transport
Human capital
Adaptability of workers and firms
Research/Innovation 
 Social inclusion
 Capacity building
Technical assistance
|
|
Information society |
|
Tourism |
|
|
|
||
|
|
Social infrastructure |
|
Culture |
|
|
|
||
|
|
Energy |
|
Institutional capacity |
|
|
|

MANAGEMENT
Does this fit with other EU priorities?
•Boosting growth and employment central to the wider EU agenda – “Lisbon Strategy”
•Lisbon is the EU’s blueprint for competiveness and sustainable growth
•Prioritises:
increasing levels of innovation to help businesses move up the value chain
Bringing more of Europe’s population into employment

MANAGEMENT
Boosting growth and jobs: is regional policy putting this into practice?
•Concentration of the effort on competitiveness (21st century activities)
Member States must ‘earmark’ resources on such strategic investments (€230 billion now targeted on Lisbon priorities)
•Concentration of resources on least prosperous
Regions with GDP per head below 75% of EU average: over ¼ of
population
Member States with GDP per head below 90% of average: 13 MS with 25% of population

MANAGEMENT
Who gets what?
•Convergence 81.9% (regions lagging behind the most)
•Competitiveness 15.7%
•Territorial co-operation 2.4%
•Total budget €347bn, which will unlock up to €700bn
A method based on what works: Programming, Partnership and Decentralised Management
MANAGEMENT
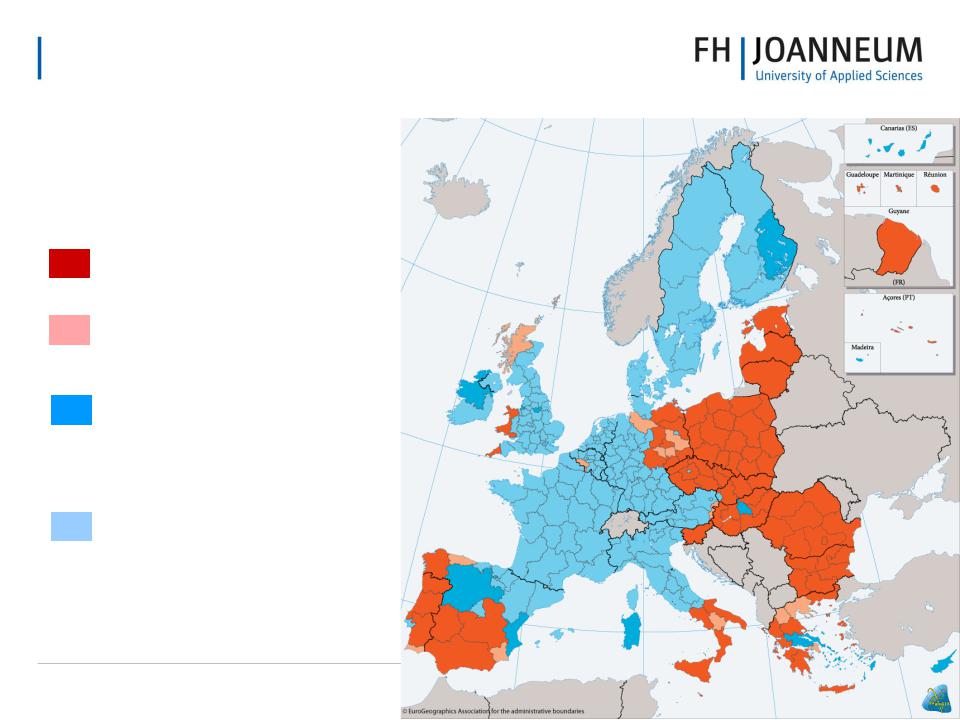
Geographical Eligibility for Structural Funds Support 2007-2013
Convergence objective
(Regions < 75% in EU 25)
Convergence objective statistically affected regions
Objective 'Regional Competitiveness and Employment'
Phasing-in regions, "naturally" above 75%
Objective 'Regional
Competitiveness and
Employment'
Index EU 25 =
100

MANAGEMENT
Who can apply for funds?
•Huge range of potential recipients:
Businesses including SMEs
Public bodies
Associations
Voluntary groups
•All projects considered if meet selection criteria of managing authority of relevant programme
•Compulsory publication of beneficiary lists

MANAGEMENT
Is it worth it?
•Evidence suggests positive contribution to growth, national convergence and reduction of interregional disparities
•Ex-post evaluations demonstrate positive employment effects
•Clear benefits in terms of regional governance
Since 2000, investments have created some 600,000 net jobs, 160,000 in new Member States.
Every euro invested led to an average € 0.9 in additional funding from public and private sources. In more developed regions, this induced expenditure can go as high as 3 times the initial investment.