

02c_enlargement
.pdfMANAGEMENT
Enlargement 2004/07
01.07.2013 |
Hier steht der Name des Autors |
11 |

MANAGEMENT
Central and Eastern Europe’s Trade Arrangements (1)
•In 1989, democracy swept away communism throughout Central and Eastern Europe, with the fall of the Berlin Wall in September often viewed as the symbolic culmination of the process.
•These events took the whole world, but the European Community reacted swiftly with emergency aid and loans to the fledgling democracies.
•These newly free CEECs all expressed their firm intention of joining the European Union, but the EU proved quite resistant.
•Instead, the EU signed Association Agreements, commonly known as Europe Agreements, with Poland, Hungary and Czechoslovakia in 1991.

MANAGEMENT
CEE’s Trade Arrangements (2)
•EU-CEEC Association Agreements establish bilateral free trade areas between the EU and the individual CEECs.
•They committed the EU to removing tariffs and quantitative restrictions on most industrial products by the end of 1994, with the CEECs being allowed a longer transition period.
•Importantly, substantial protection remains for a group of 'sensitive' industrial products including some textiles, some coal and steel products, and almost all agricultural trade.
•Beyond the liberalisation of most industrial goods, a further goal is "to make progress towards realising between them the other economic freedoms on which the Community is based."

MANAGEMENT
CEE’s Trade Arrangements (3)
•To this end, the EAs contain provisions governing the movement of services, capital and people. The Agreements progressively liberalise trade in services.
•They also provide for bilateral national treatment of firms.
•Finaly, a very important element of the Europe Agreements is the commitment of the CEECs to adopt laws on economic and related issues that approximate the EU laws. This includes competition rules and limits on state aid to industries.

MANAGEMENT
CEE’s Trade Arrangements (4)
•The modest nature of the EA, i.e. bilateral free trade agreements instead of a deeper pluri-lateral arrangement such as the EEA, reflected the EU’s profound ambivalence towards EU membership for the CEECs.
•For instance, the entry into force of the Europe Agreements was substantially delayed by the slow action of the Parliaments of EU member states.
•Among others factors, the lack of a grand vision for Europe and the lack of high-level political engagement in many EU member states contributed to the long delay. Trade between the CEECs and EU was governed by so-called Interim Agreements in the mean time, which can be thought of as EAs minus the political provisions.

MANAGEMENT
CEE’s Trade Arrangements (5)
•Much of the EU’s hesitancy was eliminated in June 1994, when the European Council decided at their 1993 Copenhagen meeting that "the associated countries in CEE that so desire shall become members of the European Union."
•Throughout the early 1990s, EFTA followed a policy of "parallelism" with the EU concerning East-West ties.
–That is, as soon as a CEEC had an EA with the EU, EFTA quickly negotiated an EA-like agreements.
–Due to disagreements in EFTA over the pace of market opening to the East, several EFTAns signed bilateral deals with several CEECs.

MANAGEMENT
What Does it Take to qualify for Membership in the EU:
The candidate country has achieved stability of institutions guaranteeing democracy, the rule of law, human rights and respect for and protection of minorities
The candidate country has the existence of a functioning market economy, as well as the capacity to cope with competitive pressure and market forces within the Union.
The candidate country has the ability to take on the obligations of membership, including adherence to the aims of political, economic and monetary union.
MANAGEMENT
ENLARGEMENT:
10 more countries became EU Member States in 2004
country - date of EU application
•Cyprus - 3 July 1990
•Malta - 16 July 1990
•Hungary - 31 March 1994
•Poland - 5 April 1994
•Romania - 22 June 1995
•Slovakia - 27 June 1995
•Latvia - 13 October 1995
•Estonia - 24 November 1995
•Lithuania - 8 December 1995
•Bulgaria - 14 December 1995
•Czech Republic - 17 January 1996
•Slovenia - 10 June 1996
MANAGEMENT
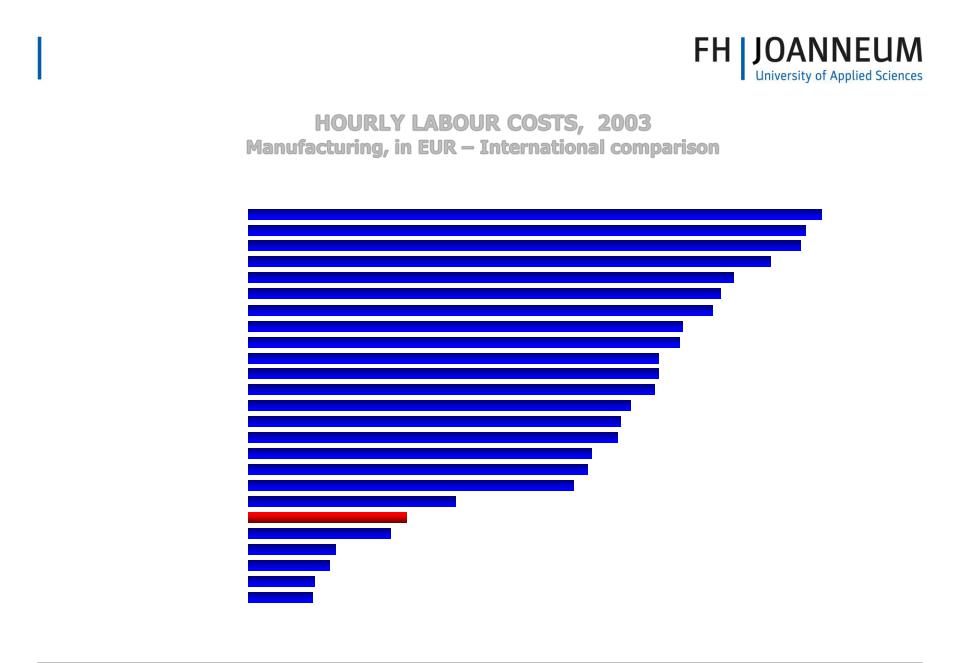
HOURLY LABOUR COSTS, 2003
Manufacturing, in EUR – International comparison
Norway |
|
|
|
|
|
|
|
|
|
|
|
|
|
|
|
|
|
|
|
|
|
|
|
|
28.2 |
|
|
|
|
|
|
|
|
|
|
|
|
|
|
|
|
|
|
|
|
||||||
Denmark |
|
|
|
|
|
|
|
|
|
|
|
|
|
|
|
|
|
|
|
|
|
27.3 |
|||
|
|
|
|
|
|
|
|
|
|
|
|
|
|
|
|
|
|
||||||||
|
|
|
|
|
|
|
|
|
|
|
|
|
|
|
|
|
|
|
|
|
|
||||
West Germany |
|
|
|
|
|
|
|
|
|
|
|
|
|
|
|
|
|
|
|
|
27.1 |
||||
|
|
|
|
|
|
|
|
|
|
|
|
|
|
|
|
|
|||||||||
Switzerland |
|
|
|
|
|
|
|
|
|
|
|
|
|
|
|
|
|
|
25.6 |
|
|
|
|
|
|
|
|
|
|
|
|
|
|
|
|
|
|
|
|
|
|
|
|
|
|
|
|||||
Belgium |
|
|
|
|
|
|
|
|
|
|
|
|
|
|
|
|
|
23.8 |
|
|
|
|
|
|
|
|
|
|
|
|
|
|
|
|
|
|
|
|
|
|
|
|
|
|
|
|
|
||||
Netherlands |
|
|
|
|
|
|
|
|
|
|
|
|
|
|
|
|
23.2 |
|
|
|
|
|
|
|
|
|
|
|
|
|
|
|
|
|
|
|
|
|
|
|
|
|
|
|
|
|
|||||
|
|
|
|
|
|
|
|
|
|
|
|
|
|
|
|
|
|
|
|
|
|
|
|
|
|
Sweden |
|
|
|
|
|
|
|
|
|
|
|
|
|
|
|
22.8 |
|
|
|
|
|
|
|
||
|
|
|
|
|
|
|
|
|
|
|
|
|
|
|
|
|
|
|
|
||||||
Austria |
|
|
|
|
|
|
|
|
|
|
|
|
|
|
21.3 |
|
|
|
|
|
|
|
|
|
|
|
|
|
|
|
|
|
|
|
|
|
|
|
|
|
|
|
|
|
|
|
|||||
Luxemburg |
|
|
|
|
|
|
|
|
|
|
|
|
|
|
21.2 |
|
|
|
|
|
|
|
|
|
|
|
|
|
|
|
|
|
|
|
|
|
|
|
|
|
|
|
|
|
|
|
|
||||
France |
|
|
|
|
|
|
|
|
|
|
|
|
|
20.2 |
|
|
|
|
|
|
|
|
|
|
|
|
|
|
|
|
|
|
|
|
|
|
|
|
|
|
|
|
|
|
|
|
|||||
Finland |
|
|
|
|
|
|
|
|
|
|
|
|
|
20.2 |
|
|
|
|
|
|
|
|
|
|
|
|
|
|
|
|
|
|
|
|
|
|
|
|
|
|
|
|
|
|
|
|
|||||
|
|
|
|
|
|
|
|
|
|
|
|
|
|
|
|
|
|
|
|
|
|
|
|
|
|
USA |
|
|
|
|
|
|
|
|
|
|
|
|
|
19.9 |
|
|
|
|
|
|
|
|
|
|
|
|
|
|
|
|
|
|
|
|
|
|
|
|
|
|
|
|
|
|
|
|
|||||
UK |
|
|
|
|
|
|
|
|
|
|
|
|
18.7 |
|
|
|
|
|
|
|
|
|
|
|
|
|
|
|
|
|
|
|
|
|
|
|
|
|
|
|
|
|
|
|
|
|
|||||
|
|
|
|
|
|
|
|
|
|
|
|
|
|
|
|
|
|
|
|
|
|
|
|
|
|
Japan |
|
|
|
|
|
|
|
|
|
|
|
18.3 |
|
|
|
|
|
|
|
|
|
|
|
|
|
|
|
|
|
|
|
|
|
|
|
|
|
|
|
|
|
|
|
|
|
|
|||||
|
|
|
|
|
|
|
|
|
|
|
|
|
|
|
|
|
|
|
|
|
|
|
|
|
|
Ireland |
|
|
|
|
|
|
|
|
|
|
|
18.1 |
|
|
|
|
|
|
|
|
|
|
|
|
|
|
|
|
|
|
|
|
|
|
|
|
|
|
|
|
|
|
|
|
|
|
|||||
East Germany |
|
|
|
|
|
|
|
|
|
|
16.9 |
|
|
|
|
|
|
|
|
|
|
|
|
|
|
|
|
|
|
|
|
|
|
|
|
|
|
|
|
|
|
|
|
|
|
|
|||||
|
|
|
|
|
|
|
|
|
|
|
|
|
|
|
|
|
|
|
|
|
|
|
|
|
|
Italy |
|
|
|
|
|
|
|
|
|
|
16.7 |
|
|
|
|
|
|
|
|
|
|
|
|
|
|
|
|
|
|
|
|
|
|
|
|
|
|
|
|
|
|
|
|
|
|
|
|
||||
Spain |
|
|
|
|
|
|
|
|
|
16.0 |
|
|
|
|
|
|
|
|
|
|
|
|
|
|
|
|
|
|
|
|
|
|
|
|
|
|
|
|
|
|
|
|
|
|
|
|
|||||
Greece |
|
|
|
|
|
|
|
|
10.2 |
|
|
|
|
|
|
|
|
|
|
|
|
|
|
|
|
|
|
|
|
|
|
|
|
|
|
|
|
|
|
|
|
|
|
|
|
|
|
||||
SLOVENIA |
|
|
|
|
|
|
|
7.8 |
|
|
|
|
|
|
|
|
|
|
|
|
|
|
|
|
|
|
|
|
|
|
|
|
|
|
|
|
|
|
|
|
|
|
|
|
|
|
|
||||
Portugal |
|
|
|
|
|
|
7.0 |
|
|
|
|
|
|
|
|
|
|
|
|
|
|
|
|
|
|
|
|
|
|
|
|
|
|
|
|
|
|
|
|
|
|
|
|
|
|
|
|||||
Czech |
|
|
|
|
|
4.3 |
|
|
|
|
|
|
|
|
|
|
|
|
|
|
|
|
|
|
|
|
|
|
|
|
|
|
|
|
|
|
|
|
|
|
|
|
|
|
|
|
|
||||
Hungary |
|
|
|
|
|
4.0 |
|
|
|
|
|
|
|
|
|
|
|
|
|
|
|
|
|
|
|
|
|
|
|
|
|
|
|
|
|
|
|
|
|
|
|
|
|
|
|
|
|||||
Poland |
|
|
|
3.3 |
|
|
|
|
|
|
|
|
|
|
|
|
|
|
|
|
|
|
|
||
|
|
|
|
|
|
|
|
|
|
|
|
|
|
|
|
|
|
|
|
||||||
|
|
|
|
|
|
|
|
|
|
|
|
|
|
|
|
|
|
|
|
|
|
|
|
|
|
Slovakia |
|
|
|
3.2 |
|
|
|
|
|
|
|
|
|
|
|
|
|
|
|
|
|
|
|
||
|
|
|
|
|
|
|
|
|
|
|
|
|
|
|
|
|
|
|
|
||||||
Source: IW-Koeln, August 2004; for Slovenia SKEP GZS
SKEP GZS

MANAGEMENT
AFTER ACCESSION
•Impact of EU accession is difficult to measure after only two years and it corresponds with effects of globalization
•Positive effects:
–simplification of documentary flows (no more customs procedures)
–increased growth due to positive expectations,
–More stable macroeconomic environment
–Increased trade with old-EU countries
–Better representation of interests in Brussels
•Negative effects:
–Negative trends in labour intensive sector, food processing industry and textile industry – BUT THIS IS A PROBLEM OF GLOBALISATION.