

25.Bergman I. Improvements in or relating to membrane electrodes and cells. UK patent, 1,200,595. 1970.
26.Li S, Wang Z, Zeng B, Liu J. Multiple respiratory gas monitoring causes changes of inspired oxygen concentration in closed anesthesia system. J Tong Med Univ 1997;17:54– 56.
27.Heusner AA, Hurley JP, Arbogast R. Coulometric microrespirometry. Am J Physiol 1982;243:R 185–192.
28.Hickam WM. Device for monitoring oxygen content of gases. US patent, 3,347,767. 1967.
29.Hickam WM. Oxygen control and measuring apparatus. US patent, 3,650,934. 1972.
30.Sodal IE, Micco AJ, Weil JV. An improved fast response oxygen analyzer with high accuracy for respiratory gas analysis. Biomed Sci Instrumentat 1975;11:21–24.
31.Weil JV, Sodal IE, Speck RP. A modified fuel cell for the analysis of oxygen concentration. J Appl Physiol 1967;23: 419–422.
32.Deportes CH, Henault MPS, Tasset F, Vitter GRR. Electrochemical gauge for measuring partial pressure of oxygen. US patent, 4,045,319. 1977.
33.Sayles DA. Method and apparatus for continuously seeing the condition of a gas stream. US patent, 3,869,370. 1975.
34.Kocache RMA, Swan J, Holman DF. A miniature rugged and accurate solid electrolyte oxygen sensor. J Phys E Sci Instrum 1984;17:477–482.
35.Servomex. Zirconia oxygen analysis. Electronic Source, Servomex Corporation. Available at http://www.servomex.- com / Servomex.nsf / GB / technology_zirconia.html. Accessed 2005.
36.Gryczynski Z, Gryczynski I, Lakowicz JR. Fluorescence-sen- sing methods. Methods Enzymol 2003;360:44–75.
37.Peterson JI, Fitzgerald RV, Buckhold DK. Fibre-optic probe for in vivo measurement of oxygen partial pressure. Anal Chem 1984;56:62–67.
38.Burke CS, et al. Development of an integrated optic oxygen sensor using a novel, generic platform. The Analyst 2005;130: 41–45.
39.Polerecki L, Hamrle J, MacCraith BD. Theory of the radiation of dipoles placed within a multilayer system. Appl Op 2000; 39:3968–3977.
40.Gryczynski I, Gryczynski Z, Rao G, Lakowicz JR. Polarizationbased oxygen sensor. Analyst 1999;124:1041–1044.
41.VanWagenen RA, et al. Dedicated monitoring of anesthetic and respiratory gases by Raman scattering. J Clin Monitoring 1986;2:215–222.
42.Westenskow DR, Coleman DL. Can the Raman scattering analyzer compete with mass spectrometers: an affirmative reply. J Clin Monitoring 1989;5:34–36.
43.Westenskow DR, Coleman DL. Raman scattering for respiratory gas monitoring in the operating room: advantages, specifications, and future advances. Biomed Inst Technol 1989;23:485–489.
44.Westenskow DR, et al. Clinical evaluation of a Raman scattering multiple gas analyzer for the operating room. Anesthesiology 1989;70:350–355.
45.Definition of Warburg Apparatus. Electronic Source, MedicineNet, Inc. Available at http://www.medterms.com/script/ main/art.asp?articlekey=7150; Accessed 2005.
46.Scholand Pf, Hammel HT, Bradstre E, Hemmings E. Sap pressure in vascular plants - negative hydrostatic pressure can be measured in plants. Science 1965;148: 339.
See also FIBER OPTICS IN MEDICINE; GAS AND VACUUM SYSTEMS,
CENTRALLY PIPED MEDICAL; OXYGEN MONITORING.
OXYGEN SENSORS |
209 |
OXYGEN SENSORS
STEVEN J. BARKER
University of Arizona
Tucson, Arizona
INTRODUCTION
This article reviews recent advances in the monitoring of patient oxygenation. We summarize the transport of oxygen from the atmosphere to the cell, and describe monitors that function at four stages of the O2 transport process. These four stages include respired gas, arterial blood, tissue, and venous blood. History and recent developments in pulse oximetry will be discussed. Continuous intraarterial blood-gas sensors will be described and contrasted with other oxygen monitors. Finally, tissue oxygen monitoring and mixed-venous oximetry are discussed.
OXYGEN TRANSPORT IN THE HUMAN BODY
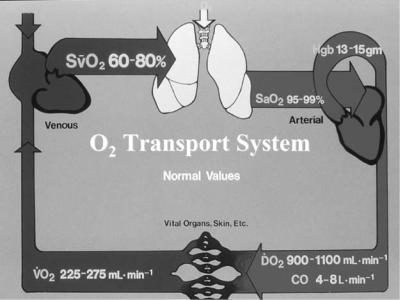
At rest, we consume 1023 molecules of oxygen per second. Our complex cardiopulmonary system has developed to rapidly transport this large amount of oxygen from the atmosphere to every cell in the body (Fig. 1).
The equation for arterial blood oxygen content (CaO2) shows that 99% of the oxygen in arterial blood is in the
form of hemoglobin-bound oxygen: |
|
CaO2 ¼ 1:38ðSaO2=100ÞðHbÞ þ 0:003 PaO2 |
(1) |
where CaO2 is in units of milliliters per deciliter of blood (also called vols%); SaO2 is the arterial hemoglobin saturation in percent; Hb is the total hemoglobin concentration in grams per deciliter; and PaO2 is the arterial oxygen tension (partial pressure) in millimeters of mercury. Upon inserting typical arterial values [SaO2 ¼ 100%, Hb ¼ 15 g dL 1, PaO2 ¼ 100 mmHg (13.33 kPa)], we find that normal CaO2 is 21 mL dL 1. The amount of oxygen delivered to the tissues in the arterial blood is then given by the cardiac output (CO) times the CaO2 (neglecting the small dissolved oxygen term):
DO2 ¼ 13:8ðCOÞðHbÞðSaO2=100Þ |
(2) |
(The factor 1.38 becomes 13.8 because Hb is normally measured in grams per deciliter, while CO is measured in liters per minute. There are 10 dL in 1 L.)
Finally, the oxygen consumption by the tissues (VO2) is determined by the difference between arterial oxygen delivery and venous oxygen return:
VO2 ¼ 13:8ðHbÞðCOÞðSaO2 SvO2Þ=100 |
(3) |
This Fick equation can be solved for any of the four oxygen variables involved.
If we substitute normal resting values into the equation, we predict a resting VO2 of
VO2 ¼ 13:8 ð15 g dL 1Þð5 L min 1Þð99 75Þ=100 ¼ 248 mL min 1
210 OXYGEN SENSORS
Figure 1. Schematic of the oxygen transport system. Arterial blood leaving the left ventricle (right side of figure) has and oxygen content of 21 mL dL 1, and the total oxygen delivery (DO2) is roughly 1000 mL min 1. At rest, 0.25 of this oxygen delivery is consumed (VO2), leaving a mixed venous saturation of 75%.
During exercise or stress we can rapidly increase cardiac output to at least 20 L min 1, and decrease venous saturation to 40%, yielding a VO2 of
VO2 ¼ 13:8 ð15 g dL 1Þð20 L min 1Þð99 40Þ=100 ¼ 2029 mL min 1
The human ability to rapidly adjust cardiac output (CO) and mixed-venous oxygen saturation (SvO2) can be used to compensate for disease processes that affect other transport variables, such as anemia (hemoglobin) or hypoxemia (SaO2). For example, consider a severely anemic patient with Hb value of 2.5 g dL 1, who compensates by increasing cardiac output to 15 L min 1 and decreasing venous saturation to 50%:
VO2 ¼ 13:8 ð2:5 g dL 1Þð15 L min 1Þð99 50Þ=100 ¼ 254 mL min 1
This extremely anemic patient can thus maintain a normal oxygen consumption by adaptations in CO and SvO2 that are milder than those we use during normal exercise.
OXYGEN IN THE ARTERIAL BLOOD: PULSE OXIMETRY
Physiologic Considerations
The normal relationship between SaO2 and PaO2 is the familiar oxyhemoglobin dissociation curve, shown in Fig. 2. Three convenient points on this curve to remember are PaO2 ¼ 27 mmHg (3.60 kPa), SaO2 ¼ 50%; PaO2 ¼ 40 mmHg (5.33 kPa), SaO2 ¼ 75%; and PaO2 ¼ 60 mmHg (8.00 kPa), SaO2 ¼ 90%. The curve will be shifted toward the right by acidosis, hypercarbia, or increasing 2,3-DPG. At PaO2, values greater than 80 mmHg (10.66 kPa), SaO2 is almost 100% and thus becomes virtually independent of PaO2. It is important to remember this fact
during SaO2 monitoring in the operating room, where elevated inspired oxygen fraction (FIO2) values will yield PaO2 values much > 80 mmHg (10.66 kPa) most of the time.
A knowledge of the relationship between SaO2 and PaO2 allows us to predict the physiologic limitations of saturation monitoring by pulse oximetry. Specifically, the pulse oximeter will give no indication of downward trends in PaO2 during anesthesia at elevated FIO2 until PaO2 values < 80–90 mmHg (10.66–12.00 kPa) are reached. In an animal study, intentional endobronchial intubations at FIO2 values > 30% were not detected by the pulse oximeter
(1). This results from the fact that the PaO2 after endobronchial intubation did not decrease below 80 mmHg (10.66 kPa) when FIO2 was elevated.
Technology
Oximetry, a subset of spectrophotometry, determines the concentrations of various hemoglobin species by measuring the absorbances of light at multiple wavelengths. The absorbance spectra of the four most common hemoglobin species are shown in Fig. 3. The number of oximeter light wavelengths used must be equal to or greater than the number of hemoglobin species present in the sample. A laboratory CO-oximeter, which uses four or more wavelengths, can measure the concentrations of reduced hemoglobin, oxyhemoglobin, methemoglobin, and carboxyhemoglobin. If all four hemoglobin species are present in significant concentrations, then an oximeter must have at least four light wavelengths to determine the concentration of any of the four species.
The conventional pulse oximeter is a two-wavelength oximeter that functions in vivo. Conventional pulse oximetry first determines the fluctuating or alternating current (ac) component of the light absorbance signal. At each of its two wavelengths the oximeter divides the ac signal by the

|
|
|
|
|
|
|
Oxyhemoglobin dissociation curve |
|||||||
|
100 |
|
|
|
|
|
|
|
|
|
|
|
|
|
|
|
|
|
|
|
|
|
|
|
|
|
|
|
|
percent |
90 |
|
|
|
|
|
|
|
|
|
|
|
|
|
|
|
|
|
|
|
|
|
|
|
|
|
|
||
80 |
|
|
|
|
|
|
|
|
|
|
|
|
|
|
|
|
|
|
|
|
|
|
|
|
|
|
|
|
|
saturation, |
70 |
|
|
|
|
|
|
|
|
|
|
|
|
|
|
|
|
|
|
|
|
|
|
|
|
|
|
||
60 |
|
|
|
|
|
|
|
|
|
pH |
||||
|
|
|
|
|
|
|
|
|
|
|
|
|
|
|
Oxygen |
50 |
|
|
|
|
|
|
|
|
|
|
|
|
|
|
|
|
|
|
|
|
|
|
|
|
|
|
||
40 |
|
|
|
|
|
|
|
|
|
Temp. |
||||
|
|
|
|
|
|
|
|
|
|
|||||
|
30 |
|
|
|
|
|
|
|
|
|
||||
|
|
|
|
|
|
|
|
|
|
2,3 DPG |
||||
|
|
|
|
|
|
|
|
|
|
|||||
|
20 |
|
|
|
|
|
|
|
|
|
||||
|
|
|
|
|
|
|
|
|
|
PCO2 |
||||
|
|
|
|
|
|
|
|
|
|
|||||
|
10 |
|
|
|
|
|
|
|
|
|
||||
|
|
|
|
|
|
|
|
|
|
|
|
|
|
|
|
|
|
|
|
|
|
|
|
|
|
|
|
|
|
|
|
|
|
|
|
|
|
|
|
|
|
|
|
|
|
|
|
|
|
|
|
|
|
|
|
|
|
||
PO2 mmHg 10 20 |
30 40 50 60 70 80 90 100 |
|||||||||||||
OXYGEN SENSORS |
211 |
Figure 2. The oxyhemoglobin dissociation curve: a plot of hemoglobin oxygen saturation as a function of oxygen tension (PO2). The curve is shifted to the right with decreasing pH or increasing temperature, PCO2, or 2,3-DPG.
corresponding fixed or direct current (dc) absorbance component, to obtain a pulse-added absorbance. It then calculates the ratio of the two pulse-added absorbances (one for each wavelength), and this ratio R is related to arterial hemoglobin saturation by a built-in calibration algorithm. The resulting pulse oximeter saturation estimate is called SpO2. The calibration curve of the pulse oximeter is empirical; that is, it is based on human volunteer experimental data.
Sources of Error
Dyshemoglobins. As previously noted, the pulse oximeter uses two wavelengths and can distinguish only two hemoglobin species: reduced hemoglobin and
oxyhemoglobin. If either carboxyhemoglobin (COHb) or methemoglobin (MetHb) is present, the pulse oximeter effectively has fewer equations than unknowns, and it cannot find any of the hemoglobin concentrations. It is thus unclear a priori how the pulse oximeter will behave in the presence of these dyshemoglobins.
Two animal experiments have characterized pulse oximeter behavior during methemoglobinemia and carboxyhemoglobinemia. In one of these, dogs were exposed to carbon monoxide (220 ppm) over a 3–4 h period
(2). At a COHb level of 70% (meaning that 70% of the animal’s hemoglobin was in the COHb form), the SpO2 values were 90%, whereas the actual SaO2 was 30% (Fig. 4). The pulse oximeter thus ‘‘sees’’
Extinction coefficient
|
|
|
|
|
Hemoglobin extinction curves |
|
|
|
|
|
||||||||||||||||||||
.01 |
|
|
|
Red |
|
|
|
|
|
|
|
|
|
|
|
|
|
|
|
Infrared |
||||||||||
.01 |
|
|
|
|
|
|
|
|
|
|
|
|
|
|
|
|
|
|
|
|
|
|
|
|
|
Methemoglobin |
||||
|
|
|
|
|
|
|
|
|
|
|
|
|
|
|
|
|
|
|
|
|
|
|
|
|
||||||
|
|
|
|
|
|
|
|
|
|
|
|
|
|
|
|
|
|
|
|
|
|
|
|
|
|
Oxyhemoglobin |
||||
.01 |
|
|
|
|
|
|
|
|
|
|
|
|
|
|
|
|
|
|
|
|
|
|
|
|
|
|
|
Reduced |
||
|
|
|
|
|
|
|
|
|
|
|
|
|
|
|
|
|
|
|
|
|
|
|
|
|
||||||
|
|
|
|
|
|
|
|
|
|
|
|
|
|
|
|
|
|
|
|
|
|
|
|
|
|
|
|
|
|
hemoglobin |
|
|
|
|
|
|
|
|
|
|
|
|
|
Carboxyhemoglobin |
|
|
|
|
|
||||||||||||
.01 |
|
|
|
|
|
|
|
|
|
|
|
|
|
|
|
|
|
|
|
|
|
|
|
|
|
|
|
|
|
|
600 640 |
680 |
720 |
760 |
800 |
840 |
880 |
920 |
960 1000 |
||||||||||||||||||||||
100%
Hb |
80 |
|
|
|
|
|
|
|
|
|
|
|
|
||
|
|
|
|
|
|
|
|
2 |
|
|
|
|
|
|
|
or O |
60 |
|
|
|
|
|
|
2 |
|
|
|
|
|
|
|
SpO |
|
|
|
|
|
|
|
SATURATION |
40 |
|
|
|
|
|
|
|
|
|
|
|
|
|
|
|
20 |
|
|
|
|
|
|
|
0 |
|
|
|
|
|
|
SpO2
O2Hb
F iO2 = 1.0
20 |
40 |
60 |
80 |
100% |
COHb
Figure 3. Extinction coefficient (or light absorbance) versus wavelength of light for four different hemoglobins. reduced Hb, O2Hb, COHb, and MetHb. The two wavelengths used by most pulse oximeters (660 nm, 930 nm) are indicated by vertical lines.
Figure 4. The effect of carbon monoxide on pulse oximetry. Plots of Hb saturation measured by & laboratory CO-oximeter, and & conventional pulse oximeter, as functions of COHb level. As COHb increases, CO-oximeter shows linear decline in saturation, while pulse oximeter remains > 90% saturation (2).
212 OXYGEN SENSORS
carboxyhemoglobin as if it were composed mostly of oxyhemoglobin.
In a similar animal experiment, increasing methemoglobin concentrations (up to 60%) produced SpO2
readings that gradually decreased to |
85% (3). As these |
animals were further desaturated |
by lowering the |
FIO2 during methemoglobinemia, the pulse oximeter SpO2 reading failed to track either functional or fractional saturation. On the other hand, the presence of fetal hemoglobin has little effect on pulse oximeter accuracy, which is fortunate in the treatment of premature neonates. There are conflicting anecdotal reports on the influence of sickle hemoglobin, and it is impossible to perform volunteer hypoxia studies on patients with sickle-cell disease.
As of this date, no commercially available pulse oximeter can either measure dyshemoglobins or function accurately in the presence of substantial levels of COHb or MetHb. Masimo Inc. has very recently (March, 2005) announced the development of a new Rainbow Technology pulse oximeter that uses multiple light wavelengths to measure COHb and SaO2 simultaneously. There are as yet no published data regarding the success of this approach, but it is a potentially important new advancement.
Intravenous Dyes. As abnormal hemoglobin species can adversely affect the accuracy of pulse oximetry, so can intravenous dyes injected during surgery or critical care. Two studies found that intravenous methylene blue causes large, rapid decreases in displayed SpO2 without changes in actual saturation, and that indocyanine green causes smaller false decreases in SpO2 (4,5). Intravenous fluorescein or indigo carmine appeared to have little effect.
Reductions in Peripheral Pulsation; Ambient Light. Several studies have examined the effects of low perfusion upon SpO2 (6,7). In a clinical study of critically ill patients during a wide range of hemodynamic conditions, extremes in systemic vascular resistance were associated with loss of pulse oximeter signal or decreased accuracy. During reduced pulse amplitude, pulse oximeters may become more sensitive to external light sources, such as fluorescent room lights (8). Most modern pulse oximeters effectively measure and correct for ambient light intensity.
Motion Artifact. Patient motion, which causes a large fluctuating absorbance signal, is a very challenging artifact for pulse oximetry. Motion artifact rarely causes great difficulty in the operating room, but in the recovery room and intensive care unit it can make the pulse oximeter virtually useless. Design engineers have tried several approaches to this problem, beginning with increasing the signal averaging time. Most current pulse oximeters allow the user to select one of several time averaging modes. However, improving motion performance by simply increasing averaging time is potentially dangerous—it can cause the instrument to miss signifi-
cant, but short-lived hypoxemic events, which are very common in neonates.
Masimo, Inc. has developed a completely different approach to the analysis of the oximeter light absorbance signals, using adaptive digital filtering. This has led to improved accuracy and reliability during motion artifact, both in laboratory studies (9,10) and in the neonatal intensive care unit (11). The new technology has spurred other manufacturers (e.g., Nellcor, Philips, Datex-Ohmeda) to improve their signal analysis methods, so that today’s generation of pulse oximeters has much improved performance during motion.
Venous Pulsations. Conventional pulse oximeter design is predicated on the assumption that the pulsatile component of tissue light absorbance is entirely caused by arterial blood. However, the light absorbance of venous blood can also have a pulsatile component, and this may affect SpO2 values under some conditions (12). Conventional pulse oximeters may read falsely low values or may fail to give any reading in circumstances leading to venous congestion. This can occur, for example, when using an earlobe sensor on a patient who is undergoing mechanical ventilation, or who is in the Trendelenberg position.
Penumbra Effect. When a pulse oximeter sensor is not properly positioned on the finger or earlobe, the light traveling from the source to the detector may pass through the tissues at only grazing incidence. This penumbra effect reduces the signal/noise ratio, and may result in SpO2 values in the low 1990s in a normoxemic subject. More importantly, a volunteer study has shown that in hypoxemic subjects, the penumbra effect can cause SpO2 to either overestimate or underestimate actual SaO2 values, depending on the instrument used (13). A pulse oximeter with a malpositioned sensor may therefore indicate that a patient is only mildly hypoxemic when in fact he or she is profoundly so.
OXYGEN IN THE ARTERIAL BLOOD: CONTINUOUS INTRAARTERIAL PO2 MEASUREMENT
There have been a number of efforts to monitor intraarterial oxygen tension directly and continuously, using miniaturized sensors passed through arterial cannulas. The first practical approach to this problem employed the Clark electrode, the same oxygen electrode used in the conventional laboratory blood-gas analyzer. Although miniaturized Clark electrodes have been used in several clinical studies, the technique never achieved popularity because of problems with calibration drift and thrombogenicity (14). More recently, the principle of fluorescence quenching was used to develop fiberoptic ‘‘optodes’’ that can continuously monitor pH, PaCO2, and PaO2 through a 20 gauge radial artery cannula (Fig. 5).
Fluorescence quenching is a result of the ability of oxygen (or other substances to be measured) to absorb energy from the excited states of a fluorescent dye, thus preventing this energy from being radiated as light.
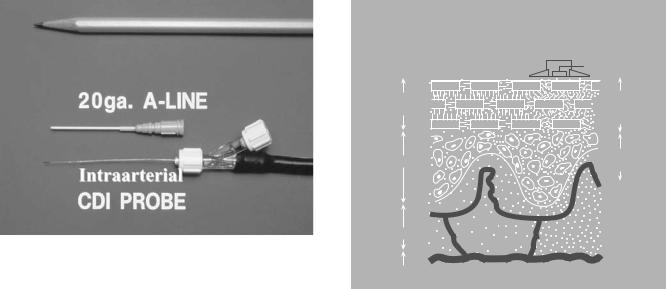
Figure 5. An intraarterial fiber-optic optode sensor. The optode is 0.6 mm in diameter and fits easily through a 20 gauge radial artery cannula, also shown.
Lubbers and Opitz (15) developed the first fluorescence quenching optode that simultaneously measured oxygen and carbon dioxide tensions in gases or liquids. In the 1980s, optodes were successfully miniaturized for intraarterial use, and several studies were reported in both animal and humans (16,17).
Clinical Studies
Several clinical studies suggested the usefulness of intraarterial optodes in the operating room (18). The scatter (random error) of optode oxygen tension values is lowest at low oxygen tensions, a characteristic of these sensors. The accuracy of the optode appeared to be within the clinically acceptable range when 18-gauge arterial cannulas were used. The optode can display complete blood-gas data continuously at the patient’s bedside, with a time response measured in seconds. Nevertheless, the high costs of the disposable sensors ( $300 each) and their inconsistent reliability have caused the intraarterial optodes to disappear from the clinical market. These devices have other potential applications in tissues and organs, which may be realized in the future. One manufacturer today is marketing an optode sensor for assessment of the viability of tissue grafts.
OXYGEN IN TISSUE: TRANSCUTANEOUS OXYGEN
Physiologic Considerations
The transcutaneous oxygen (PtcO2) sensor is a Clark electrode that measures oxygen diffusing through the surface of the skin from dermal capillaries (Fig. 6). The sensor must be heated to at least 43 8C (in adults) to facilitate diffusion through the stratum corneum. Surface heating also produces local hyperemia of the dermal capillaries, which tends to ‘‘arterialize’’ the blood and cause a rightward shift in the oxyhemoglobin dissociation curve. The effects above tend to increase PtcO2, and these are counterbalanced by other effects that decrease it, namely
OXYGEN SENSORS |
213 |
TRANSCUTANEOUS PO2 MEASUREMENT
|
TRANSCUTANEOUS |
|
SENSOR |
STRATUM |
HEATED |
CORNEUM |
STRATUM |
|
CORNEUM |
EPIDERMIS |
HYPEREMIC |
|
DERMIS |
||
|
DERMIS
HYPODERMIS
Figure 6. Schematic of transcutaneous PO2 sensor on skin surface. Heat from sensor ‘‘melts’’ the diffusion barrier of the stratum corneum layer, and ‘‘arterializes’’ the blood in the dermal capillaries beneath.
diffusion gradients and metabolic oxygen consumption by the skin. In neonates, these competing effects nearly cancel and PtcO2 is approximately equal to PaO2. In adults, the stratum corneum is thicker and hence the PtcO2 is usually lower than PaO2. The transcutaneous index, PtcO2/PaO2, has average values of 1.0 in neonates, 0.9 in pediatric patients, 0.8 in adults, and 0.6–0.7 in the elderly.
The most serious challenges with the interpretation of PtcO2 values are their dependence upon cardiac output and skin perfusion. Several studies have shown that the transcutaneous index falls when the cardiac index decreases below its normal range (19). Animal shock studies have shown that PtcO2 decreases when either PaO2 or cardiac index decreases, and that it closely follows trends in oxygen delivery (i.e., the product of CO and CaO2). In other words, PtcO2 monitors oxygen delivery to the tissues rather than oxygen content of arterial blood.
Technical Problems
There are several practical problems associated with the use of PtcO2 sensors. The transcutaneous electrode must be gas calibrated before each application to the skin, and then the sensor requires a 10–15 min warmup period. In children, the warm-up period is usually shorter. The sensor membrane and electrolyte must be replaced at least once a week. The heated PtcO2 electrode can cause small skin burns, particularly at temperatures of 44 8C or greater. Lower probe temperatures (43 or 43.5 8C) should be used on premature infants and neonates, and the sensor location should be changed every 2–3 h. In adults with a sensor temperature of 44 8C, we have used the same location for 6–8 h with no incidence of burns.
214 OXYGEN SENSORS
Summary
Transcutaneous oxygen sensors provide continuous, noninvasive monitoring of oxygen delivery to tissues. By contrast, pulse oximetry provides continuous monitoring of arterial hemoglobin saturation. The dependence of PtcO2 on blood flow as well as PaO2 sometimes makes it difficult to interpret changing values. If PtcO2 is normal or high, we know that the tissues are well oxygenated. When PtcO2 is low, we must determine whether this is the result of low PaO2 or a decrease in skin perfusion.
OXYGEN IN VENOUS BLOOD: PULMONARY ARTERY OXIMETRY
Physiology of Mixed-Venous Saturation
Oxygen saturation in venous blood is related to venous oxygen content CvO2 by an equation similar to equation 1:
CvO2 ¼ 1:38ðHbÞðSvO2Þ=100 þ 0:003ðPvO2Þ (4)
The normal CvO2 value [with SvO2 ¼ 75%, PvO2 ¼ 40 mmHg (5.33 kPa)] is 15.6 mL dL 1. If we solve equation 3 (the Fick equation) for the venous saturation (SvO2), we obtain:
SvO2 ¼ SaO2 VO2=½ð13:8ÞðHbÞðCOÞ& |
(5) |
Equation 8 shows how SvO2 depends on the four oxygen transport variables: SaO2, VO2, Hb, and CO.
When VO2 falls behind oxygen demand, lactic acidosis will result, eventually leading to death if the problem is
not corrected. When this begins to occur in disease (e.g., anemia), the patient’s body will try to maintain normal VO2 using the same two compensatory mechanisms described above during exercise: increasing CO and/or decreasing SvO2. In the case of anemia, we saw that such compensation can maintain normal VO2 values even at hemoglobin levels < 3 g dL 1. Thus, a decrease in SvO2 indicates that a patient is using oxygen reserves to compensate for a supply–demand imbalance. Decreasing oxygen supply may result from low CO (shock), low hemoglobin (anemia), abnormal hemoglobin (carboxyhemoglobinemia), or low PaO2 (hypoxemia). On the other hand, increasing oxygen demand can result from fever, malignant hyperthermia, thyrotoxicosis, or shivering.
The aforementioned are possible clinical causes of a decrease in SvO2. There are also conditions that can increase SvO2 above its normal range of 68–77%. High SvO2 values can result from decreased tissue uptake of oxygen, peripheral arteriovenous shunting, and inappropriate increases in CO. Clinical conditions that produce elevated SvO2 values include sepsis, Paget’s disease of bone, excessive use of inotropes, cyanide poisoning, and hypothermia. A wedged pulmonary artery catheter will also cause a high SvO2 reading, but this is a measurement artifact. This can actually be a useful artifact, since it warns the clinician of an inadvertently wedged catheter.
Technical Considerations
Pulmonary artery SvO2 catheters use the technology of reflectance spectrophotometry; that is, they measure the color of the blood in a manner similar to pulse oximetry. The SvO2 catheters use fiberoptic bundles to transmit and receive light from the catheter tip. Light-emitting diodes provide monochromatic light sources at two or three wave-
|
100 |
|
|
90 |
|
|
80 |
CO 2.9 1/min |
|
70 |
|
|
60 |
|
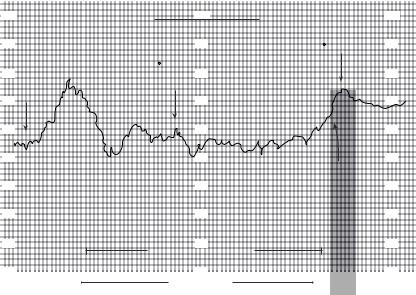
Figure 7. Effect of oxygen consumption (VO2) |
50 |
|
|
|
|
upon mixed venous saturation (SvO2). After |
40 |
|
weaning from cardiopulmonary bypass, the |
|
|
|
|
|
SvO2 reaches a normal value of 75%, but then |
30 |
|
falls to 55%. Measured VO2 at this time is 564 |
|
|
|
|
|
mL min 1, or twice normal resting value. Patient |
20 |
|
noted to be shivering. Administration of muscle |
|
|
relaxant stops shivering, restores VO2 to normal |
10 |
|
(207 mL min 1), and SvO2 also returns to normal |
70 |
|
values. |
|
|
EFFECT of SHIVERING |
CO 5.6 l/min 100 |
||
|
−100 |
||
|
SvO2 |
− |
76 |
|
|
SvO2 |
|
|
90 |
|
90 |
CO 6.8 l/min |
VO2 = 207 cc/min |
||
|
|
||
VO2 |
= 564 cc/min |
|
80 |
|
80 |
|
|
|
70 |
|
70 |
|
60 |
|
60 |
|
50 |
|
50 |
|
|
Pavulon® |
|
|
40 |
|
40 |
|
30 |
|
30 |
|
20 |
|
20 |
MARKED SHIVERING |
|
|
|
|
10 |
71 |
10 |
|
ONE HOUR |
|
|
lengths. (Currently, the Edwards system uses two wavelengths, while the Abbott instrument employs three.) A theoretical advantage of a three wavelength system is that its measurements should not depend on the total hemoglobin level (20). Another problem common to all SvO2 catheters is the so-called wall artifact, whereby reflection from a vessel wall can produce a signal that is interpreted as an SvO2 of 85–90%. This problem has been reduced by the addition of digital filtering to the processor, which effectively edits out sudden step increases in SvO2. However, a persistently high value of SvO2 may alert the user that the catheter is in the wedged condition, as noted above.
Applications and Limitations
When interpreting continuous SvO2 versus time tracings in the operating room and intensive care unit, we must always consider equation 5, the Fick equation solved for SvO2. When SvO2 changes, we should ask which term(s) in equation 5 are responsible. In the operating room, the terms most likely to change significantly are cardiac output (CO) and hemoglobin (Hb). During general anesthesia with mechanical ventilation, SaO2 and VO2 are usually constant, with the exception that VO2 will decrease during hypothermia. On the other hand, this is not the case in the intensive care unit. Patients in respiratory failure will have varying degrees of arterial desaturation (low SaO2). Note that SvO2 is directly related to SaO2; if SaO2 decreases by 20% and nothing else changes, then SvO2 will decrease by 20%. Critical care unit patients may also have frequent changes in VO2, which can be increased by agitation, shivering, coughing, fever, pain, seizures, defecation, or eating, to name just a few (Fig. 7).
Continuous SvO2 is a valuable adjunct in the treatment of ventilator-dependent patients. As positive end-expira- tory pressure (PEEP) is slowly increased to improve oxygenation, SaO2 will usually increase, but eventually the cardiac output will begin to decrease as venous return is compromised. At this point, oxygen delivery to tissue may begin to decrease (and SvO2 begins to decrease) even though SaO2 is still increasing. SvO2 is a reflection of oxygen delivery in this situation, and can thus provide a means to optimize positive end-expiratory pressure without the need of serial blood gases and CO measurements.
In summary, continuous SvO2 monitoring is a valuable technology for the operating room and the critical care unit. It reflects the overall health and functional state of the oxygen transport system. To realize the most benefit from this monitor, it is essential to thoroughly understand the physiology of SvO2 and how it relates to the other oxygen transport variables.
CONCLUSIONS
Monitoring of oxygen in the respired gases and arterial blood is the standard of care during all anesthetics today.
OXYGEN SENSORS |
215 |
None of us would consider administering general anesthesia without both an FiO2 monitor and a pulse oximeter. New advances in pulse oximetry will make these instruments more reliable in moving or poorly perfused patients, but they will still be subject to the fundamental limitations of saturation monitoring. Further developments will include pulse oximeters that can function in the presence of COHb and MetHb. In the near future, noninvasive monitors of oxygenation in specific organs and tissues (heart, brain) will become available. Finally, mixed venous oxygen saturation indicates how much is ‘‘left over’’ at the end of the oxygen transport process, which gives an indication of the status of the transport system and the degree to which reserves are being used.
BIBLIOGRAPHY
1.Barker SJ, Tremper KK, Hyatt J, Heitzmann H. Comparison of three oxygen monitors in detecting endobronchial intubation. J Clin Monitoring 1988;4:240–243.
2.Barker SJ, Tremper KK. The effect of carbon monoxide inha-
lation on pulse oximetry and transcutaneous PO2. Anesthesiology 1987;66:677–679.
3.Barker SJ, Tremper KK, Hyatt J. Effects of methemoglobinemia on pulse oximetry and mixed venous oximetry. Anesthesiology 1989;70:112–117.
4.Sidi A, et al. Effect of fluorescein, indocyanine green, and methylene blue on the measurement of oxygen saturation by pulse oximetry (abstract). Anesthesiology 1986;65(3A): A132.
5.Scheller MS, Unger RJ, Kelner MJ. Effects of intravenously administered dyes on pulse oximetry readings. Anesthesiology 1986;65:550–552.
6.Lawson D, et al. Blood flow limits and pulse oximeter signal detection. Anesthesiology 1987;67:599–603.
7.Narang VPS. Utility of the pulse oximeter during cardio-- pulmonary resuscitation. Anesthesiology 1986;65:239– 240.
8.Eisele JH, Downs D. Ambient light affects pulse oximeters. Anesthesiology 1987;67:864–865.
9.Barker SJ, Shah NK. The effects of motion on the performance of pulse oximeters in volunteers. Anesthesiology 1997;86:101– 108.
10.Barker SJ. Motion Resistant pulse oximetry. A comparison
of new and old models. Anesth Analg 2002;95:967– 972.
11.Bohnhorst B, Peter C, Poets CF. Pulse oximeters’ reliability in detecting hypoxia and bradycardia: Comparison between a conventional and two new generation oximeters. Crit Care Med 2000;28:1565–1568.
12.Kim JM, et al. Pulse oximetry and circulatory kinetics associated with pulse volume amplitude measured by photoelectric plethysmography. Anesth Analg 1986;65:133– 139.
13.Barker SJ, et al. The effect of sensor malpositioning on pulse oximeter accuracy during hypoxemia. Anesthesiology 1993;79: 248–254.
14.Rithalia SVS, Bennett PJ, Tinker J. The performance characteristics of an intraarterial oxygen electrode. Intensive Care Med 1981;7:305–307.
15.Lubbers DW, Opitz N. Die pCO2/pO2-optode: eine neue pCO2 bzw. pO2-Messonde zur Messung des pCO2 oder pO2