

Thermal Analysis of Polymeric Materials
.pdf2.5 Phases and Their Transitions |
177 |
__________________________________________________________________
Fig. 2.115
phases. Large empty spaces exist between the motifs. Its connection to the condensed phases is shown in Fig. 2.115 by boiling from the liquid phase (at Tb) or the direct transition from the solids by sublimation (at Ts).
The motions observed for a specific material are dependent on the molecular structure. Spherical atoms cannot exist as mesophases, except when included as a solvent (as in lyotropic liquid crystals). Only small, rigid molecules can exist as plastic crystals, while condis crystallinity is reserved for flexible molecules. Since all degrees of freedom are at low temperature vibrational with a limiting heat capacity of 3R per mole of atoms, and all large-amplitude motion decreases to R/2 per degree of freedom when losing the potential energy contribution, one would expect that the heat capacity decreases at every transition to higher-temperature phases that possess more large-amplitude motion. The experimental data are not in agreement with this prediction (see Sect. 2.3). The main reason for the often observed increase in heat capacity at glass and disordering transitions is the need of additional potential energy to create the increased volume for the large-amplitude motion.
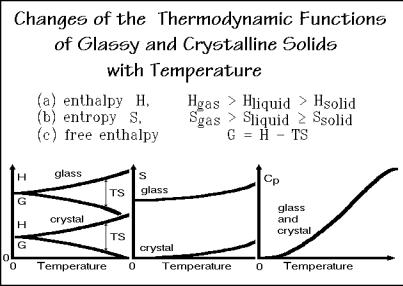
The macroscopic, thermodynamic description of states is achieved through their major functions and variables of state listed in Fig. 2.116. One can deduce from the microscopic picture of the states of matter that the enthalpy of the gas must be largest, and of the solid, smallest. The larger the packing density, the stronger are the interactions between the motifs decreasing the enthalpy. On transition to a new, higher-temperature phase, this interaction must be overcome by an endothermic heat of transition.
The magnitude of the entropy can also be estimated from the microscopic description. One expects the entropy of the gas to be largest because of the large disorder in this dilute state. The crystal, on the other hand, because of its order, should have the smallest entropy; in fact, the third law of thermodynamics sets the
178 2 Basics of Thermal Analysis
__________________________________________________________________
Fig. 2.116
entropy of an ideal, equilibrium crystal equal to zero at the absolute zero of temperature (Sect. 2.2.4). The free enthalpy, finally, can be derived from enthalpy and entropy as shown. Its significance lies in the fact that it tells which state is most stable at a given temperature as shown in Figs. 2.84–88.
The temperature dependencies of enthalpy, free enthalpy, entropy, and heat capacity of glasses and crystals are schematically indicated in the three drawings at the bottom of Fig. 2.116 (see also Fig. 2.23). Enthalpy, entropy, and heat capacity increase with temperature, while the free enthalpy decreases. The reasons for the trends of these functions with temperature can be derived from a detailed understanding of heat capacity (see Sects. 2.3). The link between heat capacity and enthalpy is obvious from its definition (Fig. 2.10). Entropy is similarly related to heat capacity in Fig. 2.19 (see also Fig. 2.22). The free enthalpy is then fixed by G = H TS.
2.5.6 Glass Transitions
The glass transition is a much more subtle transition than melting or evaporation. In Fig. 2.117 the change in heat capacity on going through the glass transition temperature is drawn after a typical polymer. There is a jump in the heat capacity, but there is no indication of a heat of transition. If there is no heat of transition, there can also be no entropy of transition.
The increase in heat capacity Cp always occurs over a temperature range of 5 to 20 K, and the jump is often 11 J K 1 mol 1 of mobile units in the liquid. This means, for a monatomic liquid the decrease in heat capacity at the glass transition is11 J K 1 mol 1. Macromolecules, such as polyethylene, (CH2 )x, change in heat capacity by approximately 11 J K 1 (mol of chain atom) 1 (see Appendix 1). To describe the glass transition, the temperature of half-vitrification, Tg, should be

2.5 Phases and Their Transitions |
179 |
__________________________________________________________________
Fig. 2.117
specified, i.e., the temperature at which the heat capacity is midway between that of the liquid and glassy states. This temperature usually corresponds closely to the point of inflection in the heat capacity, and also to the breaks in the enthalpy or volume versus temperature curves at the glass transition (see Sect. 6.3). To specify the range of the glass transition, the beginning of the transition, Tb, the end, Te, the extrapolated beginning, T1, and the extrapolated end, T2, should be given in addition to Tg, Cp, and the cooling rate, q, as is indicated in the figure. All seven parameters empirically characterize the glass transition. The transition temperature, Tg, alone is a poor characterization.
A study of large lists of glass transition temperatures reveals that the ratio of the melting temperature to the glass transition temperature is often (but not always) between 1.5 and 2.0. The glasses of small molecules, such as water and ethyl alcohol, fulfill this rule also. Their ratios are 1.91 and 1.64, respectively. The glass transition, thus, is reached at a much lower temperature than the melting transition, so that for materials applications, crystalline substances should be preferred. Again, exceptions are known. Poly(oxy-2,6-dimethyl-1,4-phenylene) (PPO™, General Electric) has a Tg of 482 K and a Tm of 580 K (ratio 1.20), sufficiently low that on partial crystallization, Tg increases due to strain caused by the small crystals, and Tm decreases because of the small size of the crystals, so that Tg may exceed Tm (see the rigid amorphous fraction of PPO in Sect. 6.2.2). Similar closeness of Tg and Tm is observed in long-side-chain polymethacrylates, where the glass transition is fixed by the backbone of the polymer and the melting transition by its side-chain length.
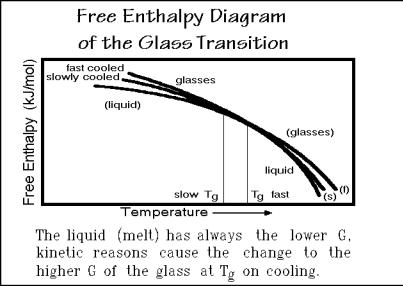
From the measurement of heat capacity one can derive the free enthalpy as drawn schematically in Fig. 2.118. Since the heat capacity of the liquid is always larger than the heat capacity of the glass (see 2.117), the free-enthalpy curve of the liquid must have the larger curvature since ( 2G/ T2)p = Cp/T (see Fig. 2.19) and when
180 2 Basics of Thermal Analysis
__________________________________________________________________
Fig. 2.118
extrapolated to below Tg, it lies lower than the glass free enthalpy. At the glass temperature, both free enthalpies are equal, i.e., the two curves touch. In addition, the slopes of the curves are identical because of their identical heat capacities (see Sect. 2.3).
The question that one must answer is then: How is it possible for such a glass transition actually to occur, since G of the liquid is less and becomes equal to G of the glass only at Tg? In order to stay in equilibrium, it should be forbidden to cross
from Gliquid to Gglass at Tg. This paradox can be resolved only by knowing that below Tg the liquid state does not exist. Microscopically, Tg is the temperature where the
liquid-like large-amplitude motion stops. The nature of the stopping precludes supercooling on cooling, and similarly, superheating on heating. Whenever the experimental time is too short for the molecules to readjust to the changes in temperature, one reaches the glass transition. This time-dependence is an indication that the transition does not occur under equilibrium conditions. Different cooling rates produce different glasses, and each glass will have a different free enthalpy.
In contrast to the well-defined equilibrium crystals, there exist a multitude of glasses of the same chemical structure, differing only in the cooling or annealing history. Also, an analogous extrapolation of the liquid and solid free enthalpies beyond the transition temperature, as possible for crystals is not permitted as implied by the parentheses in Fig. 2.118.
A detailed discussion of the dependence of the glass transition not only on cooling, but also on heating is given in Sect. 6.3. For the present, it suffices to suggest that a recorded glass transition corresponds only to a glass cooled at a given rate, i.e., with a fixed thermal history. For full specification of a glass transition, the cooling rate or other experimental parameters of the thermal history, and possibly also mechanical and electrical history must be specified.
2.5 Phases and Their Transitions |
181 |
__________________________________________________________________
2.5.7 First-order Transitions
First-order transitions are characterized by an enthalpy and entropy of transition. All transitions indicated on the right side of the list of classical phases and mesophases in Fig. 2.103 are usually assumed to be first-order transitions. In some cases, especially when involving mesophases or flexible polymers, these transitions are not as sharp as one would expect for first-order transition as discussed below. Common reasons that can broaden first-order transitions are impurities (additional components, see Chap. 7) and a distribution of phases with different perfections (see Chap. 6).
In the case where two phases are in contact and at equilibrium, the stability of both phases must be equal. This requires that the two free enthalpies per mole, G’, must be the same at the given temperature and pressure. In addition, any infinitesimal change dG’ of each phase must also be equal so that the equilibrium is stable as suggested in Fig. 2.79. These conditions of equilibrium between phases I and II are written at the top of Fig. 2.119. By equating expressions similar to those derived for the free enthalpy in Fig. 2.19, additional information for the phase transitions can be obtained. Since the changes dG are expressed per mole, there is no change in the number of moles, n, and each side of the equation has only two terms. This equation allows only one independent choice between the two variables T and p—i.e., if two phases are in contact and in equilibrium, there is only one degree of freedom for a one-component system. This statement is called the phase rule and can be written more general as: P + F = C + 2, where P is the number of phases, F is the degrees of freedom, C is the number of components, and 2 represents the two variables p and T. For a one-component system, no degrees of freedom or independently adjustable variables are possible for three phases in contact. The third phase would give rise to another equation between, let us say, phases II and III, of the same type as written for phases I and II. Two equations with two variables permit computation of both variables. There is thus no degree of freedom. In a p–T diagram this situation is represented by a point (a triple point) (see also Sects. 2.3.5 and 2.3.7 and Sect. 1.4.3).
The definition of components for linear macromolecules is somewhat complicated. One must distinguish between processes that occur with parts of molecules, i.e., strongly coupled components which must keep their positions within the molecule (as in copolymers, see Sect. 3.4), and processes with whole molecules, i.e., where there exist only weakly bound components that can easily segregate. More details about multi-component systems are given in Chap. 7.
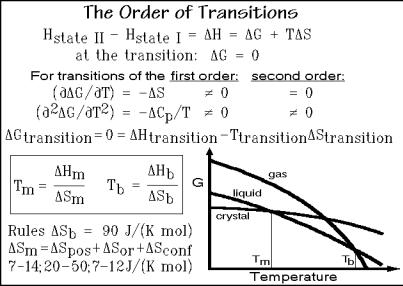
The most far-reaching transitions are melting and evaporation. They involve the loss of order in the case of melting, and the change from a condensed to a dilute state in the case of evaporation. All other transitions are of lesser magnitude. In Fig. 2.119 it is indicated how the enthalpy changes in going from state I to state II. To stay in equilibrium during a transition, the change in Gibbs energy, G, must be zero.
The derivatives of G with respect to temperature, on the other hand, do not have to be zero. This suggests a way to characterize the transitions thermodynamically. Ehrenfest suggested that a transition for which ( G/ T) (= S, see Fig. 2.19) is not equal to zero be called a first-order transition [25]. A second-order transition would analogously have the first derivative ( G/ T) equal to zero, but the second derivative ( 2 G/ T2) would not equal zero. The second derivative of G is equal
182 2 Basics of Thermal Analysis
__________________________________________________________________
Fig. 2.119
to Cp/T, as shown in Fig. 2.119. This condition is superficially fulfilled in a glass transition at a fixed time scale, but the time-dependence of Tg indicates that the transition should not be considered an equilibrium transition.
To discuss melting and evaporation, one can make use of the schematic drawing of the free enthalpy in Fig. 2.119, which applies to a one-component, pure substance. At low temperature the crystalline state is most stable. The crystals are stable up to the melting temperature, Tm. At this temperature, the crystal must change to the liquid, in order to remain stable. The change of state is connected with a change in the slope of G—i.e., the transition must be of first order. The system changes states with a discontinuity in entropy as well as enthalpy. Increasing the temperature further, the limit of stability of the liquid is reached at the boiling temperature Tb. Here again, on going from the liquid to the gas there is a change in the slope of G, so that it is also a first-order transition with an entropy and enthalpy of evaporation.
To describe the thermodynamic equilibrium behavior at the transition, one can write the boxed equations in Fig. 2.119. Inspection of these equations shows that thermometry, discussed in Sect. 4.1, can give a characterization of a material if there is information on either the heats or entropies of transition. Some help for interpretation comes from the fact that related materials have similar changes in disorder—the entropies of transition are similar for structurally related materials.
Richards’s rule, for example, which applies to solids that melt by producing spherical, mobile motifs, such as noble gases and metals, says that the entropy of melting, Sm, is somewhere between 7 and 14 J K 1 mol 1. A similar empirical rule exists for the boiling point, known as Trouton’s rule. Normal boiling materials have an entropy of boiling, Sb, of approximately 90 J K 1 mol 1. A more detailed empirical rule for the entropy of melting is listed at the bottom of Fig. 2.119 (see also Fig. 2.103). Three types of disorder make up the change on fusion: positional (pos),
2.5 Phases and Their Transitions |
183 |
__________________________________________________________________
orientational (or), and conformational (conf). The approximate contributions to S are listed in brackets. The first term represents Richards’s rule. It is the only contribution for spherical motifs. Irregular motifs can, in addition, show orientational disorder, and thus gain an extra 20 50 J K 1 mol 1 on fusion. Flexible molecules have a third contribution to the entropy of fusion of 7 12 J K 1 mol 1 for each flexible bead within the molecule (for details see Sects. 5.4 and 5.5).
The boiling transition is simpler to describe since the vapor is close to an ideal gas without interactions between the molecules. The heat of evaporation is also called the cohesive energy, a quantity that can be related to many properties of liquids as well as solids. The cohesive energy density, CED, given in kJ per mole of molecules or repeating units, is often used to characterize the energetics of crystals.
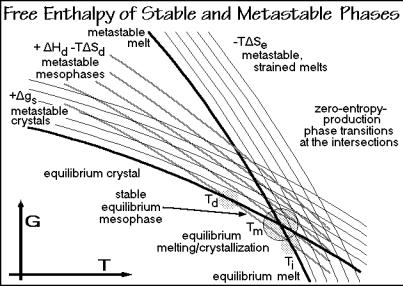
Gradual or multiple equilibrium transitions need a sequence of states with differences in interaction and disorder such that H/ S is lower than Tm. For spherical motifs it takes, however, a relatively larger amount of energy than entropy to introduce a phase with partial disorder, i.e., H/ S is usually larger than Tm. But note, that a small amount of equilibrium disorder may be introduced as isolated defects (see Sect. 5.3). For other shapes of motifs or types of large-amplitude motion, the changes of H and S may be such as to permit gradual transitions or multiple phases. For example, the internal rotation of a CH3 group in polypropylene starts gradually, producing little disorder and no recognizable transition. The mesophase transitions in Fig. 2.103, in turn, are linked to special mesogens or low-energy, largeamplitude motion that produces a relatively big disorder. Under such conditions the free enthalpy curve has a relatively lower level of G and a larger slope ( G/ T = S) in the G-vs.-T diagram. Figure 5.120 is a summary G vs. T diagram comparing the metastable states (see Sect. 2.4) along with mesophases (see Sect. 2.5.3) and also strained melts (see Sect. 5.6).
Fig. 2.120
184 2 Basics of Thermal Analysis
__________________________________________________________________
References
General References
Sect. 2.1. For an extensive discussion of temperature and heat and its history see, for example, the entries “Heat” and “Thermometry” in the “Encyclopædia Britannica.” Particularly extensive are the articles in the earlier editions, starting with the famous eleventh edn of 1910. (Encyclopædia Britannica Inc, Chicago).
Some of the early experiments can be found in: Thompson B, Count Rumford (1789) Phil Trans 88: 80; Davy J (1839–40) The Collected Works of Sir Humphry Davy. London; see also Joule JP, Thomson W (1854) Phil Trans Roy Soc, London 144: 355. For the work of Gay-Lussac see Schimank H (1951) Naturwissenschaften 38: 265.
The basic thermodynamics can be reviewed on hand of any of the standard texts of physical chemistry, such as Atkins PW (1998) Physical Chemistry, 6th ed, Oxford University Press, Oxford.
Sect. 2.2. Advanced texts and reference books on thermodynamics are, for example: Eyring H, Henderson D, Jost W (1971–75) Physical Chemistry, an Advanced Treatise. Academic Press, New York, Vols I IX; Partington JR (1949–54) An Advanced Treatise on Physical Chemistry. Longmans, London, Vols I V.
The handling of heat and work as two forms of energy in the thermodynamic description of a system has been recognized as one of the difficulties in understanding thermal analysis. It has been suggested to eliminate work as a separate energy by Barrow GM (1988) Thermodynamics Should be Built on Energy—not on Heat and Work. J Chem Ed 65: 122–125.
Specific books on the second law are those of Bent HA (1965) The Second Law, An Introduction to Classical and Statistical Thermodynamics. Oxford University Press, New York; or Atkins PW (1984) The Second Law. Freeman, San Francisco.
For an advanced treatment of heat capacity see: Blackman M (1955) The Specific Heat of Solids. In Flügge S, ed, Encyclopedia of Physics, Vol VII, Part 1. Springer, Berlin.
Sect. 2.3.Extensive data-tables on heat capacities are found in:
a.Hellwege KH, ed (1956–71) in Landolt–Boernstein , Zahlenwerte und Funktionen. Springer, Berlin, 6th ed, Vol II, Parts 1 5; continued as New Series, Group IV, Macroscopic and Technical Properties of Matter.
b.Touloukian YS, Ho CY, eds (1970–79) Thermophysical Properties of Matter, The TPRC Data Series. IFI/Plenum, New York, Vols 4 6, Specific Heat.
c.Lide DR , ed (2002/3) Handbook of Chemistry and Physics, 83rd ed. CRC Press, Boca Raton, FL (annual new editions).
d.Pyda M, Wunderlich B (1999) Heat Capacities of High Polymers, in Immergut EH,
Grulke EA, eds. Polymer Handbook. Wiley, 4th, revised edn pp VI/483–520. Tables of the one, two, and three-dimensional Debye functions are available, respectively:
a.Wunderlich, B (1962) J Chem Phys 37: 1207.
bGaur U, Pultz G, Wiedemeier H, Wunderlich B (1981) J Thermal Anal 21: 309.
c.Beatty JA (1926/27) J Math Phys (MIT) 6: 1.
References for Chap. 2 |
185 |
__________________________________________________________________
Tables of the Einstein function can be found, for example, in Sherman J, Ewell RB (1942) J Phys Chem 46: 641.
Closed-form approximations to the Debye functions have been published by Pan R, Varma-Nair M, Wunderlich B (1990) J Thermal Anal 36: 145.
More detailed descriptions of heat capacities of polymers can be found in: Wunderlich B, Baur H (1970) Adv Polymer Sci 7: 151 368; Perepechko I I (1980) Low Temperature Properties of Polymers. Pergamon Press, Oxford.
For ATHAS descriptions and data see the website: web.utk.edu/~athas. For Journal articles see: Wunderlich B (1995) Pure Applied Chem 67: 1019–1026; Wunderlich B (1997) Thermochim Acta 300: 43–65. A detailed discussion of the match between heat capacities and the low-frequency vibrational spectrum is given by: Bu H-S, Cheng SZD, Wunderlich B, (1987) J Phys Chem 91: 4179–4188.
Details for the ATHAS calculations are given in: Pyda M, Bartkowiak M, Wunderlich B (1998) Computation of Heat Capacities of Solids Using a General Tarasov Equation. J. Thermal Anal Calorimetry 52: 631–656. Zhang G, Wunderlich B (1996) A New Method to Fit Approximate Vibrational Spectra to the Heat Capacity of Solids with Tarasov Functions. J Thermal Anal 47: 899–911. Noid DW, Varma-Nair M, Wunderlich B, Darsey JA (1991) Neural Network Inversion of the Tarasov Function Used for the Computation of Polymer Heat Capacities. J Thermal Anal 37: 2295–2300. Pan R, Varma-Nair M, Wunderlich B (1990) A Computation Scheme to Evaluate Debye and Tarasov Equations for Heat Capacity Computation without Numerical Integration. J Thermal Anal 36: 145–169. Lau S-F, Wunderlich B (1983) Calculation of the Heat Capacity of Linear Macromolecules from-Temperatures and Group Vibrations. J Thermal Anal 28: 59–85. Cheban YuV, Lau SF, Wunderlich B (1982) Analysis of the Contribution of Skeletal Vibrations to the Heat Capacity of Linear Macromolecules. Colloid Polymer Sci 260: 9–19.
The original papers on the development of the Tarasov functions are: Tarasov VV (1950) Zh Fiz Khim 24:111; (1953) ibid 27: 1439; (1965) ibid 39: 2077; (1955) Dokl. Akad. Nauk SSR 100: 307.
For a description of the theory of heat capacities of liquid macromolecules, see: Loufakis K, Wunderlich B (1988) J Phys Chem 92: 4205–4209; and Pyda M, Wunderlich B (1999) Macromolecules 32: 2044–2050.
The development of the thermodynamic data on polyethylene and polyoxide crystals and melts is documented in the following publications: Wunderlich B, Dole M (1957) J Polymer Sci 24: 201; Wunderlich B (1962) J Chem Phys 37: 1203, 1207, 2429; Grebowicz J, Suzuki H, Wunderlich B (1985) Polymer 26: 561; Suzuki H, Wunderlich B (1985) J Polymer Sci, Polymer Phys Ed 23: 1671.
Sect. 2.4. More detailed descriptions of irreversible thermodynamics can be found in: Prigogine I (1961) Introduction to Thermodynamics of Irreversible Processes. Interscience, New York; Guggenheim EA (1959) Thermodynamics. North-Holland Publ Co., Amsterdam; DeGroot SR, Mazur P (1962) Nonequilibrium Thermodynamics. North Holland Publ., Amsterdam; DeGroot SR (1963) Thermodynamics of Irreversible Processes. North Holland Publ, Amsterdam; Yourgrau W, van der Merve A, Raw G (1982) Treatise on Irreversible and Statistical Thermophysics. Dover, New York, corrected reprint of the 1966 edition by Macmillan Co., New York; Baur H (1984) Einführung in die Thermodynamik der irreversiblen Prozesse. Wissenschaftliche Buchgesellschaft, Darmstadt; Gyarmati I (1970) Nonequilibrium Thermodynamics. Springer, Berlin, 1970.
For a discussion of the melting of polymer lamellae see: Wunderlich B (1980) Macromolecular Physics. Vol 3, Crystal Melting. Academic Press, New York.
For a discussion of the use of irreversible thermodynamics for the description of the glass transition, see: Baur H, Wunderlich B (1998) J Thermal Anal Calorimetry 54: 437.
186 2 Basics of Thermal Analysis
__________________________________________________________________
Sect. 2.5. General discussions of the classical phases and their transitions can be found in your favorite physics, chemistry, or physical chemistry text. Liquid crystals are treated by: DeGennes PG (1974) The Physics of Liquid Crystals. Clarendon Press, Oxford; Brown GH (1975) Advances in Liquid Crystals. Academic Press, New York; Gray GW (1962) Molecular Structure and the Properties of Liquid Crystals. Academic Press, New York. Plastic crystals by: Sherwood N, ed. (1979) The Plastically Crystalline State (Orientationally-disordered Crystals). Wiley, Chichester. For the condis state see: Wunderlich B, Möller M, Grebowicz J, Baur H (1988) Conformational Motion and Disorder in Low and High Molecular Mass Crystals. Springer Verlag, Berlin (Adv Polymer Sci Vol 87).
The term mesomorphic order was first proposed by: Friedel MG (1922) Les Etats Mésomorphes de la Matetiére. Ann Phys (Paris) 18: 273. The discovery of liquid crystals occurred by Reinitzer F (1888) Beiträge zur Kenntnis des Cholesterins Monatshefte 9: 421. The naming goes back to: Lehmann O (1904) Flüssige Kristalle. Engelmann, Leipzig; see also Kelker H (1973) History of Liquid Crystals. Mol Cryst Liq Cryst 21: 1. The name conformationally disordered crystals was first suggested by: Smith GW (1975) Plastic Crystals, Liquid Crystals and the Melting Phenomenon. The Importance of Order. In Brown GH, ed. Advances in Liquid Crystals, Vol 1. Academic Press, New York. The first detailed comparison of all three mesophase types and the general diagram of Fig. 2.103 was given by: Wunderlich B, Grebowicz J (1984) Thermotropic Mesophases and Mesophase Transitions of Linear, Flexible Macromolecules. Adv Polymer Sci 60 61: 1.
Transitions are treated in the general physical chemistry references of Sect. 2.3. See also: Ubbelohde AR (1965 and 1978) Melting and Crystal Structure. Oxford University Press, London, and The Molten State of Matter, Melting and Crystal Structure. Wiley, New York; Boyer RF (1977) Transitions and Relaxations, in Enc Polymer Sci and Technol Suppl 2. Wiley, New York; an update was given in the second edition of the encyclopedia by Bendler JT (1989) under the same title, Vol 7, p 1.
For the rules of entropies of transition see: Richards JW (1897) Chem News: 75: 278; Trouton F (1884) Philos Mag 18: 54—Because of the great similarity of all gases, Trouton’s rule is more general than Richards’s rule. The tendency of Trouton’s constant to be higher for higher boiling substances is largely eliminated if one determines the constant for a fixed vapor concentration, as discussed by Hildebrand JH (1915) J Am Chem Soc 37: 970 (113 J K 1 mol 1 at concentrations of 0.005 mol L 1). For an early description and classification of conformational defects in crystals, see Wunderlich B (1980) Macromolecular Physics, Vol 3, Crystal Melting. Academic Press, New York.
For a recent discussion of the assignment of the glass transition, see Syler RJ, ed (1994) On the Assignment of Glass Transition Temperatures Using Thermomechanical Analysis. ASTM Symposium, Atlanta, March 4–5, 1993, ASTM STP 1249, Am Soc Testing of Materials, Philadelphia. For the rules of Cp see: Wunderlich B (1960) J Phys Chem 64: 1052. For larger lists of macromolecular glasses see Athas Data Bank in Appendix 1, where also an approximation of the mobile sections (beads) of the repeating units are given in column 3. For large numbers of glass transition temperatures see: Lee WA, Rutherford RA (1999) in Brandrup J, Immergut EH, Grulke EA, eds, Polymer Handbook. 4th edn Wiley, New York.
Specific References
1.Mills I, Cvitaš Y, Homann K, Kallay N, Kuchitsu K, eds (1993) Quantities, Units and Symbols in Physical Chemistry. Blackwell Science, Oxford.
2.The discussion of the “Future Thermal Analysis” is largely based on the article Kreitmeier SN, Liang, GL, Noid DW, Sumpter BG (1996) Thermal Analysis via Molecular Dynamics Simulation. J Thermal Anal 46: 853–869.