

74
PAX 2 loss was recorded in 86% of patients diagnosed with EIN (31 women) (Table 6) [121].
Table 6 – Comparative characteristics of the expression of the main markers in endometrial hyperplastic processes and endometrioid adenocarcinoma [121]
|
|
Benign endometrial |
EIN |
Endometrial |
||
ICH parameter |
Indicator |
hyperplasia |
cancer |
|||
36 |
||||||
|
|
35 |
|
36 |
||
|
|
|
|
|||
|
|
|
|
|
|
|
|
Average value |
13 |
18 |
|
39 |
|
|
|
|
|
|
|
|
Ki-67, % |
Standard deviation |
9 |
13 |
|
23 |
|
|
|
|
|
|
||
Quartile 25 |
5 |
10 |
|
19 |
||
|
|
|||||
|
|
|
|
|
|
|
|
Quartile 75 |
20 |
25 |
|
53 |
|
|
|
|
|
|
|
|
|
Average value |
95 |
93 |
|
75 |
|
|
|
|
|
|
|
|
Estrogen receptors, % |
Standard deviation |
9 |
7 |
|
30 |
|
|
|
|
|
|
||
Quartile 25 |
95 |
90 |
|
65 |
||
|
|
|||||
|
|
|
|
|
|
|
|
Quartile 75 |
100 |
98 |
|
97 |
|
|
|
|
|
|
|
|
|
Average value |
89 |
73 |
|
54 |
|
Progesteron receptors, |
|
|
|
|
|
|
Standard deviation |
24 |
25 |
|
31 |
||
% |
|
|
|
|
|
|
Quartile 25 |
95 |
60 |
|
30 |
||
|
|
|
|
|
|
|
|
Quartile 75 |
98 |
94 |
|
73 |
|
|
|
|
|
|
|
|
|
Average value |
2 |
10 |
|
13 |
|
Nuclear expression of |
|
|
|
|
|
|
Standard deviation |
7 |
22 |
|
25 |
||
beta-catenin , % |
|
|
|
|
|
|
Quartile 25 |
0 |
0 |
|
0 |
||
|
|
|
|
|
|
|
|
Quartile 75 |
0 |
8 |
|
13 |
|
|
|
|
|
|
|
|
ARID1a |
Presence |
35 |
36 |
24 |
(67%) |
|
|
|
|
|
|
||
Loss |
0 |
0 |
12 |
(33%) |
||
|
||||||
|
|
|
|
|
|
|
PTEN |
Presence |
34 (97%) |
12 (33%) |
12 |
(33%) |
|
|
|
|
|
|
||
Loss |
1 (3%) |
24(67%) |
24 |
(67%) |
||
|
||||||
|
|
|
|
|
|
|
MSH6 |
Presence |
35 |
36 |
35 |
(97%) |
|
|
|
|
|
|
||
Loss |
0 |
0 |
1 |
(3%) |
||
|
||||||
|
|
|
|
|
|
|
MSH2 |
Presence |
35 |
36 |
35 |
(97%) |
|
|
|
|
|
|
||
Loss |
0 |
0 |
1 |
(3%) |
||
|
||||||
|
|
|
|
|
|
|
75
Table 6 continued
|
|
Benign endometrial |
|
EIN |
Endometrial |
|
ICH parameter |
Indicator |
hyperplasia |
|
cancer |
||
|
36 |
|||||
|
|
35 |
|
36 |
||
|
|
|
|
|||
|
|
|
|
|
|
|
PMS2 |
Presence |
35 |
35 |
(97%) |
24 (67%) |
|
|
|
|
|
|
||
Loss |
0 |
1 |
(3%) |
12 (33%) |
||
|
||||||
|
|
|
|
|
|
|
MLH1 |
Presence |
35 |
35 |
(97%) |
24 (67%) |
|
|
|
|
|
|
||
Loss |
0 |
1 |
(3%) |
12 (33%) |
||
|
||||||
|
|
|
|
|
|
|
MSI |
Presence |
35 |
35 |
(97%) |
23 (64%) |
|
|
|
|
|
|
||
Loss |
0 |
1 |
(3%) |
13 (36%) |
||
|
||||||
|
|
|
|
|
||
PAX2 |
Presence |
33 (94%) |
4 (11%) |
5 (14%) |
||
|
|
|
|
|
||
Loss |
2 (6%) |
32 |
(89%) |
31 (86%) |
||
|
||||||
|
|
|
|
|
|
|
Comparative characteristics of groups by IHC parameters
The comparison of the studied groups on the expression of IHC markers was carried out. The results are presented in Table 6.
If there are significant differences between the groups (p<0.05) according to the test results (ChiSq or Fisher), the odds ratio (OR), relative risk (RR) sensitivity and specificity were calculated (Table 7).
Table 7 – Diagnostic accuracy of IHC markers for differentiation of benign, precancerous and oncological diseases of the endometrium) [121]
ICH parameter |
Characteristic |
EIN and EC |
EH and EC |
EN and EIN |
|
|
|
|
|
|
RR |
2,308 |
2,269 |
– |
ARID1a |
|
|
|
|
Sensitivity |
33% |
33% |
– |
|
|
|
|
|
|
|
Specificity |
97% |
100% |
– |
|
|
|
|
|
|
RR |
|
3,7 |
3,7 |
PTEN |
|
No differences |
|
|
Sensitivity |
67% |
67% |
||
|
|
|
|
|
|
Specificity |
|
97% |
97% |
|
|
|
|
|
MSH6 |
|
There are no differences |
|
|
|
|
|
||
MSH2 |
|
|
||
|
|
|
|
|
|
|
|
|
|
Рекомендовано к изучению сайтом МедУнивер - https://meduniver.com/

76
Table 7 continued
ICH parameter |
Characteristic |
EIN and EC |
EH and EC |
EN and EIN |
|
|
|
|
|
|
RR |
2,269 |
2,269 |
|
PMS2 |
|
|
|
No differences |
Sensitivity |
33% |
33% |
||
|
|
|
|
|
|
Specificity |
97% |
100% |
|
|
|
|
|
|
|
RR |
2,269 |
2,269 |
|
MLH1 |
|
|
|
No differences |
Sensitivity |
33% |
33% |
||
|
|
|
|
|
|
Specificity |
97% |
100% |
|
|
|
|
|
|
|
RR |
2,342 |
2,342 |
|
MSI |
|
|
|
No differences |
Sensitivity |
36% |
36% |
||
|
|
|
|
|
|
Specificity |
97% |
100% |
|
|
|
|
|
|
|
RR |
|
7,139 |
8,706 |
PAX2 |
|
No differences |
|
|
Sensitivity |
86% |
89% |
||
|
|
|
|
|
|
Specificity |
|
94% |
94% |
|
|
|
|
|
Note – RR – relative risk; EH – endometrial hyperplasia without atypia; EIN – endometrioid intraepithelial neoplasia; EC – endometrioid adenocarcinoma of the endometrium.
Expression of the ARID1a gene
There were no significant differences between the groups of EH without atypia and EIN. Loss of expression of the ARID1a gene was not observed either in cases of EH without atypia (Figure 13) or in cases of EIN (Figure 14).
Figure 13 – ARID1a positive staining in the preparation of endometrial hyperplasia without atypia, 200

77
Figure 14 – ARID1a positive staining in the preparation of endometrioid intraepithelial neoplasia, 200
Significant differences were revealed between the groups of EIN and EC, EH without atypia and EC on the basis of loss of expression of ARID1a (assessed as the absence of staining in the IHC analysis).
Loss of ARID1a expression is most characteristic of EС, occurring in 67% of all studied cases of EС (Figure 15).
1 – negative staining (67% of cases); |
2 – positive staining (33% of cases). |
Figure 15 – ARID1a staining in tumor cells in the preparation endometriodic endometrial adenocarcinoma 200
According to the obtained data, when ARID1a falls out, EС is diagnosed 2.3 times more often than EIN and EH. In the differential diagnosis of EC from EIN
Рекомендовано к изучению сайтом МедУнивер - https://meduniver.com/

78
and EC from EH, this marker will have the same sensitivity – 33%, and specificity – 97% and 100%, respectively (Table 7).
Expression of the PTEN gene
Loss of PTEN expression was registered only in one case of endometrial hyperplasia without atypia, all other samples were with preserved expression (Figure 16).
PTEN positive staining, 200; |
PTEN negative staining, 200 |
|
(1 case – 3%). |
Figure 16 – Expression of the PTEN gene
in the preparation of endometrial hyperplasia without atypia
There were no significant differences in PTEN loss in the EIN and EC groups. Differences were revealed in the groups: EH and EIN, EH and EC.
Loss of PTEN is equally common in the EIN and EС groups in 67% (Figure 17).
In cases of PTEN loss precancerous and endometrial cancer are observed 3.7 times more often than EH.

79
PTEN negative staining in the preparation of endometrial adenocarcinoma with foci of EIN, ×200;
PTEN positive staining in the EIN preparation, |
PTEN positive staining in the preparation |
200; |
of endometrial adenocarcinoma, 200. |
Figure 17 – Expression of the PTEN gene
in preparations of endometrioid intraepithelial neoplasia and endometrioid endometrial cancer
In the differential diagnosis of EIN and EC from EH, the sensitivity of this marker is 67%, and the specificity is 97% (Table 7) [171].
Assessment of microsatellite instability status
(expression of 4 genes: MSH6 and MSH2, PMS2 and MLH1)
There were no significant differences in the paired MSH6 and MSH2 genes in the groups. The absence of staining was observed only in one case of EC.
For the PMS2 and MLH1 genes, significant differences were found in the EIN and EC, EH and EC groups. There were no differences in the EH and EIN groups.
The relative risk of detecting EC in the presence of PMS2 and MLH1 loss is 2.3 times higher than the detection of EH and EIN.
Рекомендовано к изучению сайтом МедУнивер - https://meduniver.com/

80
In the differential diagnosis of EC and EIN, EC and EH the sensitivity of these markers is 33%, and the specificity is 97% and 100%, respectively (Table 7).
MSI is more common in EC (36% of cases) (Figure 18), practically does not occur in EIN (1 case) (Figure 19), does not occur in EH (Figure 20). When detecting MSI, the relative risk of detecting EC will be 2.3 times higher than the detection of EIN and EH.
MLH1 negative staining, ×200 |
MSH6 positive coloring, ×200 |
(MSI – 36% of cases); |
(without dMMR – 64% of cases). |
Figure 18 – Microsatellite status in endometrial adenocarcinoma preparations
MLH1 negative staining, ×200 |
MSH6 positive coloring, ×200 |
(MSI – 3% of cases); |
(without dMMR – 97% of cases). |
Figure 19 – Status of microsatellite instability
in endometrioid intraepithelial neoplasia preparations
81
Figure 20 – MLH 1 positive staining
in the preparation of benign endometrial hyperplasia (without dMMR), ×200
The sensitivity of the MSI determination method in the differential diagnosis of EC from EH and EIN was 36%, and the specificity was 100% and 97%, respectively (Table 7).
Expression of the PAX2 gene
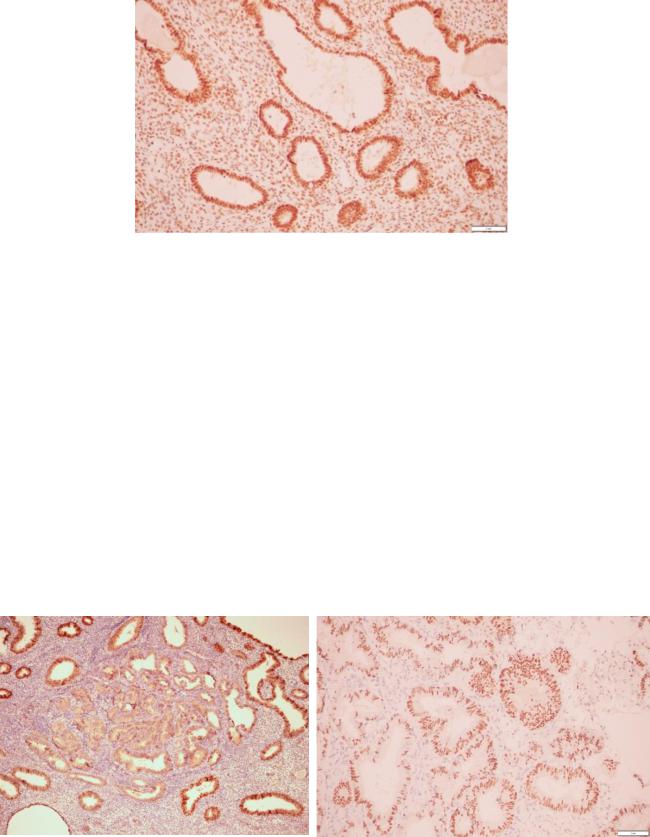
Most often, the loss of PAX2 expression (absence of staining during the IHC reaction) is observed in the EIN groups (in 89% of cases) (Figure 21) and EC (in 86% of cases) (Figure 22), practically does not occur in the EH group (detected only in 2 patients – 6%) (Figure 23).
PAX 2 negative staining in the focus of EIN in |
PAX 2 positive staining, 200. |
the endometrial polyp, 200; |
|
Figure 21 – Immunohistochemical study of Pax2 in endometrioid intraepithelial neoplasia preparations
Рекомендовано к изучению сайтом МедУнивер - https://meduniver.com/

82
PAX 2 negative staining, 200; |
PAX 2 positive staining, ×200. |
Figure 22 – Immunohistochemical study of Pax2
in preparations of endometrioid adenocarcinoma of the endometrium
PAX 2 positive staining, ×200 (94% of cases); |
PAX 2 negative staining 200 (6% cases). |
Figure 23 – Immunohistochemical study of Pax2 in preparations of benign endometrial hyperplasia
The relative risk of detecting EIN with PAX2 loss is 8.7, and with EC – 7.1 compared to EH.
The sensitivity of this marker in the differential diagnosis of EIN from EH was 89%, and the specificity was 94%. The differential diagnosis of EC from EH revealed sensitivity of 86%, and specificity of 94% (Table 7) [171].

83
Expression of Ki-67
The Ki-67 proliferation index significantly differed in the three study groups, with the lowest value in the EH group and the highest in the EC group (p=0.004) (Table 7, Figure 24).
Benign |
Endometrioid intraepithelial neoplasia |
endometrial hyperplasia |
|
Ki-67 – 5% (few colored nuclei), 200; Ki-67 – 20%, 200;
Endometrioid adenocarcinoma of the endometrium
Ki 67 – 65% (many colored nuclei), 200.
Figure 24 – Examples of IHC staining Ki-67
A pairwise comparison of the data revealed differences in the Ki 67 index in the EH groups without atypia and EC and the EIN and EC groups, with a higher proliferation index value in the EC group than in the EH group without atypia and EIN.
A tendency to increase the Ki 67 index with an increase in the degree of cellular atypia was revealed: the lowest values were in women with EH and
Рекомендовано к изучению сайтом МедУнивер - https://meduniver.com/