

- •Welcome to Seagate Crystal Reports
- •Welcome
- •Two kinds of Hands-On tutorials
- •Command, button, key, and control conventions
- •Using Seagate Crystal Reports documentation
- •Seagate Crystal Reports online Help features
- •If you need more help...
- •Installation Requirements
- •Installing Seagate Crystal Reports
- •Installing on a network workstation
- •Upgrading from a previous version
- •Quick Start
- •Subreports expand report usefulness
- •Query Designer adds ad-hoc querying capabilities
- •Parameter fields mean multi-purpose reports
- •Text objects give you text with intelligence
- •Preprinted-form reports easier than ever
- •More powerful formulas extend your capabilities
- •Web solution serves up variety of online reports
- •HTML exporting simplifies Web activities
- •New database support improves data access
- •Running totals made easy
- •Smart Navigation
- •Learning Seagate Crystal Reports
- •User’s Guide
- •Online Help
- •Books Online
- •Sample Reports
- •Glossary
- •Sample Data - CRAZE.MDB
- •Suggested learning paths
- •The application window
- •Menu bar
- •Standard toolbar
- •Supplementary toolbar
- •Format bar
- •Status bar
- •Shortcut menus
- •Cursors
- •Design Tab
- •Preview Tab
- •Other fundamentals
- •HANDS-ON (Report Design Environment)
- •How to add, delete, and move guidelines
- •How to move and position objects using guidelines
- •How to turn the grid on/off
- •How to zoom your report in and out
- •How to undo/redo activities
- •How to drill down on summarized data
- •HANDS-ON (Sections and Areas)
- •How to add, delete, move, and merge sections
- •How to split and resize sections
- •Basic report design
- •How to design a prototype
- •Concepts in reporting
- •Beyond basic reports
- •HANDS-ON (Report Creation and Design)
- •How to select data and begin creating a report
- •How to add and link multiple tables
- •How to insert database fields
- •How to insert special fields
- •How to insert a page n of N field
- •How to insert text objects
- •How to use a database field in a text object
- •How to insert a picture
- •How to select, move, and resize objects
- •How to hide parts of the report
- •HANDS-ON (Finishing Your Report)
- •How to insert page headers and footers
- •How to add a title page to your report
- •How to add summary information to your report
- •Printing considerations
- •Design solutions for printing/distributing
- •Report creation checklist for distributed reports
- •Updating printer drivers
- •Report distribution
- •HANDS-ON (Distributing Your Report)
- •How to export reports
- •How to fax a report
- •How to request reports from a web browser
- •How to specify parameter field values
- •How to log on to a database
- •How to view plain HTML reports
- •Overview
- •Getting started
- •Record Selection
- •Grouping and sorting
- •Completing the report
- •Introduction
- •Working with Arbor Essbase data
- •HANDS-ON (Reporting on OLAP data)
- •How to create a cross-tab with Essbase data
- •Using multiple sections in reports
- •HANDS-ON (Multiple Section Reports)
- •How to work with text objects
- •How to create a form letter using a text object
- •How to format objects conditionally
- •How to print conditional messages in form letters
- •How to alternate background colors for rows
- •How to eliminate blank lines
- •How to add blank lines conditionally
- •Formatting concepts
- •Absolute formatting
- •Types of formatting properties
- •Conditional formatting
- •HANDS-ON (Absolute Formatting)
- •How to add color, shading, and borders
- •How to add/edit lines and boxes
- •How to change margins
- •How to add/delete white space between rows
- •How to set page orientation and paper size
- •HANDS-ON (Conditional Formatting)
- •How to flag values that meet certain conditions
- •Record selection
- •Group selection
- •Record selection formula templates
- •HANDS-ON (Record and Group Selection)
- •How to create a record or group selection formula
- •How to use record/group selection templates
- •How to select the top or bottom N groups
- •Sorting, Grouping, and Totalling Overview
- •Creating custom groups
- •HANDS-ON (Sorting, Grouping, and Totalling)
- •How to do a single field sort
- •How to do a multiple field sort
- •How to group data
- •How to sort records within groups
- •How to summarize grouped data
- •How to subtotal grouped data
- •How to sort based on summarized group values
- •How to create multiple levels of subtotals
- •How to group data in intervals
- •How to calculate a percentage of the grand total
- •How to create group headers
- •What are formulas?
- •Other formula conventions
- •Formula syntax
- •How formulas are evaluated - Order of precedence
- •HANDS-ON (Formulas 101)
- •How to insert a formula in your report
- •How to delete formulas from your report
- •How to copy formulas from online Help
- •How to copy formulas from one report to another
- •How to create if-then-else formulas
- •How to format text with formulas
- •How to use variables in formulas
- •How to declare a variable
- •How to assign a value to a variable
- •How to conditionally assign values to variables
- •How to use an array in a formula
- •How to use a range in a formula
- •How to use semicolons in formulas
- •How to fine tune group selection formulas
- •How to fine tune record selection formulas
- •How to debug a formula
- •Introduction
- •HANDS-ON (Advanced Totalling)
- •How to maintain running totals in a list
- •How to subtotal running totals within groups
- •How to subtotal without grouping
- •How to subtotal true A to B, A to C reports
- •Parameter field objects overview
- •Multiple parameter fields
- •Parameter field considerations
- •HANDS-ON (Parameter Field Objects)
- •How to create a parameter field
- •How to use a parameter field in a formula
- •How to respond to parameter field prompts
- •How to use wildcards with parameter fields
- •How to set a report title using parameter fields
- •How to set sort order using parameter fields
- •Graphing Overview
- •Choosing a graph or chart type
- •Where to place your graph
- •Data you can graph on
- •Before you create your graph
- •HANDS-ON (Graphing)
- •How to graph on a summary or subtotal field
- •How to graph on a details field
- •How to graph on a formula field
- •How to graph on cross-tab summaries
- •How to edit graphs using PGEditor
- •How to use the underlay feature with graphs
- •OLE Objects Overview
- •Inserting OLE objects in your reports
- •Linked vs. Embedded Objects
- •The dynamic OLE menu commands
- •OLE and the Picture command
- •General OLE considerations
- •HANDS-ON (OLE Objects)
- •How OLE objects are represented in your report
- •How to use OLE - General Overview Tutorial
- •How to insert a graphic/picture as an OLE object
- •What are subreports?
- •Unlinked vs. linked subreports
- •How subreport linking works
- •HANDS-ON (Subreports)
- •How to insert a subreport
- •How to preview your subreport
- •How to combine unrelated reports using subreports
- •How to use subreports with unlinkable data
- •Cross-tab overview
- •Cross-tab components
- •HANDS-ON (Cross-Tab Objects)
- •How to create a cross-tab object
- •How to format a cross-tab
- •How to print cross-tabs that span multiple pages
- •The Crystal Query Designer
- •HANDS-ON (Queries)
- •How to create a new query
- •How to add tables to a query
- •How to link tables and specify a join type
- •How to add fields to a query
- •How to identify unique values in a query
- •How to summarize data with aggregate functions
- •How to sort records according to field values
- •How to specify records to be included in a query
- •How to select groups to be included in a query
- •How to create an SQL expression
- •How to create a query from another Crystal Query
- •How to select a query for a report
- •How to use a parameter field in a query
- •Dictionaries Overview
- •HANDS-ON (Dictionaries)
- •How to create a new dictionary
- •How to add a data file
- •How to open an SQL or ODBC data source
- •How to link multiple tables
- •How to select tables and fields for users
- •How to add/create formulas
- •How to move fields/field headings within the list
- •How to update the location of a database table
- •How to add a new field heading
- •How to add Help text
- •How to add a graphic
- •How to create sample data for users to browse
- •How to edit an existing dictionary
- •How to convert a 3.x or 4.x dictionary file
- •How to select a dictionary for a report
- •Databases Overview
- •For additional information
- •HANDS-ON (Working With Databases)
- •How to open Access queries through DAO
- •How to open Access queries through ODBC
- •How to open Access parameter queries
- •How to set up an ODBC data source
- •How to check settings for an ODBC data source
- •How to log on to an ODBC data source
- •How to add an ODBC database table to a report
- •How to log on to MS SQL Server via ODBC
- •How to log off an ODBC data source
- •How to set up an A to B, A to C link
- •How to edit an SQL query
- •How to use an ACT! database
- •How to open the NT Event Log
- •Introduction
- •Four types of data
- •Direct access database files
- •ODBC data sources
- •Crystal Query Designer files
- •Crystal Dictionary files
- •Multi-pass reporting
- •Product support
- •Web support
- •E-mail support
- •Fax support
- •Telephone support
- •Extended technical support policy
- •Product registration
- •Product return policy
- •Product replacement policy
- •Glossary
Now, when you refresh your data, the program will prompt you for the parameter values and base record selection on the values you provide. See How to create a record or group selection formula, Page 265.
How to use a parameter field in a formula
In the Insert Fields dialog box, click the Formula Tab to activate it.
Click the New button and type a name for the formula in the
Formula Name dialog box when it appears.
! Click OK when finished. The Formula Editor appears.
"Create your formula using the parameter field as you would any constant value. For example, instead of creating a formula that hard-codes the region name:
{customer.REGION} = “CA”
Use a parameter field in place of “CA”:
{customer.REGION} = {?ParameterFieldName}
When you click Accept, the program returns you to the Insert Fields dialog box with the name of the formula you just created highlighted in the Formula list box.
#Click the Insert button and place the formula where you want it to appear in your report.
$ Click Close to exit the Insert Fields dialog box.
%To see how this field works, click the PRINT PREVIEW button on the standard toolbar to run the report.
A dialog box will appear prompting you for values. See How to respond to parameter field prompts, Page 399.
NOTE: The program automatically puts a question mark before the field name to identify it as a parameter field. See Formulas 101,
Page 321.
398 |
Seagate Crystal Reports User’s Guide |
How to respond to parameter field prompts
Previewing a
report for the first time
Refreshing report data
When you preview a report for the first time, the Enter Parameter Values for Main Report dialog box appears prompting you for a value.
●If you specified a default value when you created the parameter field, the program will use that value unless you specify a new one.
●If you did not specify a default value, you must supply a value before the program will refresh the data.
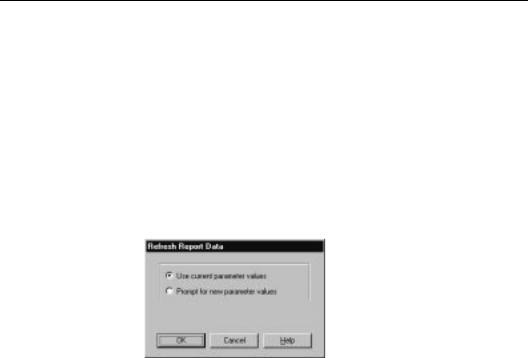
When you refresh data from the Preview Tab, the Refresh Report Data dialog box appears.
●Click the Use current parameter values button if you want to use the current parameter value.
●Click the Prompt for new parameter values button if you want to enter a new parameter value. If you choose this option and click OK, the Enter Parameter Values for Main Report dialog box appears.
¾Date values are entered using the following format: Date (Year, Month, Day). For example, Date (1997, 5, 21).
¾Boolean values are entered using the following format: TRUE or FALSE.
¾String values are entered exactly as they appear in the field.
Parameter Fields |
399 |
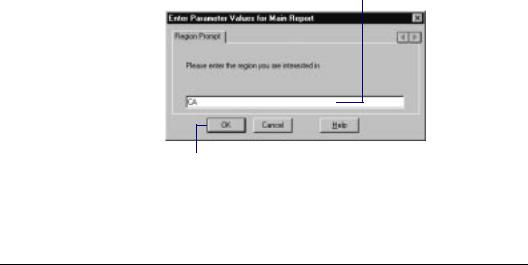
If you want to use a different value than the default displayed, type a new value in the text box, and click OK.
If you want to use the default value, simply click OK.
The program will now run the report using the new value you specify.
How to use wildcards with parameter fields
You can use wildcards in your parameter field values to increase their flexibility. When prompted for a value, simply respond with a value using a wildcard.
NOTE: You can only use a wildcard in a parameter field value if the wildcard would have been appropriate in the nonparameterized value (for example, in formulas using the Like
operator or the LooksLike function). Search for Functions and Operators and Variables in Seagate Crystal Reports online Help.
Putting your parameter field in a selection formula using the Like operator, for example, and then responding to the prompt using a wildcard, you can create record selection requests like this:
{customer.REGION} like “A?”
«The program uses all the records that have a value in the Region field beginning with A, regardless of what the second character is. This kind of request would return records from Alaska (AK), Alabama (AL), Arizona (AZ), and so forth.»
{customer.REGION} like “?A”
400 |
Seagate Crystal Reports User’s Guide |
«The program uses all the records with Region values ending in A, regardless of what the first character is. In this case, the request would return records from California (CA), Pennsylvania (PA), Washington (WA), and so forth.»
You can also use the * wildcard to create record selection requests like this:
{customer.POSTAL CODE} like “8*”
Here the program uses all the records with Postal Code values beginning with 8. Because you are using a wildcard to designate any and all missing characters, the request would return both five digit and nine-digit (ZIP plus 4) postal codes.
You can restrict your report to a smaller postal code range by increasing the number of constant characters before the wildcard. For example:
{customer.POSTAL CODE} like “84*”
In this case the program uses all the records with Postal Code values beginning with 84.
Related Topics
Record and Group Selection, Page 249
How to conditionally format using parameter fields
You can create conditional formatting formulas using parameter fields that you can customize whenever you refresh the data in the report. A typical use for such a formula would be for colorflagging data if it meets certain conditions. For example:
●sales representatives who have sales more than 10% over quota,
●customers who have not ordered in the last quarter, and
●inventory items that have not had any movement in the last month.
If the conditions under which you flag these items never changes, you do not need to use parameter fields. You can just use formulas
Parameter Fields |
401 |
(for text flags) or conditional formatting (for color or border flags). But if you want to change the conditions from report to report, you can use parameter fields in formulas and conditional formatting formulas to do it.
Create the parameter field in the data type you need for the formula.
Create the formula and use the parameter field in place of the fixed value you would normally use.
!For example, to print the names in red of all the customers who had sales last year over a certain value (that you want to be prompted for), select the Last Year’s Sales field and click the OBJECT PROPERTIES button on the supplementary toolbar. The Format Editor appears.
"Click the Conditional formula button next to the Color property on the Font Tab, and format the field using a conditional formatting formula like this:
If {customer.LAST YEAR’S SALES} > {?ParameterFieldName} Then
Red Else
Black
Now when you refresh the data, the program will prompt you for the value that triggers the color flag (know as the threshold value). It then runs the report and flags all the customers that had sales last year over the threshold figure. You can change the figure if you wish every time you run the report and the program will flag a different set of Customer Names each time.
Related Topics
How to create if-then-else formulas, Page 346
Conditional attribute properties, Page 236
Conditional formatting, Page 235
How to format objects conditionally, Page 224
402 |
Seagate Crystal Reports User’s Guide |