

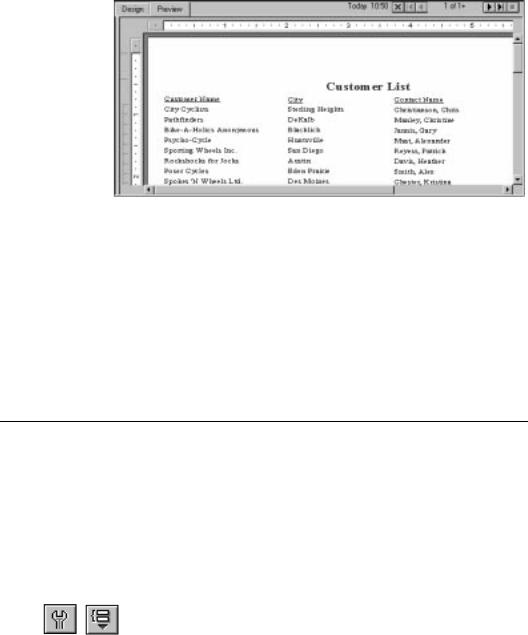
Your report should look similar to this:
The spacing between the fields is much better, but it looks as if the report title is off center.
" Click the report title object to select it.
#Position the cursor on the right handle of the object until the cursor turns into a resizing cursor. Drag the right edge of the object frame until it is even with the right edge of the data in the Contact Name field object.
The report title automatically recenters itself based on the size of the object.
Grouping and sorting
Grouping your report
Reports can be grouped and sorted in a variety of ways. Sorting and grouping tools provide you with a great deal of flexibility for customizing your reports.
In many reports you need to break your data into groups to make it easier to read and understand. Seagate Crystal Reports lets you do this easily. For this customer list, you will group the customers by region and then sort the customers alphabetically within each group.
In the Design Tab, click the INSERT GROUP button on the supplementary toolbar. The Insert Group dialog box appears.
186 |
Seagate Crystal Reports User’s Guide |
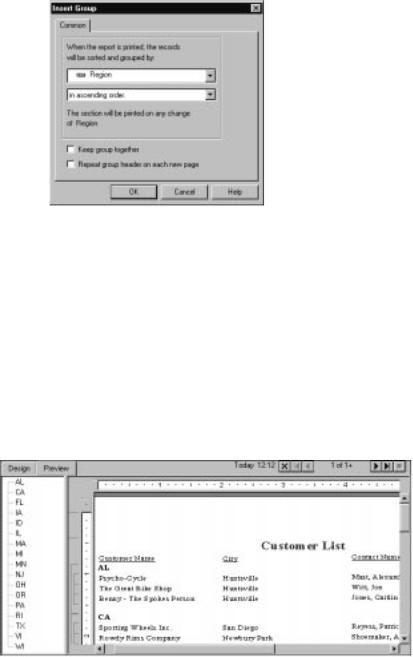
Select the Region field from the Customer table in the first drop-down box. The program will now take all records with the same value in the region field and place them together in a group on your report.
!Select in ascending order from the second drop-down box. The region grouping will be displayed on your report in alphabetic ascending order.
"Click OK.
Notice that two new sections now appear in the Design Tab: GH1 (Group Header) and GF1 (Group Footer). This is how the program shows that the report has been grouped.
# Click the Preview Tab to see what your report looks like.
Tutorial - Customer List |
187 |

Understanding
“live” group headers
Sorting records
$If the group tree is not visible, click the TOGGLE GROUP TREE button on the format bar to see the groups included in the report.
You can view the group of interest by simply clicking on the group name in the Group Tree. For example, if you would like to see the Texas customer group, simply click TX in the Group Tree. The program will jump to the Texas group, displaying that group in the Preview Tab. The Group Tree allows you to quickly jump to a specific group of interest instead of scrolling through your report looking for the group. For more information on the group tree, see Group Tree view, Page 74.
NOTE: For many of your reports you will want to insert summaries, subtotals and grand totals. For example, if you were creating a sales report rather than a customer list, you would want to calculate the total sales amount for each region. See Sorting,
Grouping, and Totalling, Page 271.
When you insert a group, a group name field is automatically inserted in the Group Header section of your report. The group name field displays the current group’s name. For example, if you group by region, when you preview your report, the group header for the CA (California) group will show “CA”.
The group field name is automatically formatted to stand out from the records in the group.
In a typical customer list report, customer names are listed alphabetically. In this example, you will sort the customer names alphabetically within each region.
In the Preview Tab, click the SORT ORDER button on the standard toolbar. The Record Sort Order dialog box appears.
188 |
Seagate Crystal Reports User’s Guide |
●The Report Fields box lists all fields currently on your report. You can choose to sort based on any of these fields.
●The Sort Fields box displays the fields that are already sorted in the report. Because the region field is already sorted, the sorting you are about to do will be within each region, not for the entire report.
Highlight the Customer Name field and click the Add button.
Notice that the Customer Name field now appears in the Sort
Fields list box.
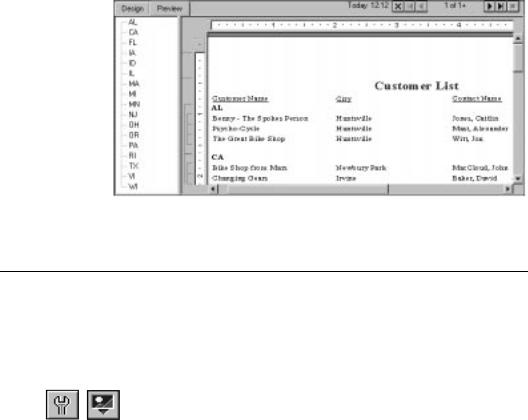
!Click the Ascending option button for the Sort Direction and click OK.
Your report should now look similar to the following:
Notice that the records within each group are in alphabetic order.
Completing the report
Inserting a company logo
You have just one step left to complete your report. You are going to add a company logo on the first page of the report.
In this section, you will place a company logo at the top of the first page of your report.
In the Design Tab, click the INSERT PICTURE button on the supplementary toolbar. The Open dialog box appears.
Tutorial - Customer List |
189 |

Choose the CRAZEC.BMP file and click Open. An object frame appears as you move the cursor over your report. The object frame represents the logo you will place.
!Position the object frame in the upper left-hand corner of the Report Header (RH) section of your report and click once.
Placing the logo in the Report Header (RH) section ensures that the logo is printed only on the first page of your report. See
Area printing characteristics, Page 69.
NOTE: Although there does not appear to be enough room in the Report Header (RH) section when you place the graphic, the section will automatically expand to accommodate the picture.
"Click the Preview Tab to view your report. Your final report should look like this:
#Save your report by clicking on the SAVE button on the standard toolbar.
You have just completed your first report. It is a pretty impressive report, and Seagate Crystal Reports made it easy to do.
Related Topics
For information about distributing your report (printing, exporting, etc.) see Printing, Viewing, and Exporting, Page 135.
190 |
Seagate Crystal Reports User’s Guide |
8 |
Reporting on OLAP data |
What you will find in this chapter...
Introduction, Page 192
Arbor Essbase client drivers, Page 193
Selecting members for dynamic reporting, Page 193
Combining data using subreports, Page 195
Essbase database security, Page 196
The report definition and the Essbase outline, Page 197
Storing database outlines, Page 198
Saving reports without outlines, Page 198
Server independence of reports, Page 199
Updating Essbase server and database locations, Page 200
Efficient access of Essbase databases, Page 201
Optimizing for large Essbase databases, Page 201
HANDS-ON (Reporting on OLAP data), Page 202
Reporting on OLAP data |
191 |