

n29fIAwxpY
.pdfTab. 7.5. The results of the Pz05 sample microanalysis
Sample |
C |
O |
F |
Na |
Mg |
Al |
Si |
S |
K |
Ca |
Fe |
PZ05(1)1 |
6.68 |
53.89 |
0.64 |
1.30 |
0.54 |
1.18 |
4.61 |
7.27 |
7.42 |
16.47 |
|
PZ05(1)2 |
6.34 |
51.88 |
|
1.19 |
1.06 |
2.21 |
8.15 |
6.92 |
7.65 |
14.59 |
|
PZ05(1)3 |
3.11 |
38.76 |
|
1.32 |
0.63 |
2.96 |
8.39 |
6.92 |
10.21 |
27.70 |
|
PZ05(1)4 |
2.57 |
45.38 |
|
1.88 |
|
3.49 |
10.53 |
1.12 |
1.14 |
33.89 |
|
PZ05(1)5 |
5.13 |
46.91 |
|
1.29 |
|
3.85 |
14.15 |
2.93 |
5.51 |
20.23 |
|
PZ05(1)6 |
4.05 |
44.76 |
|
0.83 |
|
1.82 |
11.77 |
|
4.97 |
31.79 |
|
PZ05(1)7 |
5.93 |
49.49 |
|
|
0.46 |
2.38 |
15.93 |
1.20 |
3.94 |
20.68 |
|
PZ05(1)8 |
4.58 |
48.67 |
|
1.18 |
|
1.57 |
8.29 |
7.56 |
8.28 |
19.88 |
|
PZ05(1)9 |
4.28 |
39.99 |
|
1.13 |
4.13 |
4.47 |
14.48 |
|
1.36 |
10.00 |
20.16 |
PZ05(1)10 |
3.66 |
35.52 |
|
|
1.64 |
5.60 |
12.96 |
7.56 |
16.29 |
13.22 |
3.56 |
PZ05(1)11 |
6.31 |
50.70 |
|
|
|
5.56 |
17.15 |
|
|
20.28 |
|
PZ05(1)12 |
6.98 |
45.90 |
|
3.00 |
|
4.34 |
14.74 |
4.36 |
|
20.69 |
|
PZ05(1)13 |
4.33 |
51.76 |
0.33 |
4.05 |
0.84 |
7.63 |
18.30 |
|
1.33 |
11.43 |
|
PZ05(1)14 |
4.33 |
47.00 |
|
3.62 |
0.37 |
8.35 |
22.70 |
|
1.51 |
12.12 |
|
PZ05(1)15 |
6.50 |
52.56 |
|
0.85 |
0.71 |
1.51 |
8.58 |
|
|
29.28 |
|
PZ05(1)16 |
2.87 |
49.82 |
|
5.99 |
|
10.44 |
24.41 |
|
1.01 |
5.45 |
|
PZ05(1)17 |
4.10 |
32.67 |
|
2.97 |
|
11.17 |
31.98 |
|
2.15 |
14.97 |
|
PZ05(1)18 |
5.90 |
48.68 |
|
|
|
6.25 |
19.37 |
|
4.26 |
15.54 |
|
PZ05(1)19 |
8.12 |
37.63 |
|
1.25 |
1.64 |
6.48 |
15.41 |
|
11.58 |
17.88 |
|
PZ05(1)20 |
5.70 |
51.68 |
2.93 |
1.64 |
0.73 |
1.76 |
6.43 |
|
2.77 |
26.37 |
|
PZ05(1)21 |
5.24 |
46.47 |
|
1.37 |
|
4.63 |
21.15 |
|
4.24 |
16.89 |
|
PZ05(1)22 |
6.67 |
54.13 |
|
1.35 |
0.62 |
1.85 |
5.25 |
0.72 |
1.02 |
28.39 |
|
PZ05(1)23 |
3.17 |
36.46 |
|
1.44 |
|
4.99 |
18.84 |
5.00 |
6.74 |
23.35 |
|
PZ05(1)24 |
5.04 |
48.66 |
|
4.12 |
0.52 |
5.37 |
15.35 |
2.43 |
2.56 |
15.98 |
|
Tab. 7.6. The results of the Pz06 sample microanalysis
Sample |
C |
N |
O |
F |
Na |
Mg |
Al |
Si |
P |
K |
Ca |
Fe |
PZ06(1)1 |
12.61 |
|
43.38 |
|
0.95 |
1.26 |
9.85 |
19.69 |
|
2.25 |
1.86 |
8.16 |
PZ06(1)2 |
6.26 |
|
42.25 |
|
|
3.71 |
8.23 |
16.68 |
|
5.16 |
2.83 |
14.89 |
PZ06(1)3 |
13.60 |
|
41.19 |
2.19 |
|
1.93 |
4.49 |
23.35 |
|
|
13.26 |
|
PZ06(1)4 |
15.33 |
|
43.92 |
|
|
|
4.07 |
19.40 |
|
9.70 |
7.57 |
|
PZ06(1)5 |
17.66 |
|
44.82 |
|
|
1.56 |
4.89 |
17.98 |
|
|
13.09 |
|
PZ06(1)6 |
14.73 |
|
47.19 |
|
|
0.97 |
4.10 |
18.70 |
|
|
14.32 |
|
PZ06(1)7 |
4.84 |
|
49.76 |
7.66 |
1.08 |
3.68 |
6.74 |
18.25 |
|
1.41 |
6.58 |
|
PZ06(1)8 |
16.47 |
|
40.36 |
|
|
5.45 |
5.10 |
12.07 |
|
2.55 |
5.51 |
12.48 |
PZ06(1)9 |
16.28 |
|
46.73 |
2.48 |
0.68 |
1.30 |
2.46 |
26.29 |
|
|
3.78 |
|
PZ06(1)10 |
24.65 |
8.06 |
42.57 |
|
|
0.46 |
2.63 |
13.12 |
|
|
8.52 |
|
PZ06(1)11 |
14.34 |
|
48.66 |
1.87 |
0.81 |
1.02 |
3.41 |
24.27 |
0.67 |
|
4.95 |
|
PZ06(1)12 |
18.81 |
|
42.88 |
|
|
1.35 |
4.30 |
15.56 |
|
|
9.09 |
8.01 |
PZ06(1)13 |
5.07 |
|
28.16 |
|
0.94 |
3.08 |
1.70 |
3.72 |
|
|
0.95 |
56.38 |
PZ06(1)14 |
22.37 |
|
51.83 |
|
|
|
6.00 |
19.80 |
|
|
|
|
PZ06(1)15 |
6.62 |
|
49.98 |
|
5.41 |
|
9.41 |
25.13 |
|
|
3.45 |
|
PZ06(1)16 |
26.83 |
|
46.18 |
|
|
|
4.80 |
13.90 |
|
|
8.28 |
|
PZ06(1)17 |
21.10 |
|
46.79 |
|
|
|
2.71 |
12.01 |
5.05 |
|
12.34 |
|
PZ06(1)18 |
4.46 |
|
32.34 |
|
|
|
3.02 |
9.10 |
|
|
51.08 |
|
PZ06(1)19 |
22.50 |
|
49.59 |
|
|
|
5.85 |
22.07 |
|
|
|
|
PZ06(1)20 |
20.21 |
|
46.93 |
|
|
2.31 |
4.45 |
17.72 |
|
|
8.37 |
|
PZ06(1)21 |
17.50 |
|
49.11 |
|
|
|
5.08 |
16.61 |
|
4.15 |
7.56 |
|
PZ06(1)22 |
22.60 |
|
50.14 |
|
|
1.61 |
5.01 |
20.64 |
|
|
|
|
PZ06(1)23 |
17.44 |
|
42.20 |
|
|
1.21 |
4.77 |
20.53 |
|
|
13.86 |
|
PZ06(1)24 |
3.70 |
|
30.27 |
|
|
0.58 |
2.17 |
6.42 |
|
1.16 |
2.12 |
53.58 |
PZ06(1)25 |
19.05 |
|
46.43 |
|
|
|
4.57 |
18.75 |
|
|
11.19 |
|
161
Tab. 7.7. The results of the Pz07 sample microanalysis
Sample |
C |
N |
O |
F |
Na |
Mg |
Al |
Si |
K |
Ca |
Fe |
Zn |
Br |
PZ07(1)1 |
11.65 |
|
37.56 |
|
|
3.23 |
6.22 |
16.60 |
|
7.95 |
13.64 |
3.14 |
|
PZ07(1)2 |
30.82 |
|
43.34 |
|
2.50 |
2.26 |
3.77 |
9.27 |
|
8.05 |
|
|
|
PZ07(1)3 |
11.91 |
|
49.56 |
1.35 |
7.14 |
1.13 |
7.29 |
12.90 |
|
8.72 |
|
|
|
PZ07(1)4 |
40.45 |
|
46.46 |
|
|
|
3.91 |
9.19 |
|
|
|
|
|
PZ07(1)5 |
30.20 |
|
37.38 |
|
|
|
3.85 |
10.77 |
|
7.64 |
|
10.17 |
|
PZ07(1)6 |
14.18 |
|
37.26 |
|
|
3.55 |
4.86 |
13.21 |
|
6.19 |
16.08 |
4.66 |
|
PZ07(1)7 |
14.36 |
|
50.03 |
0.61 |
|
0.59 |
1.51 |
28.33 |
|
|
|
4.57 |
|
PZ07(1)8 |
30.56 |
|
49.15 |
|
|
|
4.79 |
10.58 |
|
4.92 |
|
|
|
PZ07(1)9 |
11.56 |
|
39.31 |
1.66 |
|
2.50 |
5.59 |
13.54 |
|
7.73 |
|
18.09 |
|
PZ07(1)10 |
10.52 |
|
34.72 |
|
|
4.31 |
7.33 |
14.38 |
|
2.71 |
11.77 |
14.27 |
|
PZ07(1)11 |
8.82 |
|
45.68 |
9.12 |
|
5.76 |
7.59 |
17.05 |
5.99 |
|
|
|
|
PZ07(1)12 |
23.72 |
|
38.16 |
|
|
2.97 |
5.29 |
13.85 |
|
|
|
16.01 |
|
PZ07(1)13 |
8.25 |
|
39.16 |
2.89 |
|
4.54 |
|
15.42 |
3.00 |
2.41 |
|
11.52 |
12.81 |
PZ07(1)14 |
23.70 |
4.93 |
38.80 |
1.10 |
|
1.18 |
3.05 |
7.74 |
|
3.74 |
|
15.77 |
|
PZ07(1)15 |
40.79 |
9.14 |
44.28 |
|
|
|
1.50 |
4.29 |
|
|
|
|
|
PZ07(1)16 |
31.00 |
|
43.30 |
0.79 |
|
|
2.90 |
5.56 |
|
5.15 |
|
11.31 |
|
PZ07(1)17 |
47.65 |
|
48.43 |
|
|
1.09 |
|
2.83 |
|
|
|
|
|
PZ07(1)18 |
29.07 |
4.03 |
39.07 |
|
|
|
2.65 |
8.03 |
|
4.15 |
|
13.00 |
|
PZ07(1)19 |
24.27 |
|
38.70 |
|
|
|
1.35 |
24.72 |
|
3.04 |
|
7.92 |
|
PZ07(1)20 |
40.82 |
|
54.52 |
|
|
|
|
4.66 |
|
|
|
|
|
PZ07(1)21 |
12.73 |
|
49.68 |
0.61 |
|
0.66 |
1.30 |
30.07 |
|
0.98 |
|
3.97 |
|
PZ07(1)22 |
16.08 |
|
41.03 |
|
3.31 |
1.34 |
4.82 |
31.11 |
|
2.30 |
|
|
|
PZ07(1)23 |
12.90 |
|
40.27 |
1.39 |
|
2.22 |
4.79 |
13.74 |
|
5.03 |
|
19.68 |
|
PZ07(1)24 |
29.37 |
5.35 |
42.87 |
|
1.59 |
|
4.19 |
13.31 |
3.32 |
|
|
|
|
PZ07(1)25 |
7.59 |
|
43.34 |
0.70 |
|
1.97 |
5.15 |
12.44 |
|
6.92 |
|
21.90 |
|
Tab. 7.8. The results of the Pz08 sample microanalysis
Sample |
C |
N |
O |
F |
Na |
Al |
Si |
P |
S |
Cl |
K |
Ca |
Ti |
Ba |
PZ08(1)1 |
7.85 |
|
44.50 |
3.13 |
0.75 |
|
1.29 |
8.48 |
|
2.12 |
|
31.89 |
|
|
PZ08(1)2 |
9.76 |
|
46.49 |
|
4.43 |
9.01 |
18.98 |
|
|
1.37 |
|
9.95 |
|
|
PZ08(1)3 |
8.16 |
|
48.33 |
|
3.64 |
7.16 |
16.84 |
|
|
1.33 |
|
12.60 |
1.94 |
|
PZ08(1)4 |
7.26 |
|
42.16 |
|
|
|
2.40 |
|
|
3.24 |
|
39.52 |
5.42 |
|
PZ08(1)5 |
9.69 |
|
47.43 |
|
|
|
2.73 |
|
|
3.40 |
|
36.75 |
|
|
PZ08(1)6 |
7.91 |
|
43.68 |
|
|
0.94 |
3.28 |
|
|
2.20 |
|
37.95 |
4.03 |
|
PZ08(1)7 |
10.25 |
|
37.35 |
|
2.59 |
8.20 |
23.11 |
|
|
3.25 |
|
15.25 |
|
|
PZ08(1)8 |
9.19 |
|
42.18 |
|
|
|
3.49 |
|
|
3.62 |
|
41.51 |
|
|
PZ08(1)9 |
15.40 |
|
50.00 |
|
|
1.21 |
4.70 |
|
|
3.78 |
|
24.91 |
|
|
PZ08(1)10 |
8.36 |
|
48.55 |
|
|
|
2.22 |
|
|
2.02 |
|
38.85 |
|
|
PZ08(1)11 |
28.81 |
17.15 |
42.45 |
|
|
|
1.41 |
|
|
1.91 |
|
8.28 |
|
|
PZ08(1)12 |
10.61 |
|
51.12 |
|
|
|
2.25 |
|
|
1.98 |
|
34.03 |
|
|
PZ08(1)13 |
6.22 |
|
39.16 |
|
|
|
2.10 |
|
|
2.39 |
|
47.22 |
2.91 |
|
PZ08(1)14 |
9.48 |
|
48.27 |
|
|
|
2.84 |
|
|
2.79 |
|
36.62 |
|
|
PZ08(1)15 |
7.79 |
|
44.91 |
|
|
|
2.21 |
|
|
3.16 |
|
37.91 |
4.02 |
|
PZ08(1)16 |
10.40 |
|
47.78 |
|
|
|
4.17 |
|
|
3.48 |
|
31.40 |
2.77 |
|
PZ08(1)17 |
10.48 |
|
51.06 |
|
|
|
15.62 |
|
|
1.82 |
|
18.73 |
2.29 |
|
PZ08(1)18 |
8.83 |
|
39.89 |
|
|
|
3.15 |
|
|
5.21 |
|
42.91 |
|
|
PZ08(1)19 |
9.40 |
|
46.63 |
|
|
|
2.84 |
|
|
2.95 |
|
35.53 |
2.66 |
|
PZ08(1)20 |
5.76 |
|
39.60 |
|
|
|
2.39 |
|
|
2.56 |
|
45.84 |
3.84 |
|
PZ08(1)21 |
12.07 |
|
50.97 |
1.18 |
|
1.29 |
5.79 |
|
|
3.37 |
|
25.33 |
|
|
PZ08(1)22 |
9.65 |
|
47.57 |
|
|
|
2.59 |
|
|
2.07 |
|
30.90 |
|
7.21 |
PZ08(1)23 |
10.07 |
|
41.16 |
|
|
2.56 |
7.51 |
|
|
3.27 |
10.57 |
24.86 |
|
|
PZ08(1)24 |
8.89 |
|
47.96 |
|
|
|
2.84 |
|
4.47 |
2.51 |
|
33.33 |
|
|
PZ08(1)25 |
10.48 |
|
43.38 |
|
|
2.19 |
2.64 |
|
|
3.41 |
|
37.90 |
|
|
162
Tab. 7.91. The results of the Pz09 sample microanalysis
Sample |
C |
N |
O |
F |
Na |
Mg |
Al |
Si |
P |
Cl |
K |
Ca |
Ti |
Fe |
Br |
PZ09(1)1 |
15.48 |
|
35.35 |
|
|
2.68 |
6.12 |
8.84 |
|
|
|
9.44 |
|
22.08 |
|
PZ09(1)2 |
7.54 |
|
31.50 |
|
|
2.23 |
2.81 |
5.01 |
|
|
|
6.08 |
|
44.84 |
|
PZ09(1)3 |
16.78 |
|
37.29 |
|
|
1.44 |
3.97 |
7.55 |
|
|
|
16.50 |
|
16.48 |
|
PZ09(1)4 |
11.29 |
|
33.33 |
|
|
0.62 |
1.87 |
5.37 |
1.08 |
1.41 |
|
4.08 |
|
40.94 |
|
PZ09(1)5 |
13.68 |
|
41.37 |
|
7.50 |
1.23 |
10.85 |
13.25 |
|
|
3.09 |
4.21 |
|
4.84 |
|
PZ09(1)6 |
7.85 |
|
50.39 |
2.03 |
|
3.34 |
6.40 |
17.07 |
|
|
1.55 |
11.37 |
|
|
|
PZ09(1)7 |
20.16 |
|
43.63 |
|
|
|
4.77 |
9.00 |
|
|
|
22.44 |
|
|
|
PZ09(1)8 |
21.52 |
|
47.84 |
|
|
|
4.12 |
10.19 |
|
|
|
16.34 |
|
|
|
PZ09(1)9 |
10.73 |
|
50.41 |
1.74 |
0.80 |
|
2.50 |
27.68 |
|
|
|
6.14 |
|
|
|
PZ09(1)10 |
24.07 |
|
48.28 |
0.61 |
|
2.06 |
3.46 |
13.55 |
|
|
|
7.97 |
|
|
|
PZ09(1)11 |
6.89 |
|
31.69 |
|
|
|
1.86 |
4.65 |
|
|
|
5.93 |
|
48.98 |
|
PZ09(1)12 |
20.86 |
|
39.76 |
|
|
|
|
11.72 |
|
|
|
18.74 |
|
|
8.92 |
PZ09(1)13 |
12.23 |
|
38.19 |
|
|
0.84 |
4.55 |
10.21 |
|
1.49 |
|
32.50 |
|
|
|
PZ09(1)14 |
11.65 |
|
33.85 |
|
|
1.59 |
2.08 |
5.10 |
|
1.64 |
|
19.99 |
|
24.10 |
|
PZ09(1)15 |
20.88 |
|
40.69 |
0.77 |
|
|
3.16 |
9.43 |
|
|
|
25.08 |
|
|
|
PZ09(1)16 |
21.84 |
|
45.56 |
|
|
|
3.94 |
11.41 |
|
|
|
17.26 |
|
|
|
PZ09(1)17 |
9.77 |
|
44.20 |
2.53 |
|
4.29 |
5.88 |
13.65 |
|
|
4.73 |
12.22 |
2.73 |
|
|
PZ09(1)18 |
20.29 |
5.57 |
51.20 |
|
1.00 |
|
3.66 |
7.29 |
|
|
|
10.99 |
|
|
|
PZ09(1)19 |
20.46 |
|
44.18 |
|
|
|
|
10.48 |
|
|
|
15.96 |
|
|
8.92 |
PZ09(1)20 |
19.83 |
|
43.81 |
|
|
|
2.91 |
10.12 |
|
1.96 |
|
21.36 |
|
|
|
PZ09(1)21 |
15.40 |
|
41.27 |
|
|
|
2.79 |
7.68 |
|
|
|
32.85 |
|
0.00 |
|
PZ09(1)22 |
26.25 |
|
41.77 |
|
|
1.54 |
2.92 |
9.72 |
|
|
|
17.81 |
|
|
|
PZ09(1)23 |
25.58 |
|
43.45 |
|
|
1.73 |
4.25 |
9.72 |
|
|
|
15.27 |
|
|
|
PZ09(1)24 |
12.49 |
|
50.45 |
|
1.17 |
|
3.26 |
28.12 |
|
|
|
4.52 |
|
|
|
Tab. 7.10. The results of the Pz10 sample microanalysis
Sample |
C |
N |
O |
F |
Na |
Mg |
Al |
Si |
S |
Cl |
K |
Ca |
Ti |
Fe |
Br |
PZ10(1)1 |
4.27 |
|
36.17 |
|
|
|
1.10 |
4.09 |
|
|
|
13.45 |
|
40.92 |
|
PZ10(1)2 |
4.95 |
|
45.96 |
1.04 |
|
|
1.15 |
5.51 |
|
|
|
41.39 |
|
|
|
PZ10(1)3 |
12.32 |
|
29.58 |
|
|
1.06 |
2.73 |
34.31 |
|
|
|
19.99 |
|
|
|
PZ10(1)4 |
28.71 |
|
48.38 |
|
|
|
1.57 |
7.21 |
2.14 |
|
1.90 |
10.10 |
|
|
|
PZ10(1)5 |
13.25 |
|
43.74 |
|
|
1.21 |
3.42 |
11.11 |
|
|
3.63 |
23.63 |
|
|
|
PZ10(1)6 |
23.62 |
|
42.69 |
|
|
|
2.94 |
13.88 |
|
|
|
16.87 |
|
|
|
PZ10(1)7 |
11.90 |
|
37.91 |
|
|
2.84 |
4.54 |
19.78 |
|
|
3.87 |
17.06 |
|
2.09 |
|
PZ10(1)8 |
3.87 |
|
28.56 |
|
|
0.76 |
1.16 |
6.58 |
|
|
|
59.06 |
|
|
|
PZ10(1)9 |
6.42 |
|
47.27 |
0.44 |
|
0.90 |
1.52 |
12.84 |
|
|
|
30.59 |
|
|
|
PZ10(1)10 |
5.72 |
|
46.26 |
|
2.38 |
1.17 |
5.04 |
13.56 |
|
|
|
25.87 |
|
|
|
PZ10(1)11 |
2.69 |
|
34.09 |
|
|
|
1.27 |
6.55 |
|
|
|
50.55 |
4.85 |
|
|
PZ10(1)12 |
14.76 |
6.23 |
41.91 |
|
|
0.86 |
1.83 |
9.50 |
|
|
1.29 |
23.62 |
|
|
|
PZ10(1)13 |
7.26 |
|
42.89 |
|
1.26 |
0.73 |
3.63 |
15.96 |
|
|
|
28.26 |
|
|
|
PZ10(1)14 |
5.49 |
|
48.23 |
|
|
0.62 |
1.71 |
9.69 |
|
|
|
34.26 |
|
|
|
PZ10(1)15 |
6.06 |
|
40.57 |
0.23 |
0.60 |
|
1.83 |
7.20 |
|
|
1.65 |
41.85 |
|
|
|
PZ10(1)16 |
10.32 |
|
54.22 |
|
1.18 |
|
|
7.66 |
0.55 |
|
|
21.37 |
|
|
4.70 |
PZ10(1)17 |
8.66 |
|
39.49 |
|
|
0.94 |
2.71 |
6.18 |
|
|
|
42.02 |
|
|
|
PZ10(1)18 |
12.91 |
|
36.80 |
|
|
0.44 |
3.21 |
10.35 |
|
|
2.16 |
9.74 |
|
24.38 |
|
PZ10(1)19 |
9.09 |
|
48.58 |
|
|
|
3.46 |
9.24 |
|
|
|
29.63 |
|
|
|
PZ10(1)20 |
8.67 |
|
49.81 |
|
|
0.98 |
1.75 |
9.98 |
|
|
1.46 |
27.34 |
|
|
|
PZ10(1)21 |
8.45 |
|
37.21 |
|
|
0.80 |
3.10 |
12.54 |
|
|
2.23 |
35.66 |
|
|
|
PZ10(1)22 |
9.35 |
|
44.66 |
1.60 |
|
3.91 |
6.52 |
15.75 |
|
|
4.16 |
14.05 |
|
|
|
PZ10(1)23 |
23.46 |
|
45.80 |
1.84 |
|
1.14 |
2.41 |
7.13 |
|
|
0.84 |
12.68 |
4.69 |
|
|
PZ10(1)24 |
10.76 |
|
49.10 |
|
|
3.72 |
2.02 |
12.66 |
|
|
1.07 |
20.67 |
|
|
|
PZ10(1)25 |
19.33 |
|
49.50 |
1.61 |
0.92 |
0.92 |
1.77 |
7.35 |
|
0.98 |
0.72 |
16.89 |
|
|
|
163
8. Compare of results from selected Cities in Kola Peninsula
8.1. Introduction
To summarize the content of metals in the individual plaster samples from Murmansk Oblasti towns should try to compare these data with each other. By analyzing individual cities one can say that Murmansk, the capital of the region, is developing fastest among all the surveyed. Polarnye Zori is also a relatively good place, where the main industry is the power station. Kola in the race. In principle, after Murmansk many cities are closely related to a specific industry group in the region, this is the result of the history of these towns built as workers’ auxiliary housing for large investments. This threatens to “depend” on the condition of their only source of income. Brilliant cases are already seen today on the example of Rievdy, a town that is in decline just because of too strong attachment to one type of income, which is now recession due to the quarrying and processing plants nearby. As a result, even though there is a midwife in the picturesque part of the foothills of the Lowozierskie Mountains, having interesting cultural links with themselves and the prospects for tourism development, it is difficult to say today whether it will grow if it does not receive aid to diversify its income. This is attributed to social conditioning and urban development. Where there is no income the houses are decaying. General outflow of people from the far north is readable in many cities, which have seen a significant decline since the beginning of the 21st century compared to the end of the 20th century. It is visible in many cities such as Oleniegorsk, which was planned for a much larger number of inhabitants than now (a large number of spacious wide streets, avenue, which today even on a working day are empty). This tendency may be reversed by system solutions. However, the nature of the houses is influenced by the climate with long winters, with periods of freezing, which causes me to corrode the walls. This is evident in all cities in this and Murmansk where many attractive renovated homes are relatively severely damaged. Microscopic studies show relatively large amounts of precipitates, solid impurities and plants that enter the house façades as a result of their dampness.
Micro-area studies have also allowed for the detection of many permanent pollutants resulting from the nature of these cities. This is confirmed by geochemical analyzes, the results of which are contained in individual chapters.
8.2. Selection of methodology
This section compares the results of the analysis in the previous sections. The highest content of a given metal was obtained from ICP-OAS and Asa analyzes in urban plaster samples and maximum, minimum and average
164
cumulative values for cities. A similar breakdown was made for individual metals (graphs 8.2–8.11 in the annex).
8.3. Results
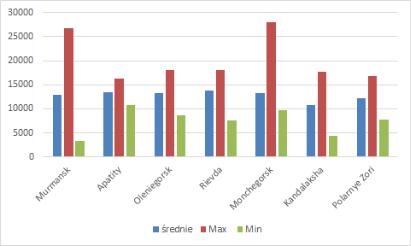
Comparison of examined metal values by ICP-OAS and ASA analyzes shows that, among all over one hundred samples from seven Murmansk Oblasti cities, the highest pollutant values were found for: zinc in sample Mu29 (921ppm) for manganese in the same sample 1228.00ppm, Sample Mon08 (23959ppm) and copper in the same sample (209ppm), arsenic for sample Mu03 (17,30ppm) similarly titanium in the same sample 6186ppm, lead in sample Mon01 (9836ppm), nickel ApO3 (258ppm) chromium KK08 (109ppm) Cadmium in sample Mu06 (60.80ppm). Most of these impurities were recorded for Murmans for 5 metals (Zn, Mn, As, Ti, Cd), Monchegors (Fe, Cu, Pb) for 3 metals, and Kandlakshy (Cr) and Apatites (Ni). Especially important for metals such as lead, cadmium, arsenic, zinc. By studying the maximum, minimum and average values for individual metals, it can be shown that for zinc, the highest values were recorded in Murmansk, followed by Monchegorsk, Kandalakshy, Riev and Apatites (fig. 8.2). In the case of manganese (fig. 8.3), the highest values were recorded for Murmansk, Monchegorska, Kandalakshy and Rievdy (fig. 8.3). Iron most in Murmansk, Monchegorsk, Polar Zorah, Riev and Oleniegorsk (fig. 8.4). For copper in Monchegorsk and Murmansk (fig. 8.5). For arsenic it is Murmansk, Monchegorsk, Kandalaksha (fig. 8.6). For lead they are Monchegorsk, Kandalaksha, Murmansk (fig. 8.7). Nickel in Monchegorsk, Apatites and Murmansk (fig. 8.8). Chrome in Kandalakshy, Murmansk and Oleniegorsk (fig. 8.9). Titanium in Riev, Murmansk, Apatites and Olenegorsk (fig. 8.10), cadmium in Murmansk Kandalaksha and Monchegorsk (fig. 8.11). By analyzing the cumulative value graph, it can be seen that most of the admixtures of metals in the studied plaster samples appear in Monchegorsk and Murmansk then in Oleniegorsk, Riev and Kandalaksha and the least in Apatites.
Fig. 8.1. Cumulative maximum and minimum maximum cumulative values for all cities surveyed
165

8.4. Discussion
By summing up the data obtained from the above results it can be stated that the most polluted city of the Murmansk Oblast is Murmansk, the largest city in the region, followed by Monchegorsk and other places in the city. In Murmansk there were high values of cumulative admixtures, in the five metals tested the highest values, and analyzing the content of individual metals in the most common high admixtures. Particularly important are values for cadmium, arsenic, zinc. These elements are very harmful and their amount in the environment should be as low as possible. Monchegorsk is also a heavily polluted city, indicating the highest values for the three metals, high cumulative values and analysis of individual elements. Especially high are the values of lead and zinc. You have to remember that there are combinations in the city that deal with non-ferrous metal ores and numerous nearby deposits of monochromatic intrusions. In case of Apatites, Kandalakshy and Rievdy these values are smaller but also in many cases alarming. Oleniegorsk and Polarnye Zori are the best ones. This is the second city in the forest and it is one of the few cities where there is no heavy industry behind a distant nuclear power plant.
8.5. Conclusions
Murmansk and Monchegorsk are the most polluted cities in the Murmansk Oblast. This is due to the developed industry, the transport of many materials and the size of cities. Much less polluted cities are Apatite, Kandalaksha and Rievda, although the values of some metals are also high. All cities, however, have a relatively high content of metals, which is also due to their location in the northern part of the Baltic Shield, where there are igneous and metamorphic rocks containing many deposits and thus increase the level of the background.
8.6. Graphic attachement
Zn
1000
900
800
700
600
500
400
300
200
100
0
max min średnia |
max min średnia |
max min średnia |
max min średnia |
max min średnia |
max min średnia |
max min średnia |
Mu |
Ap |
Ole |
Rv |
Mon |
Kk |
Pz |
Fig. 8.2. Graphs of maximum values of mean and minimum Zn content in all plaster samples tested, grouped into cities
166
Mn
1400
1200
1000
800
600
400
200
0
max min średnia |
max min średnia |
max min średnia |
max min średnia |
max min średnia |
max min średnia |
max min średnia |
Mu |
Ap |
Ole |
Rv |
Mon |
Kk |
Pz |
Fig. 8.3. Graphs of maximum values of mean and minimum Mn content in all plaster samples tested, grouped into cities
Fe
30000
25000
20000
15000
10000
5000
0
max min średnia |
max min średnia |
max min średnia |
max min średnia |
max min średnia |
max min średnia |
max min średnia |
Mu |
Ap |
Ole |
Rv |
Mon |
Kk |
Pz |
Fig. 8.4. Graphs of maximum values of mean and minimum Fe content in all plaster samples tested, grouped into cities
Cu
250
200
150
100
50
0
max min średnia |
max min średnia |
max min średnia |
max min średnia |
max min średnia |
max min średnia |
max min średnia |
Mu |
Ap |
Ole |
Rv |
Mon |
Kk |
Pz |
Fig. 8.5. Graphs of maximum values of mean and minimum Cu content in all plaster samples tested, grouped into cities
167

As
20
18
16
14
12
10
8
6
4
2
0
max min średnia |
max min średnia |
max min średnia |
max min średnia |
max min średnia |
max min średnia |
max min średnia |
Mu |
Ap |
Ole |
Rv |
Mon |
Kk |
Pz |
Fig. 8.6. Graphs of maximum values of mean and minimum As content in all plaster samples tested, grouped into cities
Pb
10000
1000
100
10
1
0,1
0,01
max min średnia |
max min średnia |
max min średnia |
max min średnia |
max min średnia |
max min średnia |
max min średnia |
Mu |
Ap |
Ole |
Rv |
Mon |
Kk |
Pz |
|
|
|
|
|
|
|
Fig. 8.7. Graphs of maximum values of mean and minimum Pb content in all plaster samples tested, grouped into cities.
Ni
300
250
200
150
100
50
0
max min średnia |
max min średnia |
max min średnia |
max min średnia |
max min średnia |
max min średnia |
max min średnia |
Mu |
Ap |
Ole |
Rv |
Mon |
Kk |
Pz |
Fig. 8.8. Graphs of maximum values of mean and minimum Ni content in all plaster samples tested, grouped into cities
168

Cr
120
100
80
60
40
20
0
max min średnia |
max min średnia |
max min średnia |
max min średnia |
max min średnia |
max min średnia |
max min średnia |
Mu |
Ap |
Ole |
Rv |
Mon |
Kk |
Pz |
Fig. 8.9. Graphs of maximum values of mean and minimum Cr content in all plaster samples tested, grouped into cities
Ti
7000
6000
5000
4000
3000
2000
1000
0
max min średnia |
max min średnia |
max min średnia |
max min średnia |
max min średnia |
max min średnia |
max min średnia |
Mu |
Ap |
Ole |
Rv |
Mon |
Kk |
Pz |
Fig. 8.10. Graphs of maximum values of mean and minimum Ti content in all plaster samples tested, grouped into cities
Cd
70
60
50
40
30
20
10
0
max min średnia |
max min średnia |
max min średnia |
max min średnia |
max min średnia |
max min średnia |
max min średnia |
Mu |
Ap |
Ole |
Rv |
Mon |
Kk |
Pz |
Fig. 8.11. Graphs of maximum values of mean and minimum Cd content in all plaster samples tested, grouped into cities.
169
C. Conclusion
This study was developed as a result of innovative research in selected cities of Murmansk Oblast. As a result of field analyses, the elevations of houses in selected seven towns of Kola Peninsula were listed. Plaster samples taken in these cities were examined by microscopic and geochemical methods. Although they are pilot-based, they in many cases make it possible to draw interesting conclusions about the character of cities in Murmansk Oblast. The analyses show clearly that many of these cities have a very interesting history, their development was done with attention to detail adapted to the environment and location of these centres. Later blocks in many respects after one exception (Polarnye Zori) are heavily spatial landscape but anyway they represent a progression in the general characteristics of the development of these cities. The tested plaster samples exhibit numerous traces of corrosion which are indispensable in this climate in which this building is located. Micro-area studies and geochemical analyses have also shown a significant amount of metal admixtures in the plaster samples discussed. Both micro surface area investigations and geochemical analyses indicate a significant share of metals such as zinc, copper, nickel as well as arsenic, cadmium and lead. These are metals related to human activities and point to the urgent need for urban reorganization processes to increase the living conditions of their residents by paying attention to environmental protection. These actions should also be conducted to reduce traffic (transit) and to contribute to the rejuvenation of the rolling stock of people. These problems, which have arisen from the times of state transformation in such a large country as Russia, are still readable, but it is also important to note that the authorities today are trying to move towards a better one. Changes are visible although it seems that they could happen faster.
170