

The Measurement of Inequality of Opportunity
.pdfTable 6: Reduced-Form OLS Regression of Earnings on Observed Circumstances.
|
BRAZIL |
COLOMBIA |
ECUADOR |
GUATEMALA |
PANAMA |
PERU |
Female |
-0.589*** |
-0.487*** |
-0.799*** |
-1.028*** |
-0.399*** |
-0.638*** |
|
[0.009] |
[0.028] |
[0.030] |
[0.060] |
[0.042] |
[0.032] |
Member of an ethnic minority |
-0.364*** |
-0.009 |
-0.111*** |
-0.261*** |
-0.758*** |
-0.175*** |
|
[0.009] |
[0.043] |
[0.038] |
[0.059] |
[0.101] |
[0.036] |
Father agricultural worker |
-0.366*** |
|
-0.322*** |
-0.090 |
-0.320*** |
|
|
[0.009] |
|
[0.031] |
[0.056] |
[0.046] |
|
Father primary education |
0.206*** |
0.204*** |
0.103*** |
0.174*** |
0.125* |
0.240*** |
|
[0.011] |
[0.032] |
[0.035] |
[0.069] |
[0.065] |
[0.042] |
Father secondary education |
0.559*** |
0.600*** |
0.420*** |
0.396*** |
0.369*** |
0.456*** |
|
[0.019] |
[0.057] |
[0.058] |
[0.121] |
[0.079] |
[0.049] |
Mother primary education |
0.243*** |
0.220*** |
0.291*** |
0.349*** |
0.303*** |
0.165*** |
|
[0.011] |
[0.033] |
[0.035] |
[0.097] |
[0.063] |
[0.041] |
Mother secondary education |
0.644*** |
0.608*** |
0.634*** |
0.689*** |
0.603*** |
0.486*** |
|
[0.019] |
[0.061] |
[0.059] |
[0.125] |
[0.081] |
[0.051] |
Birth region 2 |
-0.353*** |
0.197*** |
-0.183*** |
-0.195** |
-0.008 |
0.076** |
|
[0.013] |
[0.030] |
[0.030] |
[0.077] |
[0.056] |
[0.033] |
Birth region 3 |
-0.597*** |
0.427*** |
0.133*** |
-0.245*** |
-0.287*** |
0.365*** |
|
[0.015] |
[0.047] |
[0.041] |
[0.070] |
[0.058] |
[0.042] |
Constant |
6.450*** |
12.262*** |
5.084*** |
7.005*** |
5.263*** |
6.709*** |
|
[0.014] |
[0.032] |
[0.034] |
[0.075] |
[0.079] |
[0.038] |
Observations |
50560 |
16575 |
9259 |
4661 |
4127 |
9830 |
R-squared |
0.35 |
0.15 |
0.20 |
0.22 |
0.22 |
0.19 |
Standard errors in parentheses. * significant at 10%; ** significant at 5%; *** significant at 1%. Omitted categories are: male, ethnic majority, father and mother with no or unknown education, and birth region 1 (see Table 2 for the country-specific definitions).
39
Table 7: Inequality of Opportunity Indices for Household Income (per capita)
|
|
BRAZIL |
|
|
COLOMBIA |
|
|
ECUADOR |
|
GUATEMALA |
|
PANAMA |
|
|
PERU |
|
|||
|
E(0) |
E(1) |
E(2) |
E(0) |
E(1) |
E(2) |
E(0) |
E(1) |
E(2) |
E(0) |
E(1) |
E(2) |
E(0) |
E(1) |
E(2) |
E(0) |
E(1) |
E(2) |
|
TOTAL INEQUALITY |
0.695 |
0.710 |
1.595 |
0.559 |
0.626 |
1.377 |
0.417 |
0.452 |
0.828 |
0.619 |
0.683 |
1.722 |
0.630 |
0.609 |
1.085 |
0.557 |
0.635 |
1.642 |
|
|
0.009 |
0.015 |
0.152 |
0.027 |
0.038 |
0.141 |
0.017 |
0.027 |
0.108 |
0.035 |
0.040 |
0.320 |
0.032 |
0.037 |
0.105 |
0.024 |
0.041 |
0.222 |
|
NON PARAMETRIC |
|
|
|
|
|
|
|
|
|
|
|
|
|
|
|
|
|
|
|
ESTIMATES |
|
|
|
|
|
|
|
|
|
|
|
|
|
|
|
|
|
|
|
θN |
0.329 |
0.337 |
0.191 |
0.250 |
0.261 |
0.157 |
0.290 |
0.287 |
0.187 |
0.373 |
0.386 |
0.209 |
0.346 |
0.335 |
0.213 |
0.292 |
0.271 |
0.124 |
|
d |
|||||||||||||||||||
θN |
0.008 |
0.010 |
0.015 |
0.020 |
0.021 |
0.013 |
0.020 |
0.022 |
0.024 |
0.032 |
0.040 |
0.061 |
0.023 |
0.025 |
0.024 |
0.019 |
0.017 |
0.016 |
|
0.329 |
0.319 |
0.416 |
0.250 |
0.287 |
0.397 |
0.290 |
0.315 |
0.421 |
0.373 |
0.419 |
0.587 |
0.346 |
0.322 |
0.304 |
0.292 |
0.337 |
0.418 |
||
r |
|||||||||||||||||||
|
0.008 |
0.014 |
0.054 |
0.020 |
0.033 |
0.068 |
0.020 |
0.026 |
0.047 |
0.032 |
0.035 |
0.079 |
0.023 |
0.037 |
0.098 |
0.019 |
0.033 |
0.125 |
|
PARAMETRIC |
|
|
|
|
|
|
|
|
|
|
|
|
|
|
|
|
|
|
|
ESTIMATES |
|
|
|
|
|
|
|
|
|
|
|
|
|
|
|
|
|
|
|
θP |
0.322 |
0.305 |
0.382 |
0.233 |
0.259 |
0.350 |
0.269 |
0.284 |
0.365 |
0.345 |
0.371 |
0.498 |
0.315 |
0.274 |
0.233 |
0.279 |
0.302 |
0.321 |
|
r |
|||||||||||||||||||
θJ |
0.009 |
0.016 |
0.065 |
0.019 |
0.034 |
0.083 |
0.020 |
0.027 |
0.055 |
0.031 |
0.041 |
0.108 |
0.022 |
0.039 |
0.113 |
0.018 |
0.030 |
0.135 |
|
|
|
|
|
|
|
|
|
|
|
|
|
|
|
|
|
|
|
||
r |
0.086 |
|
|
0 |
|
|
0.022 |
|
|
0.082 |
|
|
0.066 |
|
|
0.044 |
|
|
|
Race |
0.079 |
0.107 |
0 |
0.001 |
0.020 |
0.028 |
0.077 |
0.102 |
0.036 |
0.037 |
0.038 |
0.035 |
|||||||
|
0.003 |
0.004 |
0.016 |
0.002 |
0.002 |
0.004 |
0.004 |
0.004 |
0.006 |
0.012 |
0.011 |
0.014 |
0.009 |
0.006 |
0.007 |
0.008 |
0.008 |
0.026 |
|
Father's |
0.047 |
0.044 |
0.062 |
|
|
|
0.095 |
0.091 |
0.113 |
0.052 |
0.052 |
0.079 |
0.061 |
0.053 |
0.057 |
|
|
|
|
occupation |
|
|
|
|
|
|
|||||||||||||
|
0.002 |
0.003 |
0.011 |
|
|
|
0.010 |
0.013 |
0.026 |
0.011 |
0.012 |
0.019 |
0.011 |
0.013 |
0.035 |
|
|
|
|
Father's |
0.132 |
0.142 |
0.222 |
0.152 |
0.178 |
0.276 |
0.117 |
0.126 |
0.173 |
0.145 |
0.164 |
0.257 |
0.101 |
0.096 |
0.116 |
0.120 |
0.113 |
0.112 |
|
education |
|||||||||||||||||||
|
0.006 |
0.010 |
0.039 |
0.017 |
0.023 |
0.047 |
0.014 |
0.018 |
0.038 |
0.024 |
0.029 |
0.062 |
0.016 |
0.017 |
0.034 |
0.014 |
0.017 |
0.049 |
|
Mother's |
0.145 |
0.156 |
0.244 |
0.153 |
0.179 |
0.278 |
0.154 |
0.167 |
0.227 |
0.203 |
0.225 |
0.341 |
0.163 |
0.154 |
0.159 |
0.172 |
0.184 |
0.249 |
|
education |
|||||||||||||||||||
|
0.006 |
0.008 |
0.034 |
0.017 |
0.023 |
0.048 |
0.014 |
0.020 |
0.044 |
0.023 |
0.031 |
0.081 |
0.020 |
0.028 |
0.070 |
0.016 |
0.020 |
0.048 |
|
Birth region |
0.079 |
0.049 |
0.043 |
0.031 |
0.019 |
0.00 |
0.029 |
0.030 |
0.036 |
0.046 |
0.051 |
0.098 |
0.085 |
0.078 |
0.096 |
0.076 |
0.092 |
0.158 |
|
|
0.005 |
0.007 |
0.024 |
0.012 |
0.019 |
0.046 |
0.010 |
0.015 |
0.035 |
0.015 |
0.018 |
0.041 |
0.015 |
0.017 |
0.036 |
0.011 |
0.016 |
0.045 |
|
Sample: individuals 30-49 with positive income and information on a set of circumstances; standard errors in italics; father’s occupation missing for Colombia and Peru.
40
Table 8: Inequality of Opportunity Indices for Household Consumption Expenditures (per capita)
|
COLOMBIA |
|
|
ECUADOR |
|
GUATEMALA |
|
PANAMA |
|
|
PERU |
|
||||
|
E(0) |
E(1) |
E(2) |
E(0) |
E(1) |
E(2) |
E(0) |
E(1) |
E(2) |
E(0) |
E(1) |
E(2) |
E(0) |
E(1) |
E(2) |
|
TOTAL INEQUALITY |
0.449 |
0.503 |
1.013 |
0.354 |
0.375 |
0.574 |
0.409 |
0.436 |
0.676 |
0.381 |
0.374 |
0.539 |
0.351 |
0.384 |
0.660 |
|
|
0.018 |
0.024 |
0.079 |
0.015 |
0.018 |
0.047 |
0.024 |
0.023 |
0.039 |
0.016 |
0.019 |
0.042 |
0.015 |
0.022 |
0.076 |
|
NON PARAMETRIC |
|
|
|
|
|
|
|
|
|
|
|
|
|
|
|
|
ESTIMATES |
|
|
|
|
|
|
|
|
|
|
|
|
|
|
|
|
θN |
0.265 |
0.275 |
0.177 |
0.344 |
0.347 |
0.270 |
0.524 |
0.536 |
0.440 |
0.417 |
0.385 |
0.285 |
0.348 |
0.339 |
0.229 |
|
d |
||||||||||||||||
θN |
0.017 |
0.017 |
0.013 |
0.021 |
0.025 |
0.028 |
0.023 |
0.026 |
0.031 |
0.016 |
0.018 |
0.020 |
0.017 |
0.017 |
0.016 |
|
0.265 |
0.304 |
0.456 |
0.344 |
0.353 |
0.427 |
0.524 |
0.542 |
0.630 |
0.417 |
0.405 |
0.475 |
0.348 |
0.389 |
0.533 |
||
r |
||||||||||||||||
|
0.017 |
0.023 |
0.035 |
0.021 |
0.024 |
0.033 |
0.023 |
0.023 |
0.022 |
0.016 |
0.024 |
0.044 |
0.017 |
0.024 |
0.040 |
|
PARAMETRIC |
|
|
|
|
|
|
|
|
|
|
|
|
|
|
|
|
ESTIMATES |
|
|
|
|
|
|
|
|
|
|
|
|
|
|
|
|
θP |
0.244 |
0.271 |
0.408 |
0.321 |
0.326 |
0.389 |
0.503 |
0.519 |
0.606 |
0.386 |
0.362 |
0.417 |
0.340 |
0.375 |
0.512 |
|
r |
||||||||||||||||
θJ |
0.017 |
0.023 |
0.041 |
0.022 |
0.028 |
0.042 |
0.020 |
0.020 |
0.021 |
0.016 |
0.023 |
0.046 |
0.017 |
0.022 |
0.036 |
|
|
|
|
|
|
|
|
|
|
|
|
|
|
|
|
||
r |
|
|
|
|
|
|
|
|
|
|
|
|
|
|
|
|
Race |
0.001 |
0.001 |
0.002 |
0.032 |
0.027 |
0.036 |
0.141 |
0.123 |
0.136 |
0.121 |
0.065 |
0.047 |
0.054 |
0.051 |
0.065 |
|
|
0.002 |
0.002 |
0.003 |
0.006 |
0.005 |
0.006 |
0.013 |
0.011 |
0.013 |
0.014 |
0.012 |
0.016 |
0.008 |
0.007 |
0.008 |
|
Father's occupation |
|
|
|
0.106 |
0.103 |
0.120 |
0.073 |
0.071 |
0.088 |
0.071 |
0.069 |
0.090 |
|
|
|
|
|
|
|
|
0.010 |
0.011 |
0.018 |
0.011 |
0.011 |
0.015 |
0.011 |
0.010 |
0.013 |
|
|
|
|
Father's education |
0.154 |
0.179 |
0.288 |
0.141 |
0.148 |
0.192 |
0.202 |
0.219 |
0.285 |
0.108 |
0.109 |
0.146 |
0.142 |
0.147 |
0.199 |
|
|
0.016 |
0.019 |
0.028 |
0.015 |
0.019 |
0.032 |
0.021 |
0.021 |
0.027 |
0.014 |
0.016 |
0.023 |
0.013 |
0.014 |
0.019 |
|
Mother's education |
0.166 |
0.194 |
0.314 |
0.186 |
0.193 |
0.244 |
0.256 |
0.279 |
0.353 |
0.167 |
0.177 |
0.241 |
0.204 |
0.222 |
0.306 |
|
|
0.014 |
0.018 |
0.028 |
0.015 |
0.019 |
0.032 |
0.019 |
0.021 |
0.028 |
0.017 |
0.020 |
0.029 |
0.014 |
0.017 |
0.025 |
|
Birth region |
0.040 |
0.032 |
0.035 |
0.040 |
0.044 |
0.058 |
0.102 |
0.103 |
0.137 |
0.096 |
0.096 |
0.127 |
0.109 |
0.124 |
0.195 |
|
|
0.011 |
0.016 |
0.033 |
0.010 |
0.014 |
0.025 |
0.014 |
0.015 |
0.020 |
0.015 |
0.016 |
0.023 |
0.013 |
0.019 |
0.038 |
|
Sample: individuals 30-49 with positive household consumption and information on a set of circumstances; standard errors in italics; father’s occupation is missing for Colombia and Peru.
41

Table 9: Reduced-Form OLS Regression of Household Income on Observed Circumstances
|
BRAZIL |
COLOMBIA |
ECUADOR |
GUATEMALA |
PANAMA |
PERU |
Member of an ethnic minority |
-0.414*** |
-0.015 |
-0.236*** |
-0.350*** |
-0.922*** |
-0.230*** |
|
[0.009] |
[0.032] |
[0.025] |
[0.036] |
[0.057] |
[0.023] |
Father agricultural worker |
-0.295*** |
|
-0.291*** |
-0.192*** |
-0.210*** |
|
|
[0.009] |
|
[0.019] |
[0.034] |
[0.032] |
|
Father primary education |
0.248*** |
0.218*** |
0.135*** |
0.166*** |
0.211*** |
0.189*** |
|
[0.010] |
[0.022] |
[0.021] |
[0.041] |
[0.044] |
[0.026] |
Father secondary education |
0.696*** |
0.689*** |
0.446*** |
0.386*** |
0.473*** |
0.442*** |
|
[0.018] |
[0.039] |
[0.035] |
[0.080] |
[0.057] |
[0.031] |
Mother primary education |
0.299*** |
0.245*** |
0.254*** |
0.362*** |
0.298*** |
0.215*** |
|
[0.010] |
[0.023] |
[0.021] |
[0.058] |
[0.043] |
[0.026] |
Mother secondary education |
0.789*** |
0.703*** |
0.630*** |
0.893*** |
0.768*** |
0.572*** |
|
[0.018] |
[0.039] |
[0.035] |
[0.082] |
[0.059] |
[0.034] |
Birth region 2 |
-0.378*** |
0.176*** |
-0.124*** |
-0.278*** |
-0.044 |
0.058*** |
|
[0.012] |
[0.022] |
[0.018] |
[0.051] |
[0.043] |
[0.021] |
Birth region 3 |
-0.740*** |
0.460*** |
0.170*** |
-0.258*** |
-0.361*** |
0.376*** |
|
[0.013] |
[0.028] |
[0.025] |
[0.045] |
[0.042] |
[0.030] |
Constant |
5.372*** |
11.578*** |
4.415*** |
5.857*** |
6.977*** |
5.786*** |
|
[0.013] |
[0.022] |
[0.020] |
[0.046] |
[0.053] |
[0.023] |
Observations |
71,670 |
22,436 |
12,643 |
6,847 |
5,649 |
13,649 |
R-squared |
0.32 |
0.19 |
0.24 |
0.28 |
0.34 |
0.25 |
Standard errors in brackets. * significant at 10%; ** significant at 5%; *** significant at 1%. Omitted categories are: male, ethnic majority, father and mother with no or unknown education, and birth region 1 (see Table 2 for the country-specific definitions).
42

Table 10: Reduced-Form OLS Regression of Household Consumption Expenditures on Observed Circumstances
|
COLOMBIA |
ECUADOR |
GUATEMALA |
PANAMA |
PERU |
Member of an ethnic minority |
-0.043 |
-0.300*** |
-0.411*** |
-1.020*** |
-0.195*** |
|
[0.028] |
[0.023] |
[0.025] |
[0.039] |
[0.017] |
Father agricultural worker |
|
-0.254*** |
-0.190*** |
-0.202*** |
|
|
|
[0.017] |
[0.023] |
[0.023] |
|
Father primary education |
0.196*** |
0.159*** |
0.130*** |
0.171*** |
0.145*** |
|
[0.019] |
[0.018] |
[0.031] |
[0.031] |
[0.019] |
Father secondary education |
0.615*** |
0.470*** |
0.472*** |
0.368*** |
0.364*** |
|
[0.031] |
[0.032] |
[0.046] |
[0.042] |
[0.022] |
Mother primary education |
0.234*** |
0.275*** |
0.374*** |
0.189*** |
0.196*** |
|
[0.019] |
[0.018] |
[0.038] |
[0.030] |
[0.019] |
Mother secondary education |
0.693*** |
0.672*** |
0.725*** |
0.554*** |
0.498*** |
|
[0.033] |
[0.031] |
[0.052] |
[0.043] |
[0.025] |
Birth region 2 |
0.202*** |
-0.094*** |
-0.416*** |
-0.028 |
0.051*** |
|
[0.018] |
[0.016] |
[0.033] |
[0.032] |
[0.016] |
Birth region 3 |
0.454*** |
0.215*** |
-0.283*** |
-0.257*** |
0.411*** |
|
[0.023] |
[0.022] |
[0.028] |
[0.030] |
[0.023] |
Constant |
14.216*** |
3.964*** |
8.520*** |
6.990*** |
5.877*** |
|
[0.020] |
[0.018] |
[0.029] |
[0.039] |
[0.017] |
Observations |
22,487 |
12,643 |
6,865 |
5,686 |
13,649 |
R-squared |
0.22 |
0.31 |
0.47 |
0.42 |
0.31 |
Standard errors in brackets. * significant at 10%; ** significant at 5%; *** significant at 1%. Omitted categories are: male, ethnic majority, father and mother with no or unknown education, and birth region 1 (see Table 2 for the country-specific definitions).
43

Table 11: Opportunity-deprivation profiles
|
BRAZIL |
COLOMBIA |
ECUADOR |
GUATEMALA |
PANAMA |
PERU |
Member of ethnic minority |
100.0 |
32.8 |
61.0 |
100.0 |
75.9 |
100.0 |
Father's agricultural |
87.9 |
|
93.4 |
99.9 |
83.5 |
|
occupation |
|
|
|
|
|
|
Other father's occupation |
12.1 |
|
6.6 |
0.1 |
16.5 |
|
Father without education |
89.2 |
76.6 |
86.9 |
99.4 |
58.0 |
99.8 |
Father's primary education |
10.5 |
23.4 |
11.2 |
0.3 |
37.0 |
0.2 |
Father's secondary education |
0.3 |
0.0 |
1.9 |
0.3 |
5.0 |
0.0 |
(or complete primary) |
|
|
|
|
|
|
Mother without education |
90.7 |
96.0 |
98.3 |
99.1 |
92.6 |
99.4 |
Mother's primary education |
9.3 |
3.8 |
1.1 |
0.3 |
5.7 |
0.0 |
Mother's secondary education |
0.0 |
0.2 |
0.6 |
0.6 |
1.7 |
0.6 |
(or complete primary) |
|
|
|
|
|
|
Birth regions |
Northeast |
Periphery |
Coast and |
North and |
Rural |
South |
|
and North |
(99%) |
insular |
Northwest |
areas |
and |
|
(100%) |
|
(51%), |
(99%) |
(96%) |
Coast |
|
|
|
Sierra and |
|
|
(58%), |
|
|
|
Amazonia |
|
|
inland |
|
|
|
(48%) |
|
|
(42%) |
Share of total outcome |
2.9 |
5.0 |
4.4 |
3.5 |
2.7 |
4.8 |
44

Table 12: Poverty profiles
|
BRAZIL |
COLOMBIA |
ECUADOR |
GUATEMALA |
PANAMA |
PERU |
Member of ethnic minority |
68.5 |
14.9 |
31.8 |
70.2 |
53.7 |
56.4 |
Father's agricultural |
56.3 |
|
80.0 |
75.7 |
80.3 |
|
occupation |
|
|
|
|
|
|
Other father's occupation |
43.7 |
|
20.0 |
24.3 |
19.7 |
|
Father without education |
77.2 |
57.8 |
55.0 |
90.1 |
66.8 |
59.9 |
Father's primary education |
21.8 |
40.3 |
42.2 |
9.0 |
29.0 |
31.8 |
Father's secondary education |
|
|
|
|
|
|
(or complete primary) |
1.0 |
1.9 |
2.8 |
0.9 |
4.2 |
8.3 |
Mother without education |
79.4 |
53.5 |
59.7 |
96.3 |
75.2 |
82.5 |
Mother's primary education |
19.4 |
44.6 |
38.5 |
3.0 |
23.7 |
15.4 |
Mother's secondary education |
1.1 |
1.9 |
1.8 |
0.7 |
1.1 |
2.2 |
(or complete primary) |
|
|
|
|
|
|
Birth regions |
Northeast |
Periphery |
Sierra and |
North and |
Rural |
Inland |
|
and North |
(65%), |
Amazonia |
Northwest |
areas |
(59%), |
|
(70%), |
Center |
(48%), |
(49%), South |
(91%), |
South and |
|
Southeast, |
(34%) |
Coast and |
and Center |
small |
Coast |
|
Center- |
|
insular |
(46%) |
towns |
(40%) |
|
west, South |
|
(45%) |
|
(5%) |
|
|
(28%) |
|
|
|
|
|
Share of total outcome |
0.7 |
1.5 |
1.9 |
1.8 |
1.5 |
1.8 |
45
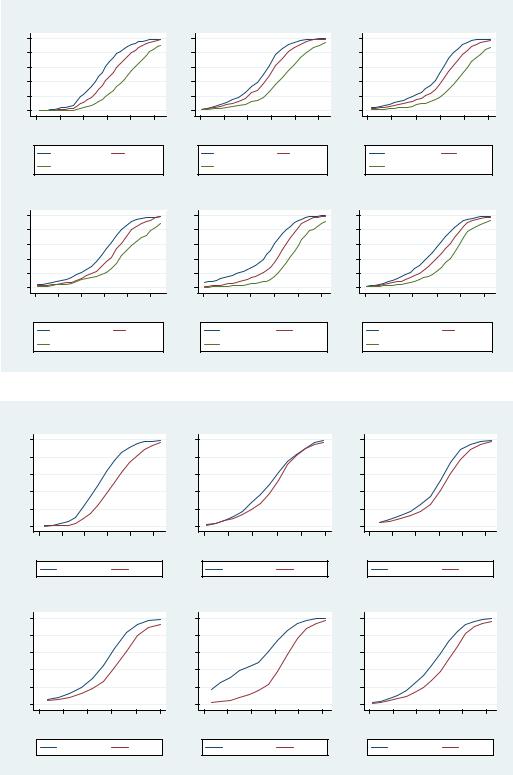
Figure 1: The distribution of earnings conditional on selected circumstance variables
a. By mother’s education
Brazil |
|
|
|
Colombia |
|
|
|
Ecuador |
|
|
1 |
|
|
1 |
|
|
|
1 |
|
|
|
.8 |
|
|
.8 |
|
|
|
.8 |
|
|
|
.6 |
|
|
.6 |
|
|
|
.6 |
|
|
|
.4 |
|
|
.4 |
|
|
|
.4 |
|
|
|
.2 |
|
|
.2 |
|
|
|
.2 |
|
|
|
0 |
|
|
0 |
|
|
|
0 |
|
|
|
-3 -2 -1 0 |
1 |
2 |
-3 |
-2 -1 0 |
1 |
2 |
-3 |
-2 -1 0 |
1 |
2 |
earnings |
|
|
|
earnings |
|
|
|
earnings |
|
|
none |
grades 1-4 |
|
none |
incomplete |
|
none |
primary |
|||
grade 5 & more |
|
|
|
primary complete |
|
|
|
secondary |
|
|
Guatemala |
|
|
Panama |
|
|
|
Peru |
|
|
|
1 |
|
|
1 |
|
|
|
1 |
|
|
|
.8 |
|
|
.8 |
|
|
|
.8 |
|
|
|
.6 |
|
|
.6 |
|
|
|
.6 |
|
|
|
.4 |
|
|
.4 |
|
|
|
.4 |
|
|
|
.2 |
|
|
.2 |
|
|
|
.2 |
|
|
|
0 |
|
|
0 |
|
|
|
0 |
|
|
|
-3 -2 -1 0 |
1 |
2 |
-3 |
-2 -1 0 |
1 |
2 |
-3 |
-2 -1 0 |
1 |
2 |
earnings |
|
|
|
earnings |
|
|
|
earnings |
|
|
none |
incomplete |
|
none |
primary |
|
none |
incomplete |
|||
primary complete |
|
|
|
secondary |
|
|
|
primary complete |
|
|
b. By ethnicity
|
Brazil |
|
|
|
|
Colombia |
|
|
|
Ecuador |
|
|
1 |
|
|
|
|
1 |
|
|
|
1 |
|
|
|
.8 |
|
|
|
|
.8 |
|
|
|
.8 |
|
|
|
.6 |
|
|
|
|
.6 |
|
|
|
.6 |
|
|
|
.4 |
|
|
|
|
.4 |
|
|
|
.4 |
|
|
|
.2 |
|
|
|
|
.2 |
|
|
|
.2 |
|
|
|
0 |
|
|
|
|
0 |
|
|
|
0 |
|
|
|
-3 |
-2 -1 0 |
1 |
|
2 |
-3 |
-2 -1 0 |
1 |
2 |
-3 |
-2 -1 0 |
1 |
2 |
|
earnings |
|
|
|
|
earnings |
|
|
|
earnings |
|
|
|
minority |
|
others |
|
minority |
others |
|
minority |
|
others |
||
|
Guatemala |
|
|
|
Panama |
|
|
|
Peru |
|
|
|
1 |
|
|
|
|
1 |
|
|
|
1 |
|
|
|
.8 |
|
|
|
|
.8 |
|
|
|
.8 |
|
|
|
.6 |
|
|
|
|
.6 |
|
|
|
.6 |
|
|
|
.4 |
|
|
|
|
.4 |
|
|
|
.4 |
|
|
|
.2 |
|
|
|
|
.2 |
|
|
|
.2 |
|
|
|
0 |
|
|
|
|
0 |
|
|
|
0 |
|
|
|
-3 |
-2 -1 0 |
|
1 |
2 |
-3 |
-2 -1 0 |
1 |
2 |
-3 |
-2 -1 0 |
1 |
2 |
|
earnings |
|
|
|
|
earnings |
|
|
|
earnings |
|
|
|
minority |
|
others |
|
minority |
others |
|
minority |
|
others |
||
46
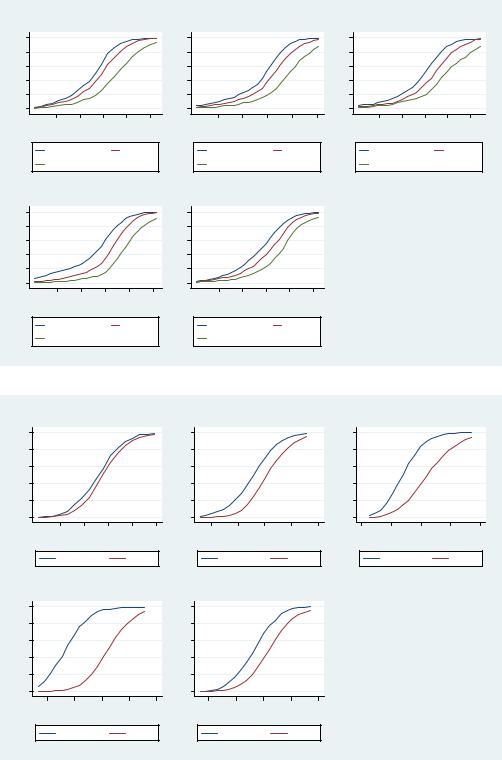
Figure 2: The distribution of consumption conditional on selected circumstance variables
a. By mother’s education
Colombia |
|
|
Ecuador |
|
|
Guatemala |
|
|
1 |
|
|
1 |
|
|
1 |
|
|
.8 |
|
|
.8 |
|
|
.8 |
|
|
.6 |
|
|
.6 |
|
|
.6 |
|
|
.4 |
|
|
.4 |
|
|
.4 |
|
|
.2 |
|
|
.2 |
|
|
.2 |
|
|
0 |
|
|
0 |
|
|
0 |
|
|
-2 -1 0 |
1 |
2 |
-2 -1 0 |
1 |
2 |
-2 -1 0 |
1 |
2 |
consumption |
|
|
consumption |
|
|
consumption |
|
|
none |
incomplete |
none |
incomplete |
none |
incomplete |
|||
primary complete |
|
|
primary complete |
|
|
primary complete |
|
|
Panama |
|
|
Peru |
|
|
|
|
|
1 |
|
|
1 |
|
|
|
|
|
.8 |
|
|
.8 |
|
|
|
|
|
.6 |
|
|
.6 |
|
|
|
|
|
.4 |
|
|
.4 |
|
|
|
|
|
.2 |
|
|
.2 |
|
|
|
|
|
0 |
|
|
0 |
|
|
|
|
|
-2 -1 0 |
1 |
2 |
-2 -1 0 |
1 |
2 |
|
|
|
consumption |
|
|
consumption |
|
|
|
|
|
none |
incomplete |
none |
incomplete |
|
|
|
||
primary complete |
|
|
primary complete |
|
|
|
|
|
b. By ethnicity
Colombia |
|
|
Ecuador |
|
|
|
Guatemala |
|
||
1 |
|
|
1 |
|
|
1 |
|
|
|
|
.8 |
|
|
.8 |
|
|
.8 |
|
|
|
|
.6 |
|
|
.6 |
|
|
.6 |
|
|
|
|
.4 |
|
|
.4 |
|
|
.4 |
|
|
|
|
.2 |
|
|
.2 |
|
|
.2 |
|
|
|
|
0 |
|
|
0 |
|
|
0 |
|
|
|
|
-2 -1 0 |
1 |
2 |
-2 -1 0 |
1 |
2 |
-2 |
-1 |
0 |
1 |
2 |
consumption |
|
|
consumption |
|
|
|
consumption |
|
||
minority |
others |
minority |
|
others |
|
minority |
|
|
others |
|
Panama |
|
|
Peru |
|
|
|
|
|
|
|
1 |
|
|
1 |
|
|
|
|
|
|
|
.8 |
|
|
.8 |
|
|
|
|
|
|
|
.6 |
|
|
.6 |
|
|
|
|
|
|
|
.4 |
|
|
.4 |
|
|
|
|
|
|
|
.2 |
|
|
.2 |
|
|
|
|
|
|
|
0 |
|
|
0 |
|
|
|
|
|
|
|
-2 -1 0 |
1 |
2 |
-2 -1 0 |
1 |
2 |
|
|
|
|
|
consumption |
|
|
consumption |
|
|
|
|
|
|
|
minority |
others |
minority |
|
others |
|
|
|
|
|
|
47
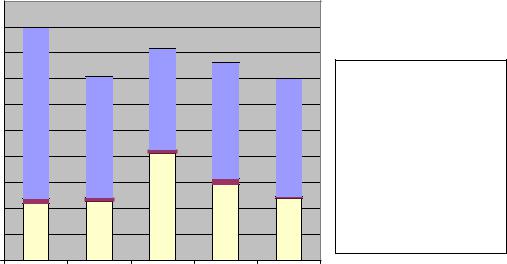
Figure 3: A visual representation of the opportunity share of inequality
Per capita household consumption
Total inequality and levels of inequality of opportunity
|
0,500 |
|
|
|
|
|
0,450 |
|
|
|
|
|
0,400 |
|
|
|
|
indices |
0,350 |
|
|
|
|
0,300 |
|
|
|
|
|
0,250 |
|
|
|
|
|
E(0) |
0,200 |
|
|
|
|
|
|
|
|
|
|
|
0,150 |
|
|
|
|
|
0,100 |
|
|
|
|
|
0,050 |
|
|
|
|
|
0,000 |
|
|
|
|
|
COL |
ECU |
GUA |
PAN |
PER |

 Total inequality

 Inequality of opportunity (difference between nonparametric and parametric estimates)

 Inequality of opportunity (parametric estimate)
48