

the role of endowment
.pdfCa nAfrica Export M a nu fa ctu res? The Role of Endow m ent, Excha ng e Ra tes a nd
Tra nsa ctionCosts
Ibrahim A. Elbadawi
Development Research Group and Africa Region, World Bank
Washington, DC 20433, USA e-mail: ielbadawi@worldbank.org
An earlier version of this paper was presented at the AERC/OECD/IMF workshop on "Policies for Competitiveness in Manufacturing in Sub-Saharan Africa", Johannesburg, South Africa, November 6-7, 1998. I would like to acknowledge, without implication, helpful comments from Mustapha Nabli and other participants at the workshop. The author would like to acknowledge the research assistance by John Randa and Rajal Upadhyaya.
1

1.Introduction
The marginalization of Sub-Saharan Africa (hereafter Africa) in world trade, especially the global market for manufactured exports, has provided one of the most visible manifestations of the multi-faceted development failures of the Sub-Continent over the last thirty years or so. Moreover, the lessons from recent development success stories suggest that they have either been facilitated by export-orientation (e.g. Korea and Taiwan) or have in fact been export-led (e.g. Chile, Mauritius, Tunisia and South East Asia)1. Therefore, it is not surprising that current academic and policy debates on Africa’s development have been preoccupied with addressing the key question about how might Africa be able to build a strong comparative advantage in exports, especially exports of labor-intensive manufactures?2. More recent research has focused on the impact on Africa’s comparative advantage in manufactured exports of globalization of trade and capital markets3; and of the role of endowment, location and geography4. This new research and more importantly the changing landscape of global trade and international finance have pushed the debate towards more strategic issues such as: can Africa ever hope to have comparative advantage in manufactured exports?; can globalization facilitate (if not partially substitute for) traditional and usually complex strategies for achieving export-led economic transformation?; or is there a scope for poor African countries to jump-start their competitiveness through the “old –fashioned way”of sustained real currency depreciation in a world of capital market integration?
Export performance in many African countries has been responsive to macroeconomic reforms--especially to the deep real exchange rate depreciation in the 1980s in Anglophone Africa and since 1994 in the CFA zone of Francophone Africa. However, given the partiality of reforms and the frequent adverse terms of trade shocks that have impacted the region, observed growth patterns in aggregate exports, and especially in manufactured exports, have been neither deep nor stable (e.g. Rodrik, 1997). Even as Africa is still working on regaining its lost ground in the international market for traditional exports, there is a broad consensus that the ultimate goal of export-orientation in Africa should be to achieve significant export diversification, through building new comparative advantages in non-traditional exports, including labor-intensive manufactured exports. Manufactured exports as well as some other non-traditional exports, are more capable than traditional primary exports in supporting sustained overall economic growth for at least three reasons. First, compared to primary goods exports, manufactured exports are likely to grow faster when the global economy is expanding because their income elasticity of demand is higher. Second, due to the relatively higher price elasticities of demand and supply for manufactures compared to primary goods exports, the former are less susceptible to price variability. Third, the prospects for dynamic productivity gains are much higher in the manufacturing sector. Therefore, in the medium to longer runs the role of traditional primary exports should be to facilitate export diversification. However, in the short-run Africa should continue to consolidate recently achieved gains by avoiding economy-wide indirect taxation of traditional exports. For financing the process of export
1Perhaps unlike many other recent successful development experiences, Rodrik (1994,95) shows that even though export-orientation has facilitated the sustenance of high investment productivity in Korea and Taiwan for decades, both overall growth as well as the phenomenal export expansions in these two countries have been driven by sustained investment booms.
2See for example World Bank, 1998a,b; Elbadawi, 1998; Sekkat and Varoudakis, 1998.
3For example, Collier, 1997; Elbadawi and Helleiner, 1998; and World Bank, 1998a.
4For example, Wood, 1997; Wood and Berge, 1997; Wood and Owens, 1997; and Wood and Mayer, 1998.
2

diversification, only moderate and sector-specific taxes should be imposed.
Against this background, this paper contributes to this debate by estimating manufactured exports performance for a panel of African and other developing countries, taking into consideration endowment and geography and the potential effect of globalization. In particular, I will use the empirical model to assess the implications of three views on this issue. First, Adrian Wood and his research associates use a version of Hecksher-Ohlin model to argue that, under globalization, human capital and natural resource endowment rather than labor and capita are the main determinants of comparative advantage for manufactured exports. I call this view the endowment theory. This theory predicts that Africa basically has no prospects in manufactured exports because of its high natural resource endowment and low stock of human capital. Paul Collier uses a modified Hecksher-Ohlin framework and argues that Wood’s prediction could only be valid if Africa is affected by a massive Dutch Disease problem because of its richness in natural resources, which however, is not supported by evidence (Collier, 1997). Instead, Collier develops an alternative theory (I call the transaction theory), which argues that because manufacturing is one of the most transaction-intensive activities, Africa’s comparative disadvantage (at least in the short-to-medium runs) has been caused by high transaction costs due to poor policy environment. Following his critique of the endowment theory, Collier proposes a strategy for building Africa’s comparative advantage, based on increased integration of African economies into global world trade, capital and risk-bearing markets. Finally, Gerry Helleiner and I argue that given Africa's current levels of development, comparative advantage in exports should be based on sustained real exchange rate competitiveness, until the economies are sufficiently developed to support a productivity-induced secular process of real appreciation (Elbadawi and Helleiner, 1998). This real exchange rate-led strategy also recognizes the dire need for re-capitalization of African economies to sustain the process of export expansion and export diversification, as has been convincingly argued by Collier (1997). However, Helleiner and I also argue that to protect macroeconomic competitiveness as well as to avoid possible future financial and currency crises, flexible and pragmatic approaches for integrating Africa into global capital markets may have to be adopted.
Section 2 provides preliminary country-specific and regional analysis of the evolution of manufactured exports and some of the key relevant variables over the 1980s and 1990s. Section 3 contains a discussion of the estimation results, including an assessment of the implications of the three views discussed above. The model of section 3 estimates the determinants of manufactured exports/GDP using a panel covering about 41 countries over the period 198095. The analysis of section 3 does not however, directly test the above views, since I estimate performance equations based on the ratio of manufactured exports to GDP, rather than comparative advantage equations using, for example, the share of manufactured to aggregate exports as the dependent variable5. Section 4 concludes.
2.Manufactured Exports in Africa and Other Developing Regions
Manufactured export performance between 1980s and 1990s (1994/95 relative to 1984/85) has varied considerably across eleven countries drawn from three developing regions, seven of which are Sub-Saharan African countries (Table 1.A)6. The best performers in terms of the
5 For a detailed discussion and direct testing of the three views, see Elbadawi and Randa (1999).
6In addition to the North African country of Tunisia, the other seven African countries are: Burkina Faso, Cote d'Ivoire,
3

growth rates of manufactured export (MNEX) to GDP between the two periods are: Kenya (14%), Tanzania (10.6%), Burkina Faso (9.5%) and South Africa (8.1%). If we take the share of MNEX to GDP into account, the growth rates of Mauritius at 7.7% was impressive, given that the share of MNEX in its economy is more than 27%. To a lesser extent, the same assessment applies to Kenya and South Africa, for which the shares of MNEX to GDP are 6.5 and 8.6%, respectively. The second category consists of Burkina Faso and Tanzania, which achieved relatively high rates of MNEX growth, though starting from low shares of MNEX to GDP (at respectively, 2.2 and 1.3% in 1994/95). The third category consists of Cote d’Ivoire and Zimbabwe, which experienced less than 5% rates of growth in MNEX, though they have had relatively low to moderate shares of MNEX to GDP (at 5.7 and 9.9%, respectively). As the Table makes clear, except for Mauritius, all other Sub-Saharan African countries have much lower share of MNEX compared to world class performers such as Tunisia, Indonesia, Thailand, and especially Malaysia7. Moreover, all the African countries experienced lower growth rates in MNEX than the three Asian countries. Therefore, assuming that manufactured exports-- especially labor-intensive manufactured exports--are likely to be the most efficient engine of growth for Africa as it have been for other successful developing countries, African countries do not only need to significantly raise growth rates of MNEX, but they would also need to sustain them for a considerable time.
For the remainder of this section, I briefly review the extent to which MNEX performances of various countries in the sample were covariated with four sets of determinants: exchange rate policy, transaction costs, stock of skills relative to natural resource endowment, and aggregate investment (Table 1.B). The first three correspond to the three strategies discussed in the introduction to this paper, while the latter is associated with overall economic performance, including manufactured export growth. In fact Rodrik (1999) argues that the phenomenal expansions of exports in Korea and Taiwan were made possible by sustained rise in private returns to capital, engineered by the two governments through a range of strategic interventions--which include investment subsidies, administrative guidance, and the use of public enterprise. He also echoes this theme in his recent explanation of Africa’s marginalization in world trade, though he does not suggest that Africa should pursue similar strategies to those adopted by the two successful Asian countries (Rodrik, 1997).
First, I analyze the evidence on the relationship between exchange rate policy and MNEX performance. Figure 1 depicts average MNEX/GDP ratios during 1990-95 for several countries together with indexes of real exchange rate (RER), RER misalignment (RERMIS) (measured as undervaluation relative to an equilibrium level ERER) and RER variability (see notes to Figure 1).
The figure suggests three important patterns. First, Indonesia, Thailand, Tunisia, Republic of Korea, Mauritius, Malaysia constitute a group of six countries that have managed to maintain large MNEX relative to the share of their economies (ranging from about 12% of GDP for Indonesia to 63% for Malaysia). Relative to other countries, these countries were also the ones
Kenya, Mauritius, South Africa, Tanzania and Zimbabwe. The other three non-African countries are Indonesia, Malaysia and Thailand.
7 Until the recent financial crisis, the three Asian countries rank among the most accomplished exporting economies in the world.
4

with uniformly more stable RER. Among the countries with lower than 10% MNEX/GDP ratios only Chile and South Africa have achieved high degree of RER stability. Second, there is a tendency for national real currencies to become stronger (more appreciated) as the share of MNEX/GDP reached 20% or more, as in the cases of Thailand, Tunisia, Republic of Korea, Mauritius and Malaysia. However, there is no clear pattern of appreciating RER as MNEX/GDP rises from the miniscule levels of less than 1% (for the cases of Nigeria, Gabon and Ghana) to about 10% for the case of Indonesia. However, this pattern may not be generalizable, given the presence of many CFA African countries in the sample. These are the members of the CFA monetary union, which adopts a fixed exchange rate system vis-à-vis the French franc8. Third, again may be due to the same reason there is no evidence of a tendency for real exchange rates to become more overvalued (or undervalued) as the share of MNEX/GDP rises.
Second, I consider the relationship between MNEX with aggregate investment. Notwithstanding efficiency consideration, the share of gross investment to GDP is a useful broad indicator of an economy's potential to sustain high rates of export (as well as overall economic) growth9. On this score most of the African countries are badly lagging behind. Except for Mauritius -which has investment ratios at 29 - virtually all remaining African countries have investment rates lower than 25%.
Table 1.A : MANUFACTURING EXPORTS IN A SAMPLE OF DEVELOPING COUNTRIES
|
|
Aggregate |
Manufacturing |
% Share |
% Share of |
|
|
|
Exports |
Exports |
of Total |
Manufacturing |
|
|
|
Current US |
Current US $m |
Exports |
Exports to |
|
|
|
$m |
|
to GDP |
GDP |
|
|
|
|
|
|
|
|
Burkina |
1994/1995 Average |
274.95 |
45.90 |
13.10 |
2.19 |
|
Faso |
|
|
|
|
|
|
Average Annual Growth |
8.56 |
18.99 |
1.27 |
9.46 |
||
|
||||||
|
Rate 84-95 (%) |
|
|
|
|
|
|
|
|
|
|
|
|
Cote |
1994/1995 Average |
3699.85 |
494.59 |
42.02 |
5.65 |
|
d’Ivoire |
|
|
|
|
|
|
Growth Rate 84-95 (%) |
3.22 |
8.20 |
0.34 |
4.7 |
||
|
||||||
|
|
|
|
|
|
|
Kenya |
1994/1995 Average |
2815.06 |
432.17 |
36.08 |
6.5 |
|
|
|
|
|
|
|
|
|
Growth Rate 84-95 (%) |
6.07 |
12.62 |
3.60 |
14.09 |
|
|
|
|
|
|
|
|
Mauritius |
1994/1995 Average |
2179.55 |
1013.45 |
58.41 |
27.18 |
|
|
|
|
|
|
|
|
|
Growth Rate 84-95 (%) |
15.96 |
22.76 |
2.01 |
7.67 |
|
|
|
|
|
|
|
|
S. Africa |
1994/1995 Average |
31122.29 |
11018.56 |
24.34 |
8.6 |
|
|
|
|
|
|
|
|
|
Growth Rate 84-95 (%) |
5.46 |
12.42 |
0.16 |
8.07 |
|
|
|
|
|
|
|
8These countries (Gabon, Togo, Cameroon, Burkina Faso, Cote d’Ivoire, Central African Republic and Senegal) have experienced substantial real appreciation as well RER overvaluation for most of the period since 1985 (Baffes, Elbadawi and O’Connell, 1997).
9 According to robust evidence drawn from a vast set of developing countries, a 6% real GDP growth rate would require about 28% rate of investment (Williamson, 1997a).
5
Tanzania |
1994/1995 Average |
898.37 |
45.87 |
19.51 |
1.31 |
|
|
|
|
|
|
|
Growth Rate 84-95 (%) |
15.04 |
3.00 |
16.55 |
10.59 |
|
|
|
|
|
|
Zimbabwe |
1994/1995 Average |
2677.20 |
615.66 |
26.35 |
9.88 |
|
|
|
|
|
|
|
Growth Rate 84-95 (%) |
7.86 |
431 |
4.57 |
4.76 |
|
|
|
|
|
|
Tunisia |
1994/1995 Average |
3475.29 |
3910.92 |
44.76 |
23.19 |
|
|||||
|
|
|
|
|
|
|
Growth Rate 84-95 (%) |
18.06 |
18.06 |
3.14 |
9.87 |
|
|
|
|
|
|
Korea |
1994/1995 Average |
132762.61 |
101757.8 |
31.58 |
24.23 |
Rep. |
|||||
|
Growth Rate 84-95 (%) |
15.61 |
14.68 |
-0.47 |
-1.27 |
|
|
|
|
|
|
Malaysia |
1994/1995 Average |
72462.51 |
49200.77 |
92.59 |
62.89 |
|
|
|
|
|
|
|
Growth Rate 84-95 %) |
15.13 |
26.36 |
5.36 |
16.11 |
|
|
|
|
|
|
Thailand |
1994/1995 Average |
62558.62 |
36892.33 |
40.05 |
23.63 |
|
|
|
|
|
|
|
Growth Rate 84-95 (%) |
20.78 |
29.93 |
6.14 |
14.30 |
|
|
|
|
|
|
Indonesia |
1994/1995 Average |
49849.55 |
21825.38 |
26.37 |
11.55 |
|
|
|
|
|
|
|
Growth Rate 84-95 (%) |
8.65 |
24.34 |
0.41 |
15.75 |
|
|
|
|
|
|
Notes:
1. Exports of goods and services represent the value of all goods and other market services provided to the world. Included is the value of merchandise, freight, insurance, travel, and other non-factor services
2.Manufactures comprise commodities in SITC revision 1, sections 5 through 9 (chemicals and related products, basic manufactures, machinery and transport equipment, other manufactured articles and goods not elsewhere classified) excluding division 68 (non-ferrous metals)
3. The Growth Rate 84-95(%) refers to percentage annual average growth rate between 1984-1995
6
TABLE 1.B : OTHER DETERMINANTS IN A SAMPLE OF DEVELOPING COUNTRIES
|
|
Ratio of Gross |
Ratio of School |
Fax |
Corruption |
Roads |
|
|
Domestic |
Enrollment to |
Machines |
|
Paved (%) |
|
|
Investment to |
Land per worker |
(per 1000 |
|
|
|
|
GDP* |
|
people) |
|
|
|
|
|
|
|
|
|
Burkina Faso |
1994/1995 Average |
20.87 |
0.61 |
_ |
4 |
17.35 |
|
|
|
|
|||
|
|
|
|
|
||
|
|
|
|
|
|
|
|
Annual average Growth |
4.29 |
10.12 |
_ |
|
-0.47 |
|
|
|
|
|
|
|
|
Rate 84-95 (%) |
|
|
|
|
|
|
|
|
|
|
|
|
Cote d'Ivoire |
1994/1995 Average |
13.04 |
1.17 |
_ |
2.79 |
9.50 |
|
|
|
|
|||
|
|
|
|
|
||
|
|
|
|
|
|
|
|
Growth Rate 84-95 (%) |
3.42 |
-0.04 |
_ |
|
1.99 |
|
|
|
|
|
|
|
|
|
|
|
|
|
|
Kenya |
1994/1995 Average |
20.55 |
2.71 |
0.14 |
2.81 |
13.70 |
|
|
|
|
|||
|
|
|
|
|
||
|
|
|
|
|
|
|
|
Growth Rate 84-95 (%) |
1.24 |
0.12 |
10.96 |
|
1.57 |
|
|
|
|
|
|
|
|
|
|
|
|
|
|
Mauritius |
1994/1995 Average |
28.98 |
4.95 |
17.00 |
3.19 |
93.00 |
|
|
|
|
|||
|
|
|
|
|
||
|
|
|
|
|
|
|
|
Growth Rate 84-95 (%) |
2.00 |
3.46 |
177.08 |
|
_ |
|
|
|
|
|
|
|
|
|
|
|
|
|
|
S. Africa |
1994/1995 Average |
17.95 |
1.13 |
2.11 |
5.64 |
41.50 |
|
|
|
|
|||
|
|
|
|
|
||
|
|
|
|
|
|
|
|
Growth Rate 84-95 (%) |
-1.99 |
3.70 |
24.44 |
|
_ |
|
|
|
|
|
|
|
|
|
|
|
|
|
|
Tanzania |
1994/1995 Average |
23.37 |
3.28 |
0.07 |
2.56 |
4.20 |
|
|
|
|
|||
|
|
|
|
|
||
|
|
|
|
|
|
|
|
Growth Rate 84-95 (%) |
3.14 |
-2.51 |
89.35 |
|
_ |
|
|
|
|
|
|
|
|
|
|
|
|
|
|
Zimbabwe |
1994/1995 Average |
23.66 |
1.97 |
0.35 |
2.94 |
51.45 |
|
|
|
|
|||
|
|
|
|
|
||
|
|
|
|
|
|
|
|
Growth Rate 84-95 (%) |
3.68 |
6.14 |
27.35 |
|
46.09 |
|
|
|
|
|
|
|
|
|
|
|
|
|
|
Tunisia |
1994/1995 Average |
24.30 |
1.35 |
2.53 |
2.94 |
78.10 |
|
|
|
|
|
||
|
|
|
|
|
|
|
|
|
|
|
|
|
|
|
Growth Rate 84-95 (%) |
-2.91 |
5.08 |
58.24 |
|
0.71 |
|
|
|
|
|
|
|
|
|
|
|
|
|
|
Korea Rep |
1994/1995 Average |
36.55 |
11.37 |
8.67 |
2.38 |
76.90 |
|
|
|
|
|
|
|
|
|
|
|
|
|
|
|
Growth Rate 84-95 (%) |
2.02 |
2.05 |
10.82 |
|
1.40 |
|
|
|
|
|
|
|
|
|
|
|
|
|
|
Malaysia |
1994/1995 Average |
41.96 |
3.98 |
3.97 |
4.75 |
75.00 |
|
|
|
|
|||
|
|
|
|
|
||
|
|
|
|
|
|
|
|
Growth Rate 84-95 (%) |
2.92 |
-1.00 |
70.81 |
|
1.41 |
|
|
|
|
|
|
|
|
|
|
|
|
|
|
Thailand |
1994/1995 Average |
40.94 |
1.77 |
1.48 |
3.19 |
96.05 |
|
|
|
|
|||
|
|
|
|
|
||
|
|
|
|
|
|
|
|
Growth Rate 84-95 (%) |
3.5 |
1.17 |
126.29 |
|
13.94 |
|
|
|
|
|
|
|
|
|
|
|
|
|
|
Indonesia |
1994/1995 Average |
30.50 |
5.84 |
0.36 |
0.56 |
45.85 |
|
|
|
|
|||
|
|
|
|
|
||
|
|
|
|
|
|
|
|
Growth Rate 84-95 (%) |
2.02 |
3.96 |
55.49 |
|
-0.19 |
|
|
|
|
|
|
|
|
|
|
|
|
|
|
Notes:
1.Gross domestic investment consists of outlays on additions to the fixed assets of the economy plus net changes in the level of inventories. Fixed assets cover land improvements (fences, ditches, drains, and so on); plant, machinery, and equipment purchases; and the construction of roads, railways, and the like, including commercial and industrial buildings, offices, schools, hospitals, and private residential buildings.
2.Fax Machines is the estimated number of facsimile machines connected to the public switched telephone network, per 1,000 people
3.Paved roads is the percentage of paved roads that have been sealed with asphalt or similar road-building material
4.Corruption is an index of corruption around the world (high index means low corruption: Transparency International ).
5. Schooling to land per worker is given by the ratio of the index of primary school Enrolment divided by the ratio of Arable land /100 worker.
6.Growth rates for Fax machines, corruption and Paved roads refer to 90-95 period.
7.The Growth Rate 84-95(%) refers to percentage annual average growth rate between 1984-1995
7

Figure 1: Real Exchange Rate and Munufacturing Exports in Developing Countries (1990-95):
60 |
|
|
|
|
50 |
|
|
|
|
40 |
|
|
|
|
30 |
|
|
|
|
20 |
|
|
|
|
10 |
|
|
|
|
0 |
|
|
|
|
NGA GAB GHA TGO TZA ZMB CMR MDG MWI BFA CHL CIV |
CAF SEN KEN ZAF ZWE IDN |
THA TUN KOR MUS MYS |
||
-10 |
|
|
|
|
-20 |
|
|
|
|
-30 |
|
|
|
|
MXY |
RERVR |
SRERMS |
RER |
|
Notes:
1.MXY is Manufacturing Exports to GDP, RER is Real Exchange Rate, SRERMS is Real Exchange Rate Misalignment and RERVR is Real exchange rate Variability.
2.The index of real exchange rate misalignment (RERMIS) is computed as (RER-ERER)/ERER)*100%), where ERER is a model-based index of the equilibrium real exchange rate. RERMIS is an index of the extent of undervaluation (negative of overvaluation) of the real exchange rate relative to the equilibrium level. Therefore, according to Elbadawi and Helleiner RERMIS should be positively and robustly associated with manufactured exports. The RERMIS and the ERER indexes are taken from Elbadawi (1998) who constructs these indexes for 63 developing countries, based on a panel data model of the real exchange rate. Elbadawi’s approach for modeling equilibrium real exchange rates is based on estimating RER levels consistent with 'sustainable' current account equilibrium (e.g. Edwards, 1997; Elbadawi, 1994; Williamson, 1994). Williamson (1994: p. 187) for example recommends an approach for estimating, "the set of real effective exchange rates (or paths) needed to achieve simultaneous internal and external balance by some date in the medium-run future, and to maintain balance thereafter." The so called "fundamental equilibrium exchange rate"--(FEER). This FEER concept, therefore, calls for specifying (or assuming) behavioral specifications for the fundamentals and using the real exchange rate equations in the context of a bigger model to derive (paths) for the equilibrium real exchange rate, given the assumed (paths) for the fundamentals. The approach adopted by Elbadawi (1998) for estimating "sustainable" fundamentals resembles the FEER approach. In particular, the capital account fundamentals are obtained using a model that links sustainable net capital flows and net foreign income to sustainable current account balance (Edwards, 1997), and sustainable change in reserves to long-term import requirements. In addition, sustainable foreign aid ratios are linked to levels that are judged to be consistent with avoiding excessive aid dependency.
8
A far superior support for exports, in terms of investment performance, is provided by the three Asian countries, which managed to increase their investment shares to 30% or more to register staggering rates of 42% for Malaysia, 41% for Thailand and 31% for Indonesia (Table 1.B).
Third, the transaction theory suggests a negative relationship between transaction costs and MNEX. Figure 2 shows the association between MNEX and a composite index of transaction costs. The latter is weighted index of three variables: a qualitative indicator of corruption, length of paved roads and the number of fax machines in the country. The weights are given by the corresponding coefficients of regression 4 of Table 2 (see notes to Figure 2). The composite index ranges from zero (no cost) to a maximum of one. The scatter fits a negative exponential curve, where it appears that a value of 0.5 for the transaction index establishes an important threshold in terms of the relationship between MNEX and transaction costs. For most countries, at levels of the index higher than this threshold MNEX was low and was fairly invariant to changes in transaction costs. About eleven countries, all of them from SSA, fall in this segment. Another group of countries have had lower transaction costs than this threshold, yet their MNEX shares are lower than the regression line. This set includes Madagascar, Malawi, Central African Republic, Burkina Faso, Chile, and especially South Africa. While transaction costs in South Africa are at par with that of Mauritius, its MNEX shares are less than 10%, which is only slightly more than one third the shares for Mauritius. In the case of South Africa and Chile, the dominance of mineral resources is clearly an important factor contributing to this outcome. Finally, the cases of Tunisia, Thailand, Korea, Mauritius, and especially Malaysia suggest that low transaction costs are strongly associated with high shares of MNEX.
Fourth, a version of the endowment thesis predicts a negative relationship between the MNEX and the stock of skills relative to natural resource endowment. The partial correlation between the two variables for 1990-95 averages is shown in Figure 3, where the ratio of school enrolment to land area per 100 workers was used as a proxy for the ratio of skills relative to natural endowment. The figure shows a strong and positive partial correlation between the two variables, albeit with a wide distribution around the mean at low levels of MNEX. At least five patterns could be identified. First, clearly Malaysia and to a lesser extent Thailand were able to increase their MNEX ratios to much higher levels than predicted by the their skills ratios.
Secondly, the MNEX ratios achieved by Mauritius are very close to what the levels predicted by its skills ratios, while Korea and to a lesser extent Tunisia have potential for further increasing their shares of MNEX to GDP, given current skills ratios in the two countries. A third group of countries (Chile, South Africa, Zimbabwe and Indonesia) have high potential for raising MNEX shares to higher levels commensurate with their skills ratios. A fourth group of nine African countries (Kenya, Ghana, Zambia, Nigeria, Togo, Cameroon, Gabon, Madagascar and Cote d’Ivoire) are either at or close to the regression line. Finally, the remaining four countries (Burkina Faso, Tanzania, Malawi and Senegal) have actually higher MNEX shares than their relative skills ratios would predict.
9
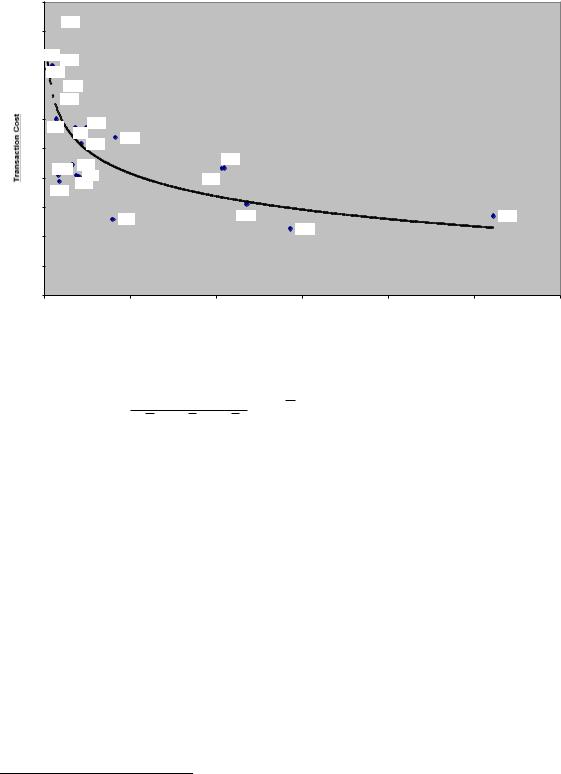
Figure 2: Transaction Cost & Manufacturing Exports (1990-95)
1
 ZMB
ZMB
0.9
0.8GHA NGA GAB
0.7 

 CMA
CMA  TGO
TGO
0.6 |
TZA |
KEN |
|
|
|
|
|
|
|
CIV |
ZWE |
|
|
|
|
|
|
|
|
|
|
|
|
|
||
|
|
SEN |
|
|
|
|
|
|
0.5 |
|
|
|
|
|
|
|
|
|
|
|
|
TUN |
|
|
|
|
|
MDG CHL |
|
|
|
|
|
||
|
|
|
|
|
|
|
||
0.4 |
|
BFA |
|
THA |
|
|
|
|
|
CAF |
|
|
|
|
|
||
|
MWI |
|
|
|
|
|
|
|
|
|
|
|
|
|
|
|
|
0.3 |
|
|
|
|
KOR |
|
|
MYS |
|
|
|
ZAF |
|
|
|
||
|
|
|
|
MUS |
|
|
|
|
0.2 |
|
|
|
|
|
|
|
|
|
|
|
|
|
|
|
|
|
0.1 |
|
|
|
|
|
|
|
|
0 |
|
|
|
|
|
|
|
|
0 |
|
|
10 |
20 |
30 |
40 |
50 |
60 |
Manufacturing Exports/GDP
Note:
The composite index of transaction cost is calculated as a normalized index of TC, where TC is given by:
TC = |
1 |
X ’s are the average of LFAX, PROADS and LCORR and β’s are the |
where |
β1 X1 + β2 X 2 + β3 X 3
estimated coefficients from Table 2
The analysis of this section establishes the relevance of the four set of variables as potential determinants of MNEX. Next I turn to a more formal behavioral analysis using panel data.
3.Econometric Analysis of Manufactured Exports in Developing Countries
Each of the three theories suggests a pivotal determinant of manufactured exports. First, Wood’s endowment hypothesis suggests that a combination of high natural resource per worker (measured by the ratio of land area per 100 worker)10 and low human capital per worker (measured by schooling per worker) should both be negatively associated with manufactured exports. Another version of the theory assumes that both of the two factors have the same quantitative effect on exports, which leads to a restricted model with a single endowment variable (the ratio of human capital per worker to land area per 100 worker). This restricted version of the endowment theory predicts that countries with higher human capital per worker relative to their natural resource base per worker have a comparative advantage in
10 This variable is a variant of the population density, which as well, has been shown to be closely associated with the composition of exports (Perkins and Syrquin, 1989).
10