

Text #14 Family strategies
In any environment there is a limit to the resources that are available for any particular species. This is known by ecologists as the carrying capacity. In other words, there is only so much food or space available to support a population. Different organisms respond in different ways to their environment, and there are two principal survival strategies by which plants and animals exploit the available resources in order for the species to succeed. Some species multiply as rapidly as possible. This is called the “r” strategy, r being a measure of how fast a population can grow. In general, r-selected species invest energy in many offspring and many generations. They tend to be small and have a short life span. Population sizes can fall dramatically with changes in the environment, but their strategy enables them to recover quickly. Other species reproduce more slowly. This is called the “K” strategy, because their numbers tend to remain close to K, a mathematical term for the carrying capacity. K-selected species generally live longer and invest more energy in a smaller number of offspring over a longer period of time.
ALLEE’S PRINCIPLE In his book Animal Aggregations, the American zoologist Warder Clyde Allee (1885-1955) noted that in some animal species individuals group together for a variety of beneficial reasons. His view of animal behaviour, emphasizing cooperation rather than competition, had a profound influence on ecological theory. |
|
|
SLOW AND STEADY In large mammals that follow the K strategy, the young are described as “precocial” – they are born in an advanced state of maturity. The elephant, for example, has a long pregnancy, one calf is born at a time, and considerable energy and time are invested in nurturing the young. In this way the strategy helps to ensure that the young survive to breed. |

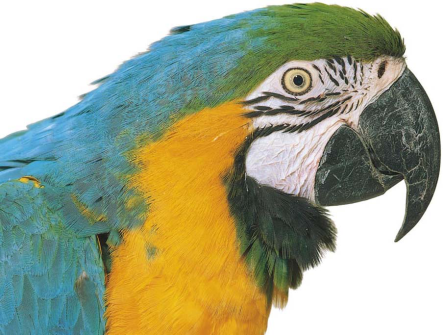
Blue and yellow macaw – a K-selected species
|
DIFFERENT STRATEGIES Two related species of bird, the budgerigar of the arid regions of Australia and the blue and yellow macaw of the tropical forests of South America, show very different survival strategies. The budgerigar is an opportunistic species or “r strategist”, laying many eggs and having a short life span. The blue and yellow macaw is an equilibrium species or “K strategist”, producing fewer eggs and living for a long time. Much of this difference in strategy is due to the different habitats of the two species. In order to deal with the dry and difficult conditions of the Australian outback, the budgerigar must be able to profit from the abundant resources when the rains come. It does this by quickly producing large numbers of young. In the stable conditions of the tropical forest, the macaw can invest more time in its offspring. |
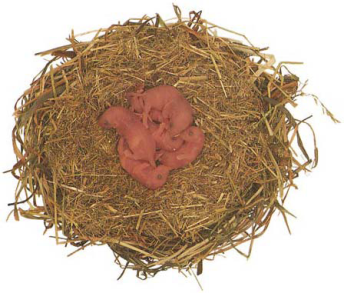
MANY AND OFTEN Small mammals tend to be r strategists. The main difference between them and the K strategists can be seen in the number of young that they bear and the frequency with which they do so. The young, which can number up to 10 in the case of some mice, are described as “altricial”. This means that they are born at a very immature stage of development, allowing the mother to become pregnant again and produce another brood while the conditions in the environment are right. |
Nest of baby mice
|
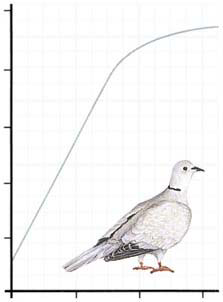
EXPLOITING A NICHE In a period of just 25 years from its first arrival in the UK, the collared dove became a common sight. This rapid increase, growing by a factor of 10 every 2.3 years, shows that the dove was able to exploit a previously unoccupied niche (pp. 26-27). The flattening out of the top of the growth curve reveals that the size of the collared dove population stabilized without exceeding the carrying capacity. |
Graph of population size of collared dove over time |
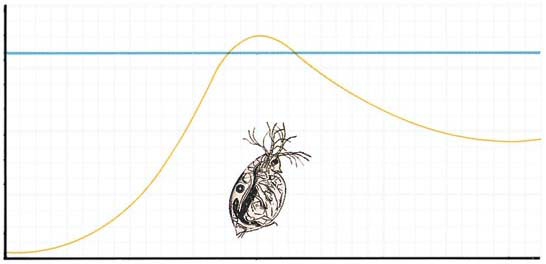
Graph of population size of Daphnia water flea over time
|
DAPHNIA WATER FLEA This graph shows the changing size of a population of Daphnia water fleas being grown in the laboratory. The curve is described as “J-shaped”, and it is typical of the population growth of an extremely r-selected species under favourable conditions. The population of animals increases rapidly and then falls away as the numbers exceed the carrying capacity of the environment. When observed under natural conditions, this curve indicates a “boom or bust” species such as the snowshoe hare. |
|
|
|
Yeast culture at time 1 |
Yeast culture at time 2 |
Yeast culture at time 3 |


GROWING WITHIN LIMITS This graph shows the changing size of a population of yeast fungus being grown under laboratory conditions. The curve is described as S-shaped, and it is the typical growth curve for most organisms. From a gradual start, the population size rises fairly rapidly, slows down, and then levels out as the population approaches the carrying capacity. As the colony grows, the individuals reduce their reproduction rate in response to such factors as food exhaustion and the build-up of waste material. The effects of these increase as the population increases, so they are density dependent factors. The example of the collared dove (top) shows how a species responds to similar factors in the wild. |
|
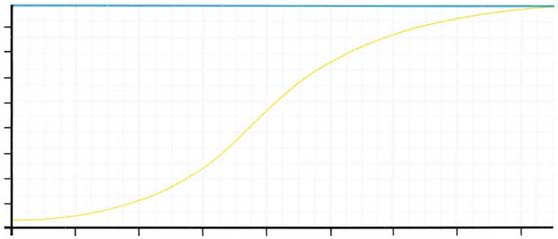 Population
size of cultured yeast over time
Population
size of cultured yeast over time