

Biblio5
.pdf40 SIGNALS CONVEY INTELLIGENCE
Figure 2.14 A generic model of a typical radio link.
Bandwidth is also determined by the regulating authority (e.g., the FCC in the United States) for a particular service/ application. Through bit packing techniques, described in Chapter 9, the information-carrying capacity of a unit of bandwidth is considerably greater than 1 bit per Hz of bandwidth. On line-of-sight microwave systems, 5, 6, 7, and 8 bits per Hz of bandwidth are fairly common. Chapter 9 provides a more detailed discussion of radio systems.
REVIEW EXERCISES
1. Name at least four different ways of communicating at a distance prior to the advent of electrical communication.
2. What kind of energy is stored in a battery?
3. How did the old electric telegraph communicate intelligence?
|
|
|
|
|
REFERENCES |
41 |
4. |
What limited the distance we could transmit with electrical telegraph before using |
|||||
|
a repeater? Give at least two ways we could extend the distance. |
|
||||
5. |
How could that old-time electrical telegraph operate with just one wire? |
|
||||
6. |
Name at least four ways we might characterize a “sine wave,” either partially or |
|||||
|
wholly. |
|
|
|
||
7. |
What is the equivalent wavelength (l) of 850 MHz? of 7 GHz? |
|
||||
8. |
What angle (in degrees) is equivalent to 3p/ 2? p/ 4? |
|
||||
9. |
Give two examples of baseband transmission. |
|
||||
10. |
Define modulation. |
|
||||
11. |
What are the three generic forms of modulation? What popular device we find in |
|||||
|
the home utilizes all three types of modulation simultaneously. Hint: The answer |
|||||
|
needs a modifier in front of the word. |
|
||||
12. |
Differentiate an analog signal from a digital signal. |
|
||||
13. |
Give at least four applications of a 1-bit code. Use your imagination. |
|
||||
14. |
What is the total capacity of a 9-bit binary code? The Hollerith code was a 12-bit |
|||||
|
code. What was its total capacity? |
|
||||
15. |
Name four different transmission media. |
|
||||
16. |
What is the opposite of loss? What is the most common unit of measurement to |
|||||
|
express the amount of loss? |
|
||||
17. |
What is the reason for twists in twisted pair? |
|
||||
18. |
What is the principal cause of data rate limitation on wire pair? |
|
||||
19. |
What is the principal drawback of using coaxial cable for long-distance transmis- |
|||||
|
sion? |
|
|
|
||
20. |
What is the principal, unbeatable advantage of fiber optic cable? |
|
||||
21. |
Regarding limitation of bit rate and length, a fiber optic cable may be either |
|||||
22. |
|
|
or |
|
? |
|
Explain dispersion (with fiber optic cable). |
|
|||||
23. |
What are some typical services of LMDS? |
|
||||
REFERENCES
1. From Semaphore to Satellite, International Telecommunication Union, Geneva, 1965.
2. Principles of Electricity Applied to Telephone and Telegraph Work, American Telephone and Telegraph Co., New York, 1961.
3. R. L. Freeman, Telecommunication Transmission Handbook, 4th ed., Wiley, New York, 1998.

Fundamentals of Telecommunications. Roger L. Freeman
Copyright 1999 Roger L. Freeman
Published by John Wiley & Sons, Inc.
ISBNs: 0-471-29699-6 (Hardback); 0-471-22416-2 (Electronic)
3
QUALITY OF SERVICE AND TELECOMMUNICATION IMPAIRMENTS
3.1 OBJECTIVE
Quality of service (QoS) was introduced in Section 1.4. In this chapter we will be more definitive in several key areas. There are a number of generic impairments that will directly or indirectly affect quality of service. An understanding of these impairments and their underlying causes is extremely important if one wants to grasp the entire picture of a telecommunication system.
3.2 QUALITY OF SERVICE: VOICE, DATA, AND IMAGE
3.2.1 Introduction to Signal-to-Noise Ratio
Signal-to-noise ratio (S/ N or SNR) is the most widely used parameter for measurement of signal quality in the field of transmission. Signal-to-noise ratio expresses in decibels the amount by which signal level exceeds the noise level in a specified bandwidth.
As we review the several types of material to be transmitted on a network, each will require a minimum S/ N to satisfy the user or to make a receiving instrument function within certain specified criteria. The following are S/ N guidelines at the corresponding receiving devices:
Voice: 40 dB;
Video (TV): 45 dB;
Data: 15 dB, based upon the modulation type and specified error performance.
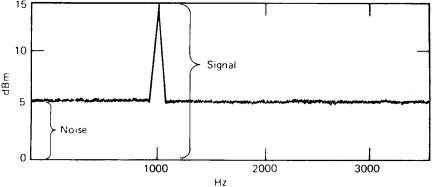
To illustrate the concept of S/ N, consider Figure 3.1. This oscilloscope presentation shows a nominal analog voice channel (300 –3400 Hz) with a 1000-Hz test signal. The vertical scale is signal power measured in dBm (see Appendix C for a tutorial on dBs), and the horizontal scale is frequency, 0 Hz to 3400 Hz. The S/ N as illustrated is 10 dB. We can derive this by inspection or by reading the levels on the oscilloscope presentation. The signal level is +15 dBm; the noise is +5 dBm, then:
(S/ N)dB c level(signal in dBm) − level(noise in dBm) |
(3.1) |
43
44 QUALITY OF SERVICE AND TELECOMMUNICATION IMPAIRMENTS
Figure 3.1 Signal-to-noise ratio.
Inserting the values given in the oscilloscope example, we have:
S/ N c +15 dBm − (+5 dBm) c 10 dB.
This expression is set up as shown because we are dealing with logarithms (see Appendix B). When multiplying in the domain of logarithms, we add. When dividing, we subtract. We are dividing because on the left side of the equation we have S/ N or S divided by N.
Signal-to-noise ratio really has limited use in the PSTN for characterizing speech transmission because of the “spurtiness” of the human voice. We can appreciate that individual talker signal power can fluctuate widely so that the S/ N ratio is far from constant during a telephone call and from one telephone call to the next. In lieu of actual voice, we use a test tone to measure level and S/ N. A test tone is a single frequency, usually around 800 or 1000 Hz, generated by a signal generator and inserted in the voice channel. The level of the tone (often measured in dBm) can be easily measured with the appropriate test equipment. Such a tone has constant amplitude and no silent intervals, which is typical of voice transmission (Ref. 3).
3.2.2 Voice Transmission
3.2.2.1. Loudness Rating and Its Predecessors. Historically, on telephone connections, the complaint has been that the distant talker’s voice was not loud enough at the receiving telephone. “Hearing sufficiently well” on a telephone connection is a subjective matter. This is a major element of QoS. Various methods have been derived over the years to rate telephone connections regarding customer satisfaction.
The underlying cause of low signal level is loss across the network. Any method to measure “hearing sufficiently well” should incorporate intervening losses on a telephone connection. As discussed in Chapter 2, losses are conventionally measured in dB. Thus the unit of measure of “hearing sufficiently well” is the decibel. From the present method of measurement we derive the loudness rating, abbreviated LR. It had several predecessors: reference equivalent and corrected reference equivalent.
3.2 QUALITY OF SERVICE: VOICE, DATA, AND IMAGE |
45 |
3.2.2.2. Reference Equivalent. The reference equivalent value, called the overall reference equivalent (ORE), was indicative of how loud a telephone signal is. How loud is a subjective matter. Given a particular voice level, for some listeners it would be satisfactory, others unsatisfactory. The ITU in Geneva brought together a group of telephone users to judge telephone loudness. A test installation was set up made up of two standard telephone subsets, a talker’s simulated subscriber loop and a listener’s simulated loop. An adjustable attenuating network was placed between the two simulated loops. The test group, on an individual basis, judged level at the receiving telephone earpiece. At a 6-dB setting of the attenuator or less, calls were judged too loud. Better than 99% of the test population judged calls to be satisfactory with an attenuator setting of 16 dB; 80% rated a call satisfactory with an ORE 36 dB or better, and 33.6% of the test population rated calls with an ORE of 40 dB as unsatisfactory, and so on.
Using a similar test setup, standard telephone sets of different telephone administrations (countries) could be rated. The mouthpiece (transmitter) and earpiece (receiver) were rated separately and given a dB value. The dB value was indicative of their working better or worse than the telephones used in the ITU laboratory. The attenuator setting represented the loss in a particular network connection. To calculate overall reference equivalent (ORE) we summed the three dB values (i.e., the transmit reference equivalent of the telephone set, the intervening network losses, and the receive reference equivalent of the same type subset).
In one CCITT recommendation, 97% of all international calls were recommended to have an ORE of 33 dB or better. It was found that with this 33-dB value, less than 10% of users were unsatisfied with the level of the received speech signal.
3.2.2.3. Corrected Reference Equivalent. Because difficulties were encountered in the use of reference equivalents, the ORE was replaced by the corrected reference equivalent (CRE) around 1980. The concept and measurement technique of the CRE was essentially the same as RE (reference equivalent) and the dB remained the measurement unit. CRE test scores varied somewhat from its RE counterparts. Less than 5 dB (CRE) was too loud; an optimum connection had an RE value of 9 dB and a range from 7 dB to 11 dB for CRE. For a 30-dB value of CRE, 40% of a test population rated the call excellent, whereas 15% rated it poor or bad.
3.2.2.4. Loudness Rating. Around 1990 the CCITT replaced corrected reference equivalent with loudness rating. The method recommended to determine loudness rating eliminates the need for subjective determinations of loudness loss in terms of corrected reference equivalent. The concept of overall loudness loss (OLR) is very similar to the ORE concept used with reference equivalent.
Table 3.1 gives opinion results for various values of OLR in dB. These values are based upon representative laboratory conversation test results for telephone connections in which other characteristics such as circuit noise have little contribution to impairment.
3.2.2.4.1 Determination of Loudness Rating. The designation with notations of loudness rating concept for an international connection is given in Figure 3.2. It is assumed that telephone sensitivity, both for the earpiece and microphone, have been measured. OLR is calculated using the following formula:
OLR c SLR + CLR + RLR. |
(3.2) |

46 QUALITY OF SERVICE AND TELECOMMUNICATION IMPAIRMENTS
Table 3.1 Overall Loudness Rating Opinion Results
|
Representative Opinion Resultsa |
|
Overall Loudness |
Percent |
Percent |
Rating (dB) |
“Good plus Excellent” |
“Poor plus Bad” |
|
|
|
5–15 |
< 90 |
<1 |
20 |
80 |
4 |
25 |
65 |
10 |
30 |
45 |
20 |
a Based on opinion relationship derived from the transmission quality index (see Annex A, ITU-T Rec. P.11).
Source: ITU-T Rec. P.11, Table 1/ P.11, p. 2, Helsinki, 3/ 93.
The measurement units in Eq. (3.2) are dB.
OLR is defined as the loudness loss between the speaking subscriber’s mouth and the listening subscriber’s ear via a telephone connection. The send loudness rating (SLR) is defined as the loudness loss between the speaking subscriber’s mouth and an electrical interface in the network. The receive loudness rating (RLR) is the loudness loss between an electrical interface in the network and the listening subscriber’s ear. The circuit loudness rating (CLR) is the loudness loss between two electrical interfaces in a connection or circuit, each interface terminated by its nominal impedance (Refs. 1, 2).
3.2.3 Data Circuits
Bit error rate (BER) is the underlying QoS parameter for data circuits. BER is not subjective; it is readily measurable. Data users are very demanding of network operators regarding BER. If a network did not ever carry data, BER requirements could be much less stringent. CCITT/ ITU-T recommends a BER of 1 × 10⁻⁶ for at least 80% of a month.1 Let us assume that these data will be transported on the digital network, typical of a PSTN. Let us further assume that conventional analog modems are not used, and the data is exchanged bit for bit with “channels” on the digital network. Thus, the BER of the data reflects the BER of the underlying digital channel that is acting as its transport. BERs encountered on digital networks in the industrialized/ postindustrialized
National |
International |
National |
S system |
system |
system R |
SLR |
CLR |
RLR |
|
OLR |
|
CLR Circuit loudness rating
OLR Overall loudness rating
RLR Receive loudness rating
SLR Send loudness rating
Figure 3.2 Designation of LRs in an international connection.
1See CCITT Rec. G.821.
3.3 THREE BASIC IMPAIRMENTS AND HOW THEY AFFECT THE END-USER |
47 |
nations are far improved, some attaining an end-to-end BER of 5 × 10⁻¹⁰. Thus the data being transported can expect a similar BER. The genesis of frame relay, discussed in Chapter 10, is based on the premise that these excellent BERs can be expected.
3.2.4 Video (Television)
Television picture quality is subjective to the viewer. It is based on the S/ N of the picture channel. The S/ N values derived from two agencies are provided below. The TASO (Television Allocations Study Organization) ratings follow:
|
TASO PICTURE RATING |
|
|
Quality |
S/ N |
|
|
|
1. |
Excellent (no perceptible snow) |
45 dB |
2. |
Fine (snow just perceptible) |
35 dB |
3. |
Passable (snow definitely perceptible but not objectionable) |
29 dB |
4. |
Marginal (snow somewhat objectionable) |
25 dB |
Snow is the visual perception of high levels of thermal noise typical with poorer S/N values.
CCIR developed a five-point scale for picture quality versus impairment. This scale is shown in the table below:
|
CCIR FIVE GRADE SCALE |
||
|
Quality |
|
Impairment |
|
|
|
|
5. |
Excellent |
5. |
Imperceptible |
4. |
Good |
4. |
Perceptible, but not annoying |
3. |
Fair |
3. |
Slightly annoying |
2. |
Poor |
2. |
Annoying |
1. |
Bad |
1. |
Very annoying |
Later CCIR/ ITU-R documents steer clear of assigning S/ N to such quality scales. In fact, when digital compression of TV is employed, the use of S/ N to indicate picture quality is deprecated.
3.3 THREE BASIC IMPAIRMENTS AND HOW THEY AFFECT THE END-USER
There are three basic impairments found in all telecommunication transmission systems. These are:
1. Amplitude (or attenuation) distortion;
2. Phase distortion; and
3. Noise.
3.3.1 Amplitude Distortion
The IEEE defines attenuation distortion (amplitude distortion) as the change in attenuation at any frequency with respect to that of a reference frequency. For the discussion in
48 QUALITY OF SERVICE AND TELECOMMUNICATION IMPAIRMENTS
Attenuation (dB) (relative to attenuation at 1000 Hz)
2
1
0
– 1
– 2
300 |
1000 |
3400 |
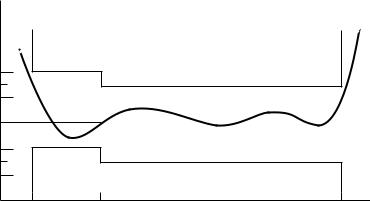
Figure 3.3 Typical attenuation distortion across a voice channel bandpass filter. Cross-hatched areas are response specifications, whereas the wavy line is the measured response.
this section, we’ll narrow the subject to the (analog) voice channel. In most cases a user is connected, through his/ her metallic subscriber loop, to the local serving exchange. This circuit is analog. Based upon the CCITT definition, the voice channel occupies the band from 300 Hz to 3400 Hz. We call this the passband.
Attenuation distortion can be avoided if all frequencies within the passband are subjected to the same loss (or gain). Whatever the transmission medium, however, some frequencies are attenuated more than others. Filters are employed in most active circuits (and in some passive circuits) and are major causes of attenuation distortion. Figure 3.3 is a response curve of a typical bandpass filter with voice channel application.
As stated in our definition, amplitude distortion across the voice channel is measured against a reference frequency. CCITT recommends 800 Hz as the reference; in North America the reference is 1000 Hz.2 Let us look at some ways attenuation distortion may be stated. For example, one European requirement may state that between 600 Hz and 2800 Hz the level will vary no more than −1 to +2 dB, where the plus sign means more loss and the minus sign means less loss. Thus if an 800-Hz signal at −10 dBm is placed at the input of the channel, we would expect −10 dBm at the output (if there were no overall loss or gain), but at other frequencies we can expect a variation at the output of −1 to +2 dB. For instance, we might measure the level at the output at 2500 Hz at −11.9 dBm and at 1100 Hz at −9 dBm.
When filters or filterlike devices are placed in tandem, attenuation distortion tends to sum.3 Two identical filters degrade attenuation distortion twice as much as just one filter.
3.3.2 Phase Distortion
We can look at a voice channel as a band-pass filter. A signal takes a finite time to pass through the telecommunication network. This time is a function of the velocity
2Test frequencies of 800-Hz and 1000-Hz are not recommended if the analog voice channel terminates into the digital network. In this case CCITT and Bellcore recommend 1020 Hz. The reason for this is explained in Chapter 6.
3Any signal-passing device, active or passive, can display filterlike properties. A good example is a subscriber loop, particularly if it has load coils and bridged taps. Load coils and bridged taps are discussed in Chapter 5.
Differential delay (ms)
3.3 THREE BASIC IMPAIRMENTS AND HOW THEY AFFECT THE END-USER |
49 |
2.0
1.5
1.0
0.5
0 |
|
|
|
|
|
|
|
|
0.2 |
0.4 |
0.6 |
0.8 |
1.0 |
2.0 |
3.0 |
4.0 |
5.0 |
Frequency (kHz)
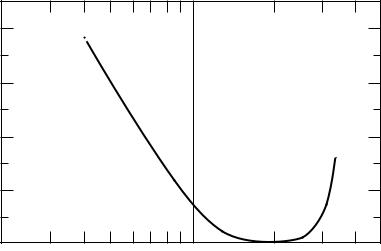
Figure 3.4 Typical differential delay across a voice channel.
of propagation for the medium and, of course, the length of the medium. The value can vary from 10,000 mi/ sec (16,000 k/ sec) to 186,000 mi/ sec (297,600 km/ sec). The former value is for heavily loaded subscriber pair cable.4 This latter value is the velocity of propagation in free space, namely, radio propagation.
The velocity of propagation also tends to vary with frequency because of the electrical characteristics associated with the network. Again, the biggest culprit is filters. Considering the voice channel, therefore, the velocity of propagation tends to increase toward band center and decrease toward band edge. This is illustrated in Figure 3.4.
The finite time it takes a signal to pass through the total extension of the voice channel or through any network is called delay. Absolute delay is the delay a signal experiences while passing through the channel end-to-end at a reference frequency. But we have learned that propagation time is different for different frequencies with the wavefront of one frequency arriving before the wavefront of another frequency in the passband. A modulated signal will not be distorted on passing through the channel if the phase shift changes uniformly with frequency, whereas if the phase shift is nonlinear with respect to frequency, the output signal is distorted with respect to frequency.
In essence, we are dealing with phase linearity of a circuit. If the phase–frequency relationship over a passband is not linear, phase distortion will occur in the transmitted signal. Phase distortion is often measured by a parameter called envelope delay distortion (EDD). Mathematically, EDD is the derivative of the phase shift with respect to frequency. The maximum variation in the envelope over a band of frequencies is called envelope delay distortion. Therefore EDD is always a difference between the envelope delay at one frequency and that at another frequency of interest in the passband. It should be noted that envelope delay is often defined the same as group delay—which is the ratio of change, with angular frequency, of phase shift between two points in the network (Ref. 2).5
4Wire-pair loading is discussed in Chapter 5.
5Angular frequency and just the term frequency are conceptually the same for this text. Actually, angular frequency is measured in radians per second. There are 2p radians in 1 Hz.
50 QUALITY OF SERVICE AND TELECOMMUNICATION IMPAIRMENTS
Figure 3.4 shows that absolute delay is minimum around 1700 Hz and 1800 Hz in the voice channel. The figure also shows that around 1700 Hz and 1800 Hz, envelope delay distortion is flattest.6 It is for this reason that so many data modems use 1700 Hz or 1800 Hz for the characteristic tone frequency, which is modulated by the data. A data modem is a device that takes the raw electrical baseband data signal and makes it compatible for transmission over the voice channel.
This brings up an important point. Phase distortion (or EDD) has little effect on speech communications over the telecommunications network. However, regarding data transmission, phase distortion is the greatest bottleneck for data rate (i.e., the number of bits per second that a channel can support). It has probably more effect on limiting data rate that any other parameter (Ref. 3).
3.3.3 Noise
3.3.3.1. General. Noise, in its broadest definition, consists of any undesired signal in a communication circuit. The subject of noise and noise reduction is probably the most important single consideration in transmission engineering. It is the major limiting factor in overall system performance. For our discussion in this text, noise is broken down into four categories:
1. Thermal noise;
2. Intermodulation noise;
3. Impulse noise; and
4. Crosstalk.
3.3.3.2. Thermal Noise. Thermal noise occurs in all transmission media and all communication equipment, including passive devices such as waveguide. It arises from random electron motion and is characterized by a uniform distribution of energy over the frequency spectrum with a Gaussian distribution of levels.
Gaussian distribution tells us that there is statistical randomness. For those of you who have studied statistics, this means that there is a “normal” distribution with standard deviations. Because of this, we can develop a mathematical relationship to calculate noise levels given certain key parameters.
Every equipment element and the transmission medium itself contributes thermal noise to a communication system if the temperature of that element or medium is above absolute zero on the Kelvin temperature scale. Thermal noise is the factor that sets the lower limit of sensitivity of a receiving system and is often expressed as a temperature, usually given in units referred to absolute zero. These units are called kelvins (K), not degrees.
Thermal noise is a general term referring to noise based on thermal agitations of electrons. The term “white noise” refers to the average uniform spectral distribution of noise energy with respect to frequency. Thermal noise is directly proportional to bandwidth and noise temperature.
We turn to the work of the Austrian scientist, Ludwig Boltzmann, who did landmark work on the random motion of electrons. From Boltzmann’s constant, we can write a relationship for the thermal noise level (Pn) in 1 Hz of bandwidth at absolute zero (Kelvin scale) or
6“Flattest” means that there is little change in value. The line is flat, not sloping.