Editing checklist
|
Points to check for |
My check |
My partner’s check |
|
Is the abstract no more than 1 page and maximum three paragraphs? |
|
|
|
Is the first sentence the thesis statement? |
|
|
|
Does each paragraph deal with one central idea? |
|
|
|
Are the ideas supported carefully? |
|
|
|
Do the transitions between paragraphs link them together logically? |
|
|
|
Is there a conclusion with some new ideas to challenge the readers to think further? |
|
|
|
Is the layout correct? |
|
|
|
Is the style correct? |
|
|
|
Are the clichés used properly? |
|
|
Unit 2. Visual aids
Start-up
Tongue twisters to be remembered:
a)
b)
c )
)![]() Listen:
Listen:
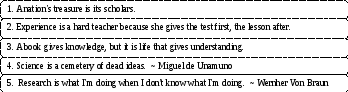
d) Give appropriate translation to the sayings. Remember four of them:
e) Make up a small sayings-based dialogue.
 a)
Read out the numbers and quantities. Then listen and check.
a)
Read out the numbers and quantities. Then listen and check.
|
|
|
|
|
|
|
|
|
|
|
|
b) Listen and write down the numbers and quantities you hear.
Lead-in
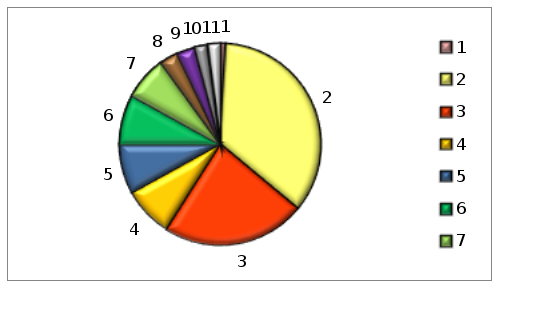
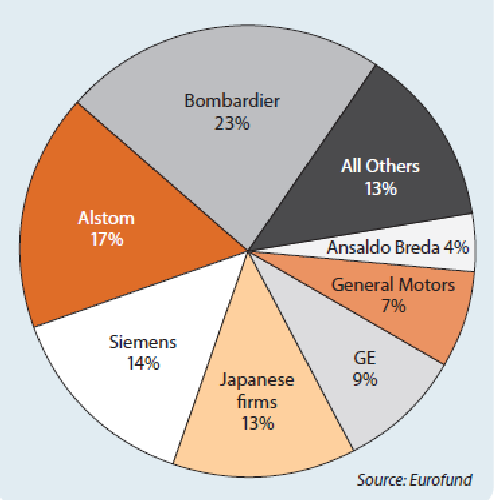
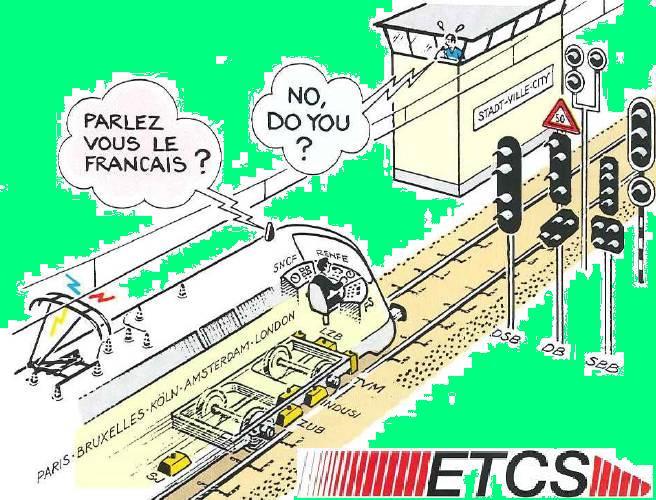
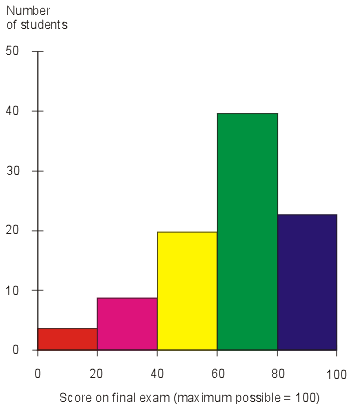
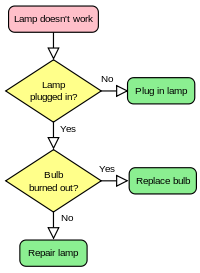
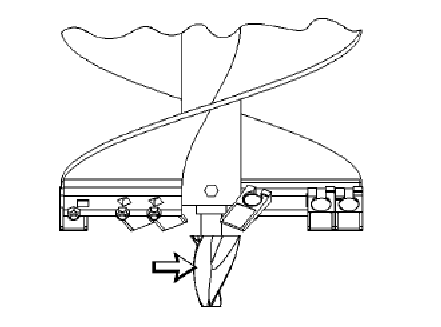
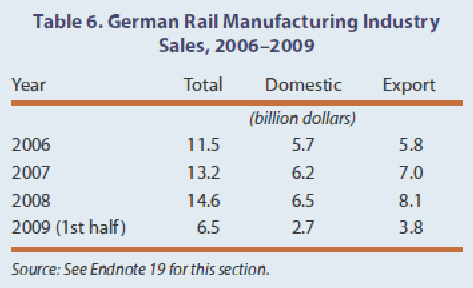
a) Look at the visuals. What are they called in English? Match the pictures with the definitions.
|
1) |
bar chart |
3) |
pie chart |
5) |
technical drawing |
|
2) |
table |
4) |
flow chart |
6) |
picture |
|
|
|
|
A. |
B. |
|
|
|
|
C. |
D. |
|
|
|
|
E. |
F. |
b) Discuss the following questions.
Why do presenters use visual aids?
What types of visuals can you name? What visuals have you used?
What computer programmes will help you to create visuals?
c) Read the English clichés to describe visuals. Divide them into three categories listed below. Match the English clichés with their Russian equivalents.
1) a presenter notes which parts of the visuals are important and explains why he/she uses them;
2) a presenter introduces the visuals;
3) a presenter checks understanding of the results.
|
1. |
6. Let’s now look at the next slide which shows… 7. First, let me explain the graph. 8. You can see that different colours have been used to indicate…
|
A. |
1. Мне бы хотелось более подробно рассмотреть эту часть графика. 2. Мне бы хотелось обратить ваше внимание на значение вот этой цифры. 3. Мне бы хотелось привести несколько любопытных фактов. 4. Как вы можете видеть/ как видите… 5. Также я хочу обратить ваше внимание на… 6. Если вы обратите внимание на…, то заметите, что... 7. Прежде всего, мне хотелось бы обратить ваше внимание на… 8. Мне бы хотелось привлечь ваше внимание к… 9. Давайте рассмотрим… более подробно.
|
|
2. |
|
B. |
1. Уверен/а, что результаты этих расчетов очевидны. 2. Полагаю, выводы, сделанные из этого графика понятны всем.
|
|
3. |
|
C. |
1. Обратите внимание на данную схему/ диаграмму. 2. Мне бы хотелось, обратить ваше внимание на этот чертеж. 3. Здесь вы можете видеть… 4. На графике представлены… 5. На рисунке показаны/ дана информация о… 6. Позвольте обратить ваше внимание на следующий слайд, где показаны… 7. Прежде всего, позвольте мне дать пояснения к графику. 8. Как видите, разными цветами обозначены…
|
d) Match the two parts to make sentences to talk about visuals.
|
1. |
Let’s now have a look |
a. |
shows our revenues since 2011. |
|
2. |
The black line gives us |
b. |
the next pie chart. |
|
3. |
Each line on the graph indicates |
c. |
at how the new division will be structured. |
|
4. |
In the upper right-hand corner |
d. |
attention to the figures in the left-hand column. |
|
5. |
The graph on the following slide |
e. |
you can see the specifications for the TP model. |
|
6. |
Now I’d like you to take |
f. |
the sales figures for the VW Fox. |
|
7. |
The names of the new models are listed |
g. |
table on the right. |
|
8. |
You can see the test results in the |
h. |
a look at the next slide. |
|
9. |
This aspect of the problem is illustrated |
i. |
the production output of a different product. |
|
10. |
I’d like to draw your |
j. |
across the top. |
a)
 Listen to the report about the use of plastics and complete the
chart.
Listen to the report about the use of plastics and complete the
chart.