

unwto_highlights14_en_hr_0
.pdf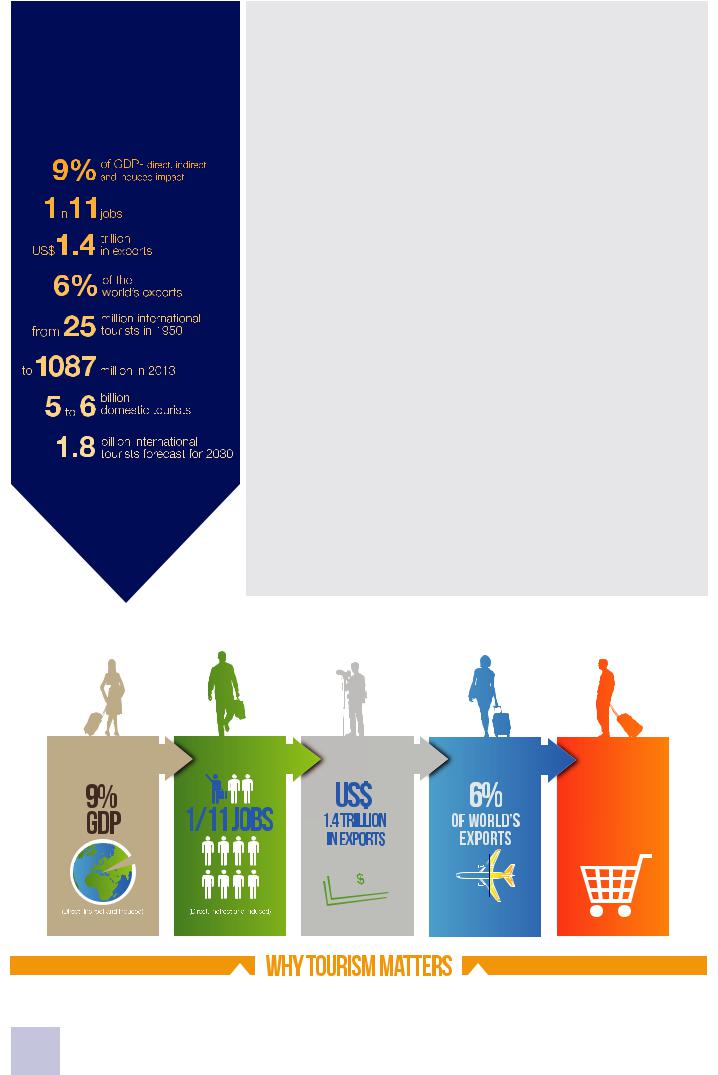
Tourism in the world: key Þgures
Tourism, key to development, prosperity and well-being
•An ever increasing number of destinations worldwide have opened up to, and invested in tourism, turning tourism into a key driver of
socio-economic progress through export revenues, the creation of jobs and enterprises, and infrastructure development.
•Over the past six decades, tourism has experienced continued expansion and diversification, becoming one of the largest and fastest-growing economic sectors in the world. Many new destinations have emerged in addition to the traditional favourites of Europe and North America.
•Despite occasional shocks, international tourist arrivals have shown virtually uninterrupted growth – from 25 million in 1950 to 278 million in 1980, 528 million in 1995, and 1087 million in 2013.
Long-term outlook
•International tourist arrivals worldwide are expected to increase by 3.3% a year from 2010 to 2030 to reach 1.8 billion by 2030, according to UNWTO’s long term forecast Tourism Towards 2030.
•Between 2010 and 2030, arrivals in emerging destinations (+4.4% a year) are expected to increase at twice the rate of those in advanced economies (+2.2% a year).
•The market share of emerging economies increased from 30% in 1980 to 47% in 2013, and is expected to reach 57% by 2030, equivalent to over 1 billion international tourist arrivals.
29%
ofservices exports
2UNWTO Tourism Highlights, 2014 Edition
International tourism in 2013 - key trends and outlook
•International tourist arrivals (overnight visitors) grew by 5% worldwide in 2013, reaching a record 1087 million arrivals, after topping the
1 billion mark in 2012.
•Asia and the Pacific recorded the strongest growth with a 6% increase in arrivals, followed by Europe and Africa (both +5%).
•In the Americas, international arrivals grew by 3%, while in the Middle East they were flat.
•International tourism receipts reached US$ 1159 billion worldwide in 2013, up from US$ 1078 billion in 2012.
•With a 5% increase in real terms, the growth in international tourism receipts equalled the growth in arrivals.
•China has consolidated its position as the number one tourism source market in the world, spending US$ 129 billion on international tourism.
•Forecasts prepared by UNWTO in January 2014 point to growth of 4% to 4.5% in international tourist arrivals in 2014 – above The Tourism Towards 2030 long-term forecast of 3.3% a year.
•By UNWTO region, prospects for 2014 are strongest for Asia and the Pacific (5% to 6%), followed by Africa (4% to 6%).
About UNWTO
The World Tourism Organization (UNWTO) is the United Nations’ agency responsible for the promotion of responsible, sustainable and universally accessible tourism. It serves as a global forum for tourism policy and a source of tourism know-how.
Know more about us: unwto.org
Contents |
|
International tourist arrivals |
4 |
International tourism receipts |
5 |
World’s top tourism destinations |
6 |
Regional results |
7 |
Europe |
8 |
Asia and the Pacific |
9 |
Americas |
10 |
Africa |
11 |
Middle East |
12 |
Outbound tourism |
12 |
Top outbound markets |
13 |
UNWTO Tourism Towards 2030 |
14 |
|
|
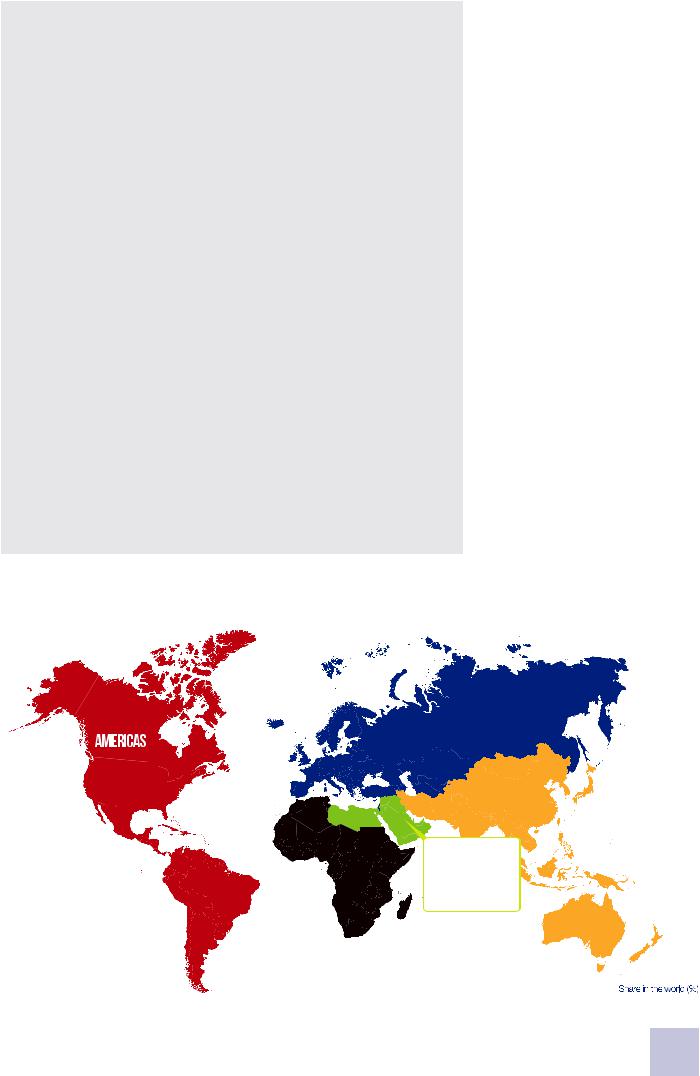
internationaltourism2013 International tourist arrivals (ITA): 1087 million International tourism receipts (ITR): US$ 1159 billion
ita:563million (52%) EUROPE iTr:489 US$ bn (42%)
ita:168million (15%) |
asiapacific |
|
iTr:229US$ bn (20%) |
||
ita:248million (23%) |
||
|
||
|
itr:359US$ bn (31%) |
|
ita:56million (5%) |
middleeast |
|
iTr:34US$ bn (3%) |
||
africa |
ita:52million (5%) |
|
iTr:47US$ bn (4%) |
||
|
UNWTO Tourism Highlights, 2014 Edition |
3 |
|
International Tourist Arrivals
Demand exceeded expectations in 2013
International tourist arrivals (overnight visitors) grew by 5% in 2013, reaching a record 1087 million arrivals worldwide, up from 1035 million in 2012, when the 1 billion mark was exceeded for the first time ever. Despite a global economy in ‘low gear’, demand for international tourism exceeded expectations, with an additional 52 million international tourists travelling internationally in 2013.
Europe led the growth in absolute terms, welcoming 29 million more international tourists in 2013, and raising the total to 563 million. Growth (+5%) was double the region’s average for the period 2005-2012 (+2.5% a year).
Asia and the Pacific recorded the fastest relative growth across all UNWTO regions, with a 6% increase in international arrivals, or 14 million more than in 2012. Africa saw an increase of 5%, equivalent to 3 million more tourists, reaching 56 million.
In the Americas, international arrivals grew by 3% to 168 million, or an increase of five million. The Middle East (0%) has not yet succeeded in returning to growth, even though some destinations performed rather well and others saw a moderate recovery.
Growth is expected to continue in 2014 at a sustained rate of 4.0% to 4.5% worldwide. By UNWTO region, prospects for 2014 are strongest for Asia and the Pacific (+5% to +6%) and Africa (+4% to +6%), followed by Europe and the Americas (both +3% to +4%). In the Middle East (0% to +5%) prospects are positive yet volatile.
Inbound tourism by mode of transport, 2013* |
(share) |
Road Air 40% 53%
Rail 2%
Water 5%
Source: World Tourism Organization (UNWTO) ©
Most travel by air and for leisure purposes
Slightly over half of all travellers arrived at their destination by air (53%) in 2013, while the remainder travelled by surface transport (47%) – whether by road (40%), rail (2%) or over water (5%).
Over time, the trend has been for air transport to grow at a somewhat faster pace than surface transport, so the share of air transport is gradually increasing.
|
|
|
International Tourist Arrivals |
|
|
Market |
Change |
Average annual |
|||
|
|
|
|
(million) |
|
|
|
share (%) |
|
(%) |
growth (%) |
|
1990 |
1995 |
2000 |
2005 |
2010 |
2012 |
2013* |
2013* |
12/11 |
13*/12 |
'05-'13* |
World |
434 |
528 |
677 |
807 |
948 |
1,035 |
1,087 |
100 |
4.1 |
5.0 |
3.8 |
Advanced economies¹ |
296 |
334 |
421 |
459 |
506 |
551 |
581 |
53.4 |
3.8 |
5.4 |
3.0 |
Emerging economies¹ |
139 |
193 |
256 |
348 |
442 |
484 |
506 |
46.6 |
4.4 |
4.5 |
4.8 |
By UNWTO regions: |
|
|
|
|
|
|
|
|
|
|
|
Europe |
261.1 |
304.0 |
388.2 |
448.9 |
484.8 |
534.4 |
563.4 |
51.8 |
3.6 |
5.4 |
2.9 |
Northern Europe |
28.2 |
35.8 |
46.6 |
60.4 |
62.7 |
65.1 |
68.9 |
6.3 |
0.9 |
5.8 |
1.6 |
Western Europe |
108.6 |
112.2 |
139.7 |
141.7 |
154.4 |
167.2 |
174.3 |
16.0 |
3.5 |
4.2 |
2.6 |
Central/Eastern Europe |
33.9 |
58.1 |
69.3 |
90.4 |
94.5 |
111.7 |
118.9 |
10.9 |
8.3 |
6.5 |
3.5 |
Southern/Mediter. Eu. |
90.3 |
98.0 |
132.6 |
156.4 |
173.3 |
190.4 |
201.4 |
18.5 |
1.9 |
5.7 |
3.2 |
- of which EU-28 |
229.7 |
267.3 |
332.3 |
363.8 |
380.0 |
412.2 |
432.7 |
39.8 |
2.7 |
5.0 |
2.2 |
Asia and the Pacific |
55.8 |
82.0 |
110.1 |
153.5 |
204.9 |
233.5 |
248.1 |
22.8 |
6.9 |
6.2 |
6.2 |
North-East Asia |
26.4 |
41.3 |
58.3 |
85.9 |
111.5 |
122.8 |
127.0 |
11.7 |
6.0 |
3.5 |
5.0 |
South-East Asia |
21.2 |
28.4 |
36.1 |
48.5 |
70.0 |
84.2 |
93.1 |
8.6 |
8.7 |
10.5 |
8.5 |
Oceania |
5.2 |
8.1 |
9.6 |
10.9 |
11.4 |
11.9 |
12.5 |
1.1 |
4.0 |
4.7 |
1.7 |
South Asia |
3.1 |
4.2 |
6.1 |
8.1 |
12.0 |
14.6 |
15.5 |
1.4 |
6.2 |
6.1 |
8.4 |
Americas |
92.8 |
109.1 |
128.2 |
133.3 |
150.6 |
162.7 |
167.9 |
15.5 |
4.3 |
3.2 |
2.9 |
North America |
71.8 |
80.7 |
91.5 |
89.9 |
99.5 |
106.4 |
110.1 |
10.1 |
4.2 |
3.5 |
2.6 |
Caribbean |
11.4 |
14.0 |
17.1 |
18.8 |
19.5 |
20.7 |
21.2 |
2.0 |
3.0 |
2.4 |
1.5 |
Central America |
1.9 |
2.6 |
4.3 |
6.3 |
7.9 |
8.9 |
9.2 |
0.8 |
7.3 |
3.7 |
4.9 |
South America |
7.7 |
11.7 |
15.3 |
18.3 |
23.6 |
26.7 |
27.4 |
2.5 |
5.0 |
2.6 |
5.2 |
Africa |
14.7 |
18.7 |
26.2 |
34.8 |
49.9 |
52.9 |
55.8 |
5.1 |
6.6 |
5.4 |
6.1 |
North Africa |
8.4 |
7.3 |
10.2 |
13.9 |
18.8 |
18.5 |
19.6 |
1.8 |
8.2 |
6.1 |
4.4 |
Subsaharan Africa |
6.3 |
11.5 |
16.0 |
20.9 |
31.2 |
34.5 |
36.2 |
3.3 |
5.8 |
5.0 |
7.1 |
Middle East |
9.6 |
13.7 |
24.1 |
36.3 |
58.2 |
51.7 |
51.6 |
4.7 |
-5.4 |
-0.2 |
4.5 |
Source: World Tourism Organization (UNWTO) © |
|
|
|
|
|
|
|
|
(Data as collected by UNWTO May 2014) |
||
¹ Classication based on the International Monetary Fund (IMF), see the Statistical Annex of the IMF World Economic Outlook of April 2012, page 177, at www.imf.org/external/pubs/ft/weo/2012/01.
4UNWTO Tourism Highlights, 2014 Edition

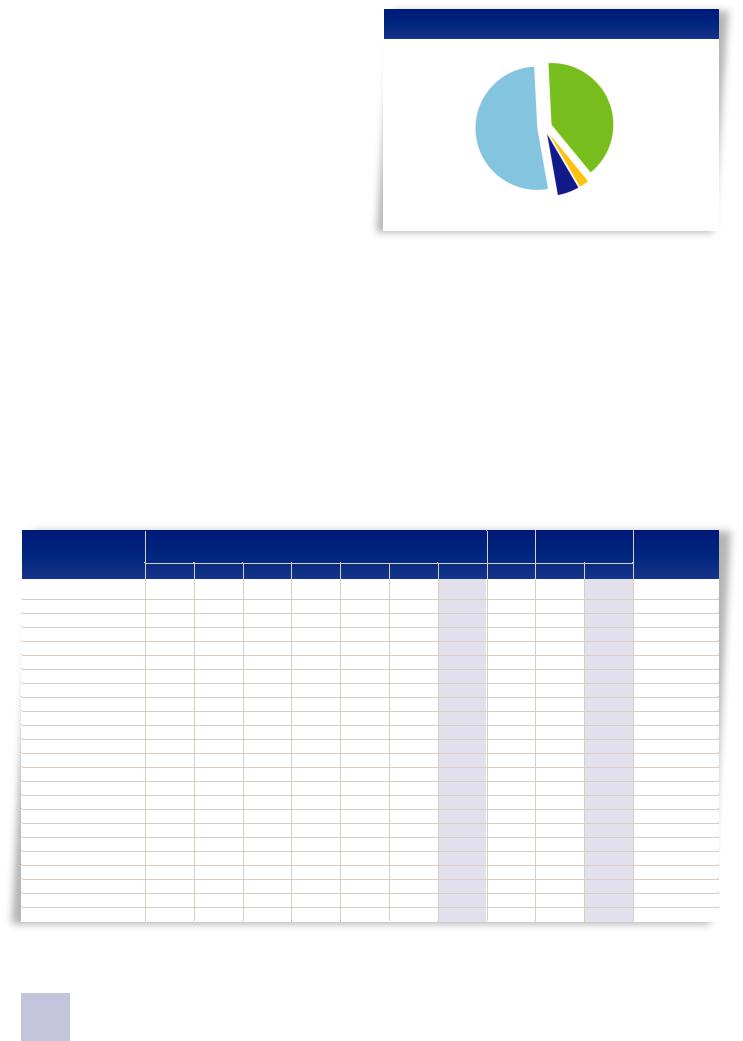
Inbound tourism by purpose of visit, 2013* |
(share) |
|
Leisure, recreation |
VFR, health, |
|
and holidays |
religion, other |
|
52% |
27% |
|
Business and professional 14%
Not specified 7%
Source: World Tourism Organization (UNWTO) ©
In 2013, travel for holidays, recreation and other forms of leisure accounted for just over half of all international tourist arrivals (52% or 568 million). Some 14% of international tourists reported travelling for business and professional purposes and another 27% travelled for other reasons, such as visiting friends and relatives (VFR), religious reasons and pilgrimages, health treatment, etc. The purpose of visit for the remaining 7% of arrivals was not specified.
|
|
International Tourism Receipts |
|
|
|
Local currencies, constant prices (% change) |
|||
|
10/09 |
11/10 |
12/11 |
13*/12 |
World |
5.2 |
4.5 |
4.2 |
5.3 |
Advanced economies¹ |
5.8 |
5.9 |
4.0 |
6.0 |
Emerging economies¹ |
4.0 |
2.1 |
4.5 |
4.0 |
By UNWTO regions: |
|
|
|
|
Europe |
-0.2 |
4.9 |
1.9 |
3.8 |
Northern Europe |
3.4 |
2.4 |
3.3 |
7.1 |
Western Europe |
1.4 |
3.9 |
2.7 |
1.7 |
Central/Eastern Europe |
-3.5 |
6.8 |
4.0 |
3.4 |
Southern/Mediter. Eu. |
-1.9 |
6.1 |
0.0 |
4.5 |
- of which EU-28 |
0.9 |
4.0 |
1.7 |
3.4 |
Asia and the Pacific |
14.9 |
8.3 |
6.7 |
8.2 |
North-East Asia |
21.4 |
9.2 |
7.9 |
9.3 |
South-East Asia |
15.0 |
12.9 |
10.6 |
9.7 |
Oceania |
-3.0 |
-4.1 |
-1.3 |
1.9 |
South Asia |
10.7 |
11.6 |
-0.6 |
5.3 |
Americas |
4.2 |
5.1 |
5.7 |
6.4 |
North America |
6.0 |
5.9 |
6.7 |
7.8 |
Caribbean |
0.7 |
-1.5 |
1.2 |
2.1 |
Central America |
0.3 |
9.7 |
7.5 |
3.2 |
South America |
-2.2 |
5.7 |
3.2 |
3.2 |
Africa |
2.6 |
1.7 |
7.3 |
0.0 |
North Africa |
0.2 |
-5.5 |
9.1 |
-1.4 |
Subsaharan Africa |
3.8 |
5.0 |
6.5 |
0.6 |
Middle East |
16.3 |
-17.2 |
2.2 |
-1.9 |
Source: World Tourism Organization (UNWTO) ©
International Tourism Receipts
Growth in receipts equals growth in international arrivals
In 2013, international tourism receipts in destinations around the world grew 5% in real terms (taking into account exchange rate fluctuations and inflation) to reach US$ 1159 billion
(euro 873 bn). Growth in receipts mirrored the growth in international arrivals (also +5%), confirming the strong correlation between these two key indicators of international tourism.
In absolute terms, receipts increased by US$ 81 billion (euro 34 billion, comparatively less due to the depreciation of
the dollar). Europe, which accounts for 42% of all international tourism receipts, saw the largest growth in 2013: up US$
35 billion to US$ 489 billion (euro 368 billion), boosted partly by a stronger euro. Destinations in Asia and the Pacific (accounting for 31% of worldwide receipts) increased earnings by US$
30 billion to US$ 359 billion (euro 270 bn). In the Americas (20% share), receipts increased by US$ 16 billion to US$ 229 billion (euro 173 bn). In the Middle East (4% share) international tourism receipts are estimated at US$ 47 billion (euro 36 bn) and in Africa (3% share) at US$ 34 billion (euro 26 bn).
In relative terms, Asia and the Pacific (+8%) recorded the largest increase in receipts, followed by the Americas (+6%) and Europe (+4%). Africa posted flat results while receipts in the Middle East were down 2% compared to 2012.
International tourism receipts are the earnings generated in destination countries from expenditure on accommodation, food
Market |
|
Receipts (US$) |
|
|
Receipts (euro) |
|
share (%) |
|
(billion) |
per arrival |
|
(billion) |
per arrival |
2013* |
2012 |
2013* |
2013* |
2012 |
2013* |
2013* |
100 |
1,078 |
1,159 |
1,070 |
839 |
873 |
800 |
64.3 |
688 |
745 |
1,280 |
536 |
561 |
970 |
35.7 |
390 |
413 |
820 |
303 |
311 |
610 |
42.2 |
454.0 |
489.3 |
870 |
353.4 |
368.4 |
650 |
6.4 |
67.6 |
74.2 |
1,080 |
52.6 |
55.9 |
810 |
14.5 |
157.9 |
167.9 |
960 |
122.9 |
126.4 |
730 |
5.2 |
56.3 |
59.9 |
500 |
43.8 |
45.1 |
380 |
16.2 |
172.2 |
187.3 |
930 |
134.0 |
141.0 |
700 |
34.8 |
374.2 |
402.9 |
930 |
291.2 |
303.4 |
700 |
31.0 |
329.1 |
358.9 |
1,450 |
256.1 |
270.3 |
1,090 |
15.9 |
167.2 |
184.7 |
1,450 |
130.1 |
139.0 |
1,090 |
9.3 |
96.0 |
107.4 |
1,150 |
74.7 |
80.9 |
870 |
3.7 |
43.0 |
42.6 |
3,410 |
33.4 |
32.0 |
2,570 |
2.1 |
22.9 |
24.3 |
1,570 |
17.8 |
18.3 |
1,180 |
19.8 |
212.9 |
229.2 |
1,360 |
165.7 |
172.6 |
1,030 |
14.8 |
156.4 |
171.0 |
1,550 |
121.7 |
128.8 |
1,170 |
2.1 |
24.2 |
24.8 |
1,170 |
18.8 |
18.7 |
880 |
0.8 |
8.7 |
9.4 |
1,020 |
6.8 |
7.1 |
770 |
2.1 |
23.6 |
23.9 |
870 |
18.4 |
18.0 |
660 |
3.0 |
34.3 |
34.2 |
610 |
26.7 |
25.8 |
460 |
0.9 |
10.0 |
10.2 |
520 |
7.8 |
7.7 |
390 |
2.1 |
24.3 |
24.0 |
660 |
18.9 |
18.1 |
500 |
4.1 |
47.5 |
47.3 |
920 |
36.9 |
35.6 |
690 |
(Data as collected by UNWTO May 2014)
¹ Classication based on the International Monetary Fund (IMF), see the Statistical Annex of the IMF World Economic Outlook of April 2012, page 177, at www.imf.org/external/pubs/ft/weo/2012/01.
UNWTO Tourism Highlights, 2014 Edition |
5 |
|

|
1990 |
1995 |
2000 |
2005 |
2006 |
2007 |
2008 |
2009 |
2010 |
2011 |
2012 |
2013* |
11/10 |
12/11 |
13*/12 |
11/10 |
12*/11 |
13*/12 |
International Tourist Arrivals (overnight visitors) |
|
|
|
|
|
|
|
|
|
|
|
Change (%) |
|
|
||||
Million |
434 |
528 |
677 |
807 |
853 |
908 |
926 |
890 |
948 |
995 |
1,035 |
1,087 |
|
|
|
4.9 |
4.1 |
5.0 |
Index (2008=100) |
|
|
|
|
|
|
100 |
96 |
102 |
107 |
112 |
117 |
|
|
|
|
|
|
International Tourism Receipts |
|
|
|
|
|
|
|
|
|
|
|
Current prices (%) |
Constant prices (%) |
|||||
Local currencies |
|
|
|
|
|
|
|
|
|
|
|
|
8.7 |
7.4 |
7.8 |
4.5 |
4.2 |
5.3 |
Index (2008=100) (constant prices) |
|
|
|
|
100 |
95 |
99 |
104 |
108 |
114 |
|
|
|
|
|
|
||
US$ billion |
262 |
403 |
476 |
681 |
747 |
861 |
944 |
856 |
931 |
1,042 |
1,078 |
1,159 |
12.0 |
3.4 |
7.5 |
8.6 |
1.3 |
6.0 |
Euro billion |
206 |
308 |
515 |
548 |
595 |
629 |
641 |
614 |
702 |
749 |
839 |
873 |
6.7 |
12.0 |
4.0 |
3.8 |
9.3 |
2.6 |
Source: World Tourism Organization (UNWTO) © |
|
|
|
|
|
|
|
|
|
|
(Data as collected by UNWTO May 2014) |
|||||||
and drink, local transport, entertainment, shopping and other services and goods. In macro-economic terms, expenditure by international visitors counts as exports for the destination country and as imports for the country of residency of the visitor. In the Balance of Payments, receipts from inbound tourism are reported as ‘travel credit’ under the services balance and expenditure on outbound tourism as ‘travel debit’. For many countries tourism is a vital source of foreign currency earnings and an important contributor to the economy, creating much needed employment and opportunities for development.
Apart from receipts in destinations, tourism also generates export earnings through international passenger transport services (rendered to non-residents). In 2013, the export value of the latter is estimated at US$ 218 billion, bringing total tourism export earnings to US$ 1.4 trillion (euro 1.0 trillion), or US$
3.8 billion (euro 2.8 billion) a day on average.
International tourism (travel and passenger transport) accounts for 29% of the world’s exports of services and 6% of overall exports of goods and services. As a worldwide export category, tourism ranks fifth after fuels, chemicals, food and automotive products, while ranking first in many developing countries.
World’s Top Tourism Destinations
Only minor changes in the top 10 by arrivals and receipts
Only two changes took place in the top 10 rankings by international tourist arrivals and tourism receipts in 2013. In the ranking by arrivals, Spain (with 61 million arrivals) regained the third position it had lost in 2010 to China (56 million). Thailand
International Tourist Arrivals
|
|
|
|
Million |
Change (%) |
|
Rank |
Series1 |
2012 |
2013* |
12/11 |
13*/12 |
|
1 |
France |
TF |
83.0 |
.. |
1.8 |
.. |
2 |
United States |
TF |
66.7 |
69.8 |
6.3 |
4.7 |
3 |
Spain |
TF |
57.5 |
60.7 |
2.3 |
5.6 |
4 |
China |
TF |
57.7 |
55.7 |
0.3 |
-3.5 |
5 |
Italy |
TF |
46.4 |
47.7 |
0.5 |
2.9 |
6 |
Turkey |
TF |
35.7 |
37.8 |
3.0 |
5.9 |
7 |
Germany |
TCE |
30.4 |
31.5 |
7.3 |
3.7 |
8 |
United Kingdom |
TF |
29.3 |
31.2 |
-0.1 |
6.4 |
9 |
Russian Federation |
TF |
25.7 |
28.4 |
13.5 |
10.2 |
10 |
Thailand |
TF |
22.4 |
26.5 |
16.2 |
18.8 |
Source: World Tourism Organization (UNWTO) © ¹ See note on page 9
entered the top 10 arrivals ranking at number 10, climbing an amazing five positions, while it moved up two places to 7th in the ranking by tourism receipts.
When ranking the world’s top international tourism destinations, it is preferable to take more than a single indicator into account. Ranked according to the two key tourism indicators
– international tourist arrivals and international tourism receipts – it is interesting to note that eight of the top ten destinations appear on both lists, despite showing marked differences in terms of the type of tourists they attract, as well as in average length of stay and spending per trip and per night. In the case of international tourism receipts, changes not only reflect relative performance, but also (to a considerable extent) exchange rate fluctuations between national currencies and the US dollar.
France continues to top the ranking of international tourist arrivals with 83 million visitors in 2012 (2013 still to be reported), and is 3rd in international tourism receipts (US$ 56 billion in 2013). The United States ranks 1st in receipts with US$ 140 billion and 2nd in arrivals with 70 million. Spain is still the second largest earner worldwide and the first in Europe (US$ 60 billion), and recovered its 3rd place in arrivals with 61 million visitors. China moved to 4th in arrivals
(56 million) and remains 4th in receipts (US$ 52 billion). Italy has consolidated its 5th place in arrivals (48 million) and 6th in receipts (US$ 44 billion). Turkey remains 6th in arrivals and 12th in receipts.
Thailand moved up two positions in the ranking by international receipts to 7th, while it entered the top 10 by arrivals in 10th position, in a bumper 2013 when international arrivals were up by 19% to 27 million and receipts by 23% to US$ 42 billion. Germany and the United Kingdom remain respectively 7th and 8th in arrivals, but moved down one place each in terms of earnings to 8th and 9th places respectively. The Russian Federation completes the top ten ranking by arrivals in 9th place, while the two Chinese Special Administrative Regions Macao and Hong Kong rank respectively 5th and 10th in receipts.
International Tourism Receipts |
|
|
|
|
|
||
|
|
|
US$ |
|
Local currencies |
||
|
|
Billion |
Change (%) |
Change (%) |
|||
Rank |
2012 |
2013* |
12/11 |
13*/12 |
12/11 |
13*/12 |
|
1 |
United States |
126.2 |
139.6 |
9.2 |
10.6 |
9.2 |
10.6 |
2 |
Spain |
56.3 |
60.4 |
-6.3 |
7.4 |
1.5 |
3.9 |
3 |
France |
53.6 |
56.1 |
-2.2 |
4.8 |
6.0 |
1.3 |
4 |
China |
50.0 |
51.7 |
3.2 |
3.3 |
0.8 |
1.4 |
5 |
Macao (China) |
43.7 |
51.6 |
13.7 |
18.1 |
13.2 |
18.1 |
6 |
Italy |
41.2 |
43.9 |
-4.2 |
6.6 |
3.8 |
3.1 |
7 |
Thailand |
33.8 |
42.1 |
24.4 |
24.4 |
26.7 |
23.1 |
8 |
Germany |
38.1 |
41.2 |
-1.9 |
8.1 |
6.3 |
4.5 |
9 |
United Kingdom |
36.2 |
40.6 |
3.3 |
12.1 |
4.8 |
13.2 |
10 |
Hong Kong (China) |
33.1 |
38.9 |
16.2 |
17.7 |
15.8 |
17.7 |
(Data as collected by UNWTO May 2014)
6UNWTO Tourism Highlights, 2014 Edition

Regional Results
Europe – a surprisingly strong 2013
International tourist arrivals in Europe were up by a solid 5% in 2013, an increase of 29 million on 2012 to a total of 563 million. As the most visited region in the world with 52% of all international arrivals and comprising many comparatively mature destinations, a growth rate of 5% in Europe is remarkable. Tourism receipts grew by 4% in real terms, reaching US$ 489 billion (euro 368 billion), accounting for 42% of receipts worldwide.
By subregion, the highest growth was recorded in Central and Eastern Europe, with 7% more arrivals in 2013. Many destinations recorded double-digit growth, especially smaller ones such as Georgia and Belarus (both +15%), Armenia (+14%) and Kazakhstan (+11%). while the subregion’s largest destination, the Russian Federation, reported a robust 10% increase. Ukraine and Poland (both +7%) consolidated their healthy growth of 2012 when they hosted the UEFA European football Championship.
Growth in absolute terms was led by Southern and Mediterranean Europe, which reported some 11 million more international arrivals (+6%) in 2013. The subregion’s largest destination Spain recorded a sound 6% increase in arrivals to 61 million. Other major destinations such as Greece (+16%), Portugal (+8%), Turkey (+6%) and Croatia (+6%) also saw robust growth last year.
Northern Europe posted a 6% increase in arrivals with smaller destination Iceland recording the highest relative growth (+20%). Norway (+8%) also saw robust growth, while the United Kingdom, the subregion’s leading destination, reported a 6% increase in arrivals.
In Western Europe international arrivals grew by 4%. France reported an 8% increase in international arrivals to accommodation establishments (2013 data on arrivals at
frontiers still pending). The Netherlands, Switzerland (both +5%), Germany (+4%) and Austria (3%) also reported healthy figures, while Belgium saw a modest 1% increase.
Asia and the Pacific – fourth consecutive year of robust growth
Asia and the Pacific welcomed 248 million international tourists in 2013, 15 million more than in 2012. This represents an increase of 6% compared to 2012, making it the fastest growing region last year in relative terms. In terms of tourism earnings, the region recorded US$ 359 billion, up US$ 30 billion from 2012 (+8% in real terms). While arrivals in the region accounted for 23% of the world’s total, receipts in the region accounted for 31%.
As in 2012, South-East Asia was again the fastest growing subregion both in the region and in the world in 2013, with an increase of 11% in international tourist arrivals on the back of buoyant intraregional demand. Thailand reported strong growth (+19%), welcoming 27 million tourists, 4 million more than in 2012. Among the smaller destinations, Myanmar has seen a
surge in tourist arrivals in the last few years and recorded an extraordinary 52% increase in 2013. Timor-Leste (+42%) and Cambodia (+18%) also enjoyed high growth rates, as well as Vietnam (+11%), the Philippines (+10%) and Indonesia (+9%).
South Asia (+6%) also showed solid growth last year as Sri Lanka welcomed 27% more tourists and Maldives 17%. The subregion’s largest destination India (7 million arrivals) posted 4% growth.
North-East Asia, the largest subregion in Asia and the Pacific with over half of all international arrivals in the region, saw a 4% increase last year. Japan (+24%) led this growth, reporting over 10 million arrivals for the first time ever. Taiwan (pr. of China) (+10%) and the Republic of Korea (+9%) also experienced robust growth, as did the two Chinese Special Administrative Regions Hong Kong (+8%) and Macao (+5%). China itself, however, the region’s top destination, saw a decline of 4% in arrivals compared to 2012.
Oceania saw an increase of 5% in tourist arrivals last year, with leading destination Australia posting 6% growth.
The Americas – solid second half of 2013 after slow start
The Americas received 5 million additional international arrivals in 2013 (+3%), reaching a total of 168 million. The region had a slow start of the year, but growth picked up throughout the second half. International tourism receipts in the region reached US$ 229 billion, an increase of 6% in real terms. The region maintained its share of worldwide arrivals at 15%, while its share of receipts was at 20%.
North America, the largest subregion accounting for some two-thirds of international arrivals in the region, saw 3% growth. The United States recorded a solid 5% increase whereas Canada posted 2% and Mexico 1% growth in tourist arrivals.
In Central America (+4%) all destinations reported consistent growth, with Costa Rica, El Salvador and Nicaragua (all +4%) around the subregion’s average. Belize (+6%) and Honduras (+5%) grew somewhat faster and Guatemala and Panama (both +3%) slightly slower.
Growth in South America (+3%) was in line with the region’s average. Peru (+11%) recorded double-digit growth while Ecuador (+7%), Paraguay and Colombia (both +5%) all posted sound results. Arrival data for Brazil, the subregion’s largest destination, is not yet available but receipt figures indicate a rather flat trend.
The Caribbean registered a modest 2% increase in arrivals in 2013. Among the larger destinations, Puerto Rico (+4%) and the Dominican Republic (+3%) saw growth above the subregional average. Smaller destinations such as Aruba (+8%), the Cayman Islands, Anguilla (both +7%) and Curaçao (+5%) also reported healthy growth. After a decline in 2012, Haiti reported a solid 20% increase in arrivals.
UNWTO Tourism Highlights, 2014 Edition |
7 |
|
|
|
|
|
International Tourist Arrivals |
|
|
|
International Tourism Receipts |
|
||||||
Destinations |
|
|
(1000) |
|
|
Change (%) |
|
Share (%) |
|
(US$ million) |
|
Share (%) |
|||
|
Series1 |
2010 |
2011 |
2012 |
2013* |
11/10 |
12/11 |
|
13*/12 |
2013* |
2010 |
2011 |
2012 |
2013* |
2013* |
Europe |
|
484,842 |
516,020 |
534,376 |
563,441 |
6.4 |
3.6 |
|
5.4 |
100 |
411,361 |
464,733 |
454,047 |
489,253 |
100 |
Northern Europe |
|
62,654 |
64,480 |
65,088 |
68,862 |
2.9 |
0.9 |
|
5.8 |
12.2 |
59,353 |
66,323 |
67,631 |
74,210 |
14.3 |
Denmark |
TF |
8,744 |
7,864 |
8,068 |
.. |
-10.1 |
2.6 |
|
.. |
.. |
5,853 |
6,783 |
6,566 |
6,967 |
1.5 |
Finland |
TF |
3,670 |
4,192 |
4,226 |
.. |
14.2 |
0.8 |
|
.. |
.. |
3,051 |
3,820 |
3,881 |
4,017 |
0.8 |
Iceland |
TF |
489 |
566 |
673 |
808 |
15.8 |
19.0 |
|
20.1 |
0.1 |
561 |
750 |
863 |
1,055 |
0.2 |
Ireland |
TF |
7,134 |
7,630 |
7,550 |
.. |
7.0 |
-1.0 |
|
.. |
.. |
4,118 |
4,190 |
3,883 |
4,429 |
0.9 |
Norway |
TF/TCE |
4,767 |
4,963 |
4,375 |
4,734 |
4.1 |
-11.9 |
|
8.2 |
0.8 |
4,707 |
5,308 |
5,442 |
5,661 |
1.2 |
Sweden |
TCE/TF |
4,951 |
9,959 |
10,914 |
.. |
101.1 |
9.6 |
|
.. |
.. |
8,663 |
10,404 |
10,768 |
11,485 |
2.3 |
United Kingdom |
TF |
28,296 |
29,306 |
29,282 |
31,169 |
3.6 |
-0.1 |
|
6.4 |
5.5 |
32,401 |
35,069 |
36,228 |
40,597 |
8.3 |
Western Europe |
|
154,374 |
161,477 |
167,193 |
174,276 |
4.6 |
3.5 |
|
4.2 |
30.9 |
144,159 |
162,885 |
157,934 |
167,861 |
34.3 |
Austria |
TCE |
22,004 |
23,012 |
24,151 |
24,813 |
4.6 |
4.9 |
|
2.7 |
4.4 |
18,596 |
19,860 |
18,894 |
20,106 |
4.1 |
Belgium |
TCE |
7,186 |
7,494 |
7,591 |
7,642 |
4.3 |
1.3 |
|
0.7 |
1.4 |
12,146 |
13,114 |
13,014 |
13,500 |
2.8 |
France |
TF |
77,648 |
81,550 |
83,013 |
.. |
5.0 |
1.8 |
|
.. |
.. |
47,013 |
54,753 |
53,550 |
56,098 |
11.5 |
Germany |
TCE |
26,875 |
28,352 |
30,407 |
31,545 |
5.5 |
7.3 |
|
3.7 |
5.6 |
34,679 |
38,879 |
38,136 |
41,211 |
8.4 |
Liechtenstein |
TCE |
64 |
67 |
62 |
60 |
4.2 |
-6.9 |
|
-4.4 |
0.0 |
.. |
.. |
.. |
.. |
.. |
Luxembourg |
TCE |
805 |
873 |
905 |
.. |
8.4 |
3.7 |
|
.. |
.. |
4,119 |
4,831 |
4,617 |
4,819 |
1.0 |
Monaco |
THS |
279 |
295 |
292 |
.. |
5.6 |
-1.0 |
|
.. |
.. |
.. |
.. |
.. |
.. |
.. |
Netherlands |
TCE |
10,883 |
11,300 |
12,205 |
12,797 |
3.8 |
8.0 |
|
4.9 |
2.3 |
12,883 |
14,348 |
13,743 |
15,580 |
3.2 |
Switzerland |
THS |
8,628 |
8,534 |
8,566 |
8,967 |
-1.1 |
0.4 |
|
4.7 |
1.6 |
14,724 |
17,100 |
15,979 |
16,547 |
3.4 |
Central/Eastern Europe |
94,497 |
103,133 |
111,655 |
118,944 |
9.1 |
8.3 |
|
6.5 |
21.1 |
48,082 |
56,024 |
56,297 |
59,928 |
12.2 |
|
Armenia |
TF |
687 |
758 |
843 |
957 |
10.3 |
11.3 |
|
13.5 |
0.2 |
411 |
448 |
454 |
458 |
0.1 |
Azerbaijan |
TF |
1,280 |
1,562 |
1,986 |
.. |
22.0 |
27.1 |
|
.. |
.. |
657 |
1,287 |
2,433 |
2,365 |
0.5 |
Belarus |
TF |
120 |
116 |
119 |
137 |
-3.3 |
2.3 |
|
15.2 |
0.0 |
440 |
487 |
685 |
722 |
0.1 |
Bulgaria |
TF |
6,047 |
6,328 |
6,541 |
6,897 |
4.6 |
3.4 |
|
5.5 |
1.2 |
3,637 |
3,967 |
3,748 |
4,059 |
0.8 |
Czech Rep |
TF |
8,629 |
9,019 |
9,461 |
9,004 |
4.5 |
4.9 |
|
-4.8 |
1.6 |
7,121 |
7,628 |
7,035 |
7,050 |
1.4 |
Estonia |
TF |
2,372 |
2,665 |
2,744 |
2,868 |
12.4 |
3.0 |
|
4.5 |
0.5 |
1,073 |
1,249 |
1,226 |
1,393 |
0.3 |
Georgia |
TF |
1,067 |
1,319 |
1,790 |
2,065 |
23.6 |
35.7 |
|
15.4 |
0.4 |
659 |
955 |
1,411 |
1,720 |
0.4 |
Hungary |
TF |
9,510 |
10,250 |
10,353 |
10,675 |
7.8 |
1.0 |
|
3.1 |
1.9 |
5,381 |
5,580 |
4,845 |
5,107 |
1.0 |
Kazakhstan |
TF |
3,393 |
4,093 |
4,438 |
4,926 |
20.6 |
8.4 |
|
11.0 |
0.9 |
1,005 |
1,209 |
1,347 |
1,460 |
0.3 |
Kyrgyzstan |
TF/VF |
855 |
2,278 |
2,406 |
.. |
166.4 |
5.6 |
|
.. |
.. |
284 |
640 |
435 |
.. |
.. |
Latvia |
TF |
1,373 |
1,493 |
1,435 |
1,536 |
8.7 |
-3.9 |
|
7.0 |
0.3 |
640 |
771 |
745 |
864 |
0.2 |
Lithuania |
TF |
1,507 |
1,775 |
1,900 |
.. |
17.8 |
7.0 |
|
.. |
.. |
958 |
1,323 |
1,317 |
1,467 |
0.3 |
Poland |
TF |
12,470 |
13,350 |
14,840 |
15,845 |
7.1 |
11.2 |
|
6.8 |
2.8 |
9,526 |
10,683 |
10,938 |
10,938 |
2.2 |
Rep Moldova |
TCE |
64 |
75 |
89 |
96 |
17.9 |
18.6 |
|
7.5 |
0.0 |
173 |
195 |
213 |
226 |
0.0 |
Romania |
TCE |
1,343 |
1,515 |
1,653 |
1,715 |
12.8 |
9.1 |
|
3.7 |
0.3 |
1,140 |
1,418 |
1,468 |
1,438 |
0.3 |
Russian Federation |
TF |
20,262 |
22,674 |
25,727 |
28,356 |
11.9 |
13.5 |
|
10.2 |
5.0 |
8,831 |
11,328 |
10,759 |
11,988 |
2.5 |
Slovakia |
TCE |
1,327 |
1,460 |
1,528 |
1,653 |
10.1 |
4.6 |
|
8.2 |
0.3 |
2,233 |
2,429 |
2,299 |
2,556 |
0.5 |
Tajikistan |
TF |
.. |
.. |
.. |
.. |
.. |
.. |
|
.. |
.. |
4 |
3 |
3 |
.. |
.. |
Turkmenistan |
TF |
.. |
.. |
.. |
.. |
.. |
.. |
|
.. |
.. |
.. |
.. |
.. |
.. |
.. |
Ukraine |
TF |
21,203 |
21,415 |
23,013 |
24,671 |
1.0 |
7.5 |
|
7.2 |
4.4 |
3,788 |
4,294 |
4,842 |
5,083 |
1.0 |
Uzbekistan |
TF |
975 |
.. |
.. |
.. |
.. |
.. |
|
.. |
.. |
121 |
.. |
.. |
.. |
.. |
Southern/Mediter. Eu. |
|
173,317 |
186,930 |
190,441 |
201,359 |
7.9 |
1.9 |
|
5.7 |
35.7 |
159,767 |
179,502 |
172,185 |
187,254 |
38.3 |
Albania |
TF |
2,191 |
2,468 |
3,156 |
.. |
12.6 |
27.9 |
|
.. |
.. |
1,626 |
1,628 |
1,471 |
1,470 |
0.3 |
Andorra |
TF |
1,808 |
2,242 |
2,238 |
2,329 |
24.0 |
-0.2 |
|
4.1 |
0.4 |
.. |
.. |
.. |
.. |
.. |
Bosnia & Herzg |
TCE |
365 |
392 |
439 |
529 |
7.2 |
11.9 |
|
20.5 |
0.1 |
594 |
631 |
622 |
689 |
0.1 |
Croatia |
TCE |
9,111 |
9,927 |
10,369 |
10,955 |
9.0 |
4.5 |
|
5.7 |
1.9 |
8,259 |
9,211 |
8,812 |
9,555 |
2.0 |
Cyprus |
TF |
2,173 |
2,392 |
2,465 |
2,405 |
10.1 |
3.0 |
|
-2.4 |
0.4 |
2,108 |
2,570 |
2,599 |
2,917 |
0.6 |
F. Yug. Rp. Macedonia TCE |
262 |
327 |
351 |
400 |
25.1 |
7.3 |
|
13.8 |
0.1 |
197 |
240 |
234 |
267 |
0.1 |
|
Greece |
TF |
15,007 |
16,427 |
15,518 |
17,923 |
9.5 |
-5.5 |
|
15.5 |
3.2 |
12,742 |
14,623 |
13,416 |
15,930 |
3.3 |
Israel |
TF |
2,803 |
2,820 |
2,886 |
2,962 |
0.6 |
2.3 |
|
2.6 |
0.5 |
5,106 |
5,305 |
5,494 |
5,667 |
1.2 |
Italy |
TF |
43,626 |
46,119 |
46,360 |
47,704 |
5.7 |
0.5 |
|
2.9 |
8.5 |
38,786 |
43,000 |
41,185 |
43,912 |
9.0 |
Malta |
TF |
1,339 |
1,415 |
1,443 |
1,582 |
5.7 |
2.0 |
|
9.6 |
0.3 |
1,079 |
1,268 |
1,270 |
1,403 |
0.3 |
Montenegro |
TCE |
1,088 |
1,201 |
1,264 |
1,324 |
10.4 |
5.3 |
|
4.8 |
0.2 |
732 |
862 |
826 |
884 |
0.2 |
Portugal |
TCE |
6,832 |
7,412 |
7,685 |
8,324 |
8.5 |
3.7 |
|
8.3 |
1.5 |
10,077 |
11,339 |
11,056 |
12,284 |
2.5 |
San Marino |
THS |
120 |
156 |
139 |
.. |
30.3 |
-10.9 |
|
.. |
.. |
.. |
.. |
.. |
.. |
.. |
Serbia |
TCE |
683 |
764 |
810 |
922 |
11.9 |
6.0 |
|
13.8 |
0.2 |
798 |
992 |
906 |
1,053 |
0.2 |
Slovenia |
TCE |
1,869 |
2,037 |
2,156 |
2,259 |
9.0 |
5.8 |
|
4.8 |
0.4 |
2,552 |
2,749 |
2,685 |
2,791 |
0.6 |
Spain |
TF |
52,677 |
56,177 |
57,464 |
60,661 |
6.6 |
2.3 |
|
5.6 |
10.8 |
52,525 |
60,031 |
56,263 |
60,435 |
12.4 |
Turkey |
TF |
31,364 |
34,654 |
35,698 |
37,795 |
10.5 |
3.0 |
|
5.9 |
6.7 |
22,585 |
25,054 |
25,345 |
27,997 |
5.7 |
Source: World Tourism Organization (UNWTO) © |
|
|
|
|
|
|
|
|
|
(Data as collected by UNWTO May 2014) |
|||||
¹ See note on page 9 |
|
|
|
|
|
|
|
|
|
|
|
|
|
|
|
8UNWTO Tourism Highlights, 2014 Edition

|
|
|
|
International Tourist Arrivals |
|
|
|
International Tourism Receipts |
|
|||||
Destinations |
|
|
(1000) |
|
|
Change (%) |
|
Share (%) |
|
(US$ million) |
|
Share (%) |
||
|
Series1 |
2010 |
2011 |
2012 |
2013* |
11/10 |
12/11 |
13*/12 |
2013* |
2010 |
2011 |
2012 |
2013* |
2013* |
Asia and the Pacific |
|
204,889 |
218,511 |
233,534 |
248,070 |
6.6 |
6.9 |
6.2 |
100 |
255,887 |
301,510 |
329,090 |
358,923 |
100 |
North-East Asia |
|
111,508 |
115,783 |
122,758 |
127,015 |
3.8 |
6.0 |
3.5 |
51.2 |
128,493 |
150,283 |
167,206 |
184,670 |
51.5 |
China |
TF |
55,665 |
57,581 |
57,725 |
55,686 |
3.4 |
0.3 |
-3.5 |
22.4 |
45,814 |
48,464 |
50,028 |
51,664 |
14.4 |
Hong Kong (China) |
TF |
20,085 |
22,316 |
23,770 |
25,661 |
11.1 |
6.5 |
8.0 |
10.3 |
22,200 |
28,455 |
33,074 |
38,940 |
10.8 |
Japan |
VF |
8,611 |
6,219 |
8,358 |
10,364 |
-27.8 |
34.4 |
24.0 |
4.2 |
13,199 |
10,966 |
14,576 |
14,934 |
4.2 |
Korea, D P Rp |
|
.. |
.. |
.. |
.. |
.. |
.. |
.. |
.. |
.. |
.. |
.. |
.. |
.. |
Korea, Republic of |
VF |
8,798 |
9,795 |
11,140 |
12,176 |
11.3 |
13.7 |
9.3 |
4.9 |
10,328 |
12,476 |
13,429 |
14,272 |
4.0 |
Macao (China) |
TF |
11,926 |
12,925 |
13,577 |
14,268 |
8.4 |
5.0 |
5.1 |
5.8 |
27,802 |
38,453 |
43,702 |
51,617 |
14.4 |
Mongolia |
TF |
456 |
460 |
476 |
418 |
0.9 |
3.4 |
-12.2 |
0.2 |
244 |
218 |
442 |
369 |
0.1 |
Taiwan (pr. of China) |
VF |
5,567 |
6,087 |
7,311 |
8,016 |
9.3 |
20.1 |
9.6 |
3.2 |
8,721 |
11,065 |
11,770 |
12,677 |
3.5 |
South-East Asia |
|
69,996 |
77,505 |
84,231 |
93,068 |
10.7 |
8.7 |
10.5 |
37.5 |
68,777 |
85,005 |
96,013 |
107,396 |
29.9 |
Brunei Darussalam |
TF |
214 |
242 |
209 |
225 |
13.0 |
-13.6 |
7.6 |
0.1 |
.. |
.. |
.. |
.. |
.. |
Cambodia |
TF |
2,508 |
2,882 |
3,584 |
4,210 |
14.9 |
24.4 |
17.5 |
1.7 |
1,519 |
2,084 |
2,463 |
2,660 |
0.7 |
Indonesia |
TF |
7,003 |
7,650 |
8,044 |
8,802 |
9.2 |
5.2 |
9.4 |
3.5 |
6,957 |
7,997 |
8,325 |
9,337 |
2.6 |
Lao P.D.R. |
TF |
1,670 |
1,786 |
2,140 |
.. |
6.9 |
19.8 |
.. |
.. |
382 |
406 |
451 |
.. |
.. |
Malaysia |
TF |
24,577 |
24,714 |
25,033 |
25,715 |
0.6 |
1.3 |
2.7 |
10.4 |
18,115 |
19,656 |
20,250 |
21,018 |
5.9 |
Myanmar |
TF |
311 |
391 |
593 |
900 |
25.9 |
51.7 |
51.7 |
0.4 |
72 |
281 |
.. |
.. |
.. |
Philippines |
TF |
3,520 |
3,917 |
4,273 |
4,681 |
11.3 |
9.1 |
9.6 |
1.9 |
2,630 |
3,190 |
4,061 |
4,683 |
1.3 |
Singapore |
TF |
9,161 |
10,390 |
11,098 |
.. |
13.4 |
6.8 |
.. |
.. |
14,178 |
18,086 |
19,023 |
18,953 |
5.3 |
Thailand |
TF |
15,936 |
19,230 |
22,354 |
26,547 |
20.7 |
16.2 |
18.8 |
10.7 |
20,104 |
27,184 |
33,826 |
42,080 |
11.7 |
Timor-Leste |
TF |
45 |
50 |
55 |
78 |
12.8 |
9.6 |
41.5 |
0.0 |
26 |
21 |
21 |
.. |
.. |
Vietnam |
VF |
5,050 |
6,251 |
6,848 |
7,572 |
23.8 |
9.5 |
10.6 |
3.1 |
4,450 |
5,710 |
6,830 |
7,503 |
2.1 |
Oceania |
|
11,371 |
11,462 |
11,926 |
12,484 |
0.8 |
4.0 |
4.7 |
5.0 |
38,580 |
42,472 |
42,952 |
42,554 |
11.9 |
American Samoa |
TF |
23 |
22 |
22 |
.. |
-3.1 |
-1.5 |
.. |
.. |
.. |
.. |
.. |
.. |
.. |
Australia |
VF |
5,790 |
5,771 |
6,032 |
6,381 |
-0.3 |
4.5 |
5.8 |
2.6 |
28,422 |
31,335 |
31,731 |
30,979 |
8.6 |
Cook Is |
TF |
104 |
113 |
122 |
121 |
8.5 |
8.2 |
-1.0 |
0.0 |
110 |
.. |
.. |
.. |
.. |
Fiji |
TF |
632 |
675 |
661 |
658 |
6.8 |
-2.1 |
-0.4 |
0.3 |
635 |
724 |
729 |
719 |
0.2 |
French Polynesia |
TF |
154 |
163 |
169 |
164 |
5.8 |
3.8 |
-2.7 |
0.1 |
406 |
460 |
438 |
.. |
.. |
Guam |
TF |
1,197 |
1,160 |
1,308 |
1,334 |
-3.1 |
12.8 |
2.0 |
0.5 |
.. |
.. |
.. |
.. |
.. |
Kiribati |
TF |
5 |
5 |
5 |
6 |
12.0 |
-6.8 |
19.6 |
0.0 |
.. |
.. |
.. |
.. |
.. |
Marshall Is |
TF |
5 |
5 |
5 |
.. |
-0.1 |
0.7 |
.. |
.. |
4 |
4 |
4 |
.. |
.. |
Micronesia (Fed. St. of) TF |
.. |
.. |
.. |
.. |
.. |
.. |
.. |
.. |
.. |
.. |
.. |
.. |
.. |
|
N. Mariana Is |
TF |
375 |
336 |
.. |
.. |
-10.3 |
.. |
.. |
.. |
.. |
.. |
.. |
.. |
.. |
New Caledonia |
TF |
99 |
112 |
112 |
108 |
13.5 |
0.3 |
-4.0 |
0.0 |
129 |
154 |
152 |
.. |
.. |
New Zealand |
TF |
2,435 |
2,511 |
2,473 |
.. |
3.1 |
-1.5 |
.. |
.. |
6,522 |
7,341 |
7,128 |
7,472 |
2.1 |
Niue |
TF |
6 |
6 |
5 |
7 |
-1.9 |
-17.2 |
39.6 |
0.0 |
2 |
2 |
.. |
.. |
.. |
Palau |
TF |
86 |
109 |
119 |
105 |
27.4 |
8.9 |
-11.5 |
0.0 |
91 |
115 |
133 |
.. |
.. |
Papua New Guinea |
TF |
147 |
163 |
164 |
.. |
11.1 |
0.6 |
.. |
.. |
2 |
5 |
2 |
.. |
.. |
Samoa |
TF |
122 |
121 |
126 |
116 |
-0.9 |
4.1 |
-8.0 |
0.0 |
123 |
134 |
148 |
136 |
0.0 |
Solomon Is |
TF |
21 |
23 |
24 |
.. |
11.8 |
4.2 |
.. |
.. |
54 |
71 |
67 |
.. |
.. |
Tonga |
TF |
47 |
46 |
47 |
.. |
-2.3 |
2.9 |
.. |
.. |
27 |
28 |
41 |
.. |
.. |
Tuvalu |
TF |
2 |
1 |
.. |
.. |
-27.6 |
.. |
.. |
.. |
.. |
.. |
.. |
.. |
.. |
Vanuatu |
TF |
97 |
94 |
108 |
110 |
-3.3 |
15.1 |
1.8 |
0.0 |
217 |
226 |
261 |
.. |
.. |
South Asia |
|
12,014 |
13,761 |
14,618 |
15,504 |
14.5 |
6.2 |
6.1 |
6.2 |
20,036 |
23,750 |
22,919 |
24,304 |
6.8 |
Afghanistan |
|
.. |
.. |
.. |
.. |
.. |
.. |
.. |
.. |
55 |
71 |
56 |
.. |
.. |
Bangladesh |
TF |
303 |
.. |
.. |
.. |
.. |
.. |
.. |
.. |
81 |
87 |
108 |
.. |
.. |
Bhutan |
TF |
41 |
66 |
105 |
.. |
61.0 |
59.1 |
.. |
.. |
35 |
48 |
63 |
63 |
0.0 |
India |
TF |
5,776 |
6,309 |
6,578 |
6,848 |
9.2 |
4.3 |
4.1 |
2.8 |
14,490 |
17,707 |
17,971 |
18,397 |
5.1 |
Iran |
TF/VF |
2,938 |
3,354 |
3,834 |
.. |
14.2 |
14.3 |
.. |
.. |
2,438 |
2,381 |
1,114 |
.. |
.. |
Maldives |
TF |
792 |
931 |
958 |
1,125 |
17.6 |
2.9 |
17.4 |
0.5 |
1,713 |
1,868 |
1,877 |
2,031 |
0.6 |
Nepal |
TF |
603 |
736 |
803 |
798 |
22.1 |
9.1 |
-0.7 |
0.3 |
344 |
386 |
352 |
436 |
0.1 |
Pakistan |
TF |
907 |
1,161 |
966 |
.. |
28.1 |
-16.8 |
.. |
.. |
305 |
373 |
339 |
288 |
0.1 |
Sri Lanka |
TF |
654 |
856 |
1,006 |
1,275 |
30.8 |
17.5 |
26.7 |
0.5 |
576 |
830 |
1,039 |
1,715 |
0.5 |
Source: World Tourism Organization (UNWTO) © |
|
|
|
|
|
|
|
|
(Data as collected by UNWTO May 2014) |
|||||
¹ See note below |
|
|
|
|
|
|
|
|
|
|
|
|
|
|
* = provisional figure or data; .. = figure or data not (yet) available; l = change of series; n/a = not applicable.
Series of International Tourist Arrivals – TF: International tourist arrivals at frontiers (excluding same-day visitors); VF: International visitor arrivals at frontiers (tourists and same-day visitors); THS: International tourist arrivals at hotels and similar establishments; TCE: International tourist arrivals at collective tourism establishments.
For main concepts, definitions and classifications for the measurement of tourism, please see the International Recommendations for Tourism Statistics 2008 (IRTS 2008) <statistics.unwto.org/content/irts-2008>.
UNWTO Tourism Highlights, 2014 Edition |
9 |
|

|
|
|
|
International Tourist Arrivals |
|
|
|
International Tourism Receipts |
|
|||||
Destinations |
|
|
(1000) |
|
|
Change (%) |
|
Share (%) |
|
(US$ million) |
|
Share (%) |
||
Series1 |
2010 |
2011 |
2012 |
2013* |
11/10 |
12/11 |
13*/12 |
2013* |
2010 |
2011 |
2012 |
2013* |
2013* |
|
Americas |
|
150,578 |
155,964 |
162,721 |
167,940 |
3.6 |
4.3 |
3.2 |
100 |
180,865 |
198,522 |
212,911 |
229,179 |
100 |
North America |
|
99,517 |
102,130 |
106,404 |
110,091 |
2.6 |
4.2 |
3.5 |
65.6 |
131,284 |
144,255 |
156,360 |
171,044 |
74.6 |
Canada |
TF |
16,219 |
16,016 |
16,344 |
16,588 |
-1.3 |
2.0 |
1.5 |
9.9 |
15,829 |
16,834 |
17,407 |
17,656 |
7.7 |
Mexico |
TF |
23,290 |
23,403 |
23,403 |
23,734 |
0.5 |
0.0 |
1.4 |
14.1 |
11,992 |
11,869 |
12,739 |
13,819 |
6.0 |
United States |
TF |
60,008 |
62,711 |
66,657 |
69,768 |
4.5 |
6.3 |
4.7 |
41.5 |
103,463 |
115,552 |
126,214 |
139,569 |
60.9 |
Caribbean |
|
19,539 |
20,117 |
20,730 |
21,229 |
3.0 |
3.0 |
2.4 |
12.6 |
22,765 |
23,409 |
24,201 |
24,828 |
10.8 |
Anguilla |
TF |
62 |
66 |
65 |
69 |
6.1 |
-1.6 |
6.8 |
0.0 |
99 |
112 |
113 |
122 |
0.1 |
Antigua,Barb |
TF |
230 |
241 |
247 |
244 |
5.0 |
2.3 |
-1.2 |
0.1 |
298 |
312 |
319 |
299 |
0.1 |
Aruba |
TF |
825 |
869 |
904 |
979 |
5.4 |
4.0 |
8.3 |
0.6 |
1,251 |
1,351 |
1,402 |
.. |
.. |
Bahamas |
TF |
1,370 |
1,346 |
1,422 |
1,363 |
-1.7 |
5.6 |
-4.1 |
0.8 |
2,163 |
2,142 |
2,311 |
.. |
.. |
Barbados |
TF |
532 |
568 |
536 |
509 |
6.7 |
-5.5 |
-5.2 |
0.3 |
1,034 |
963 |
907 |
912 |
0.4 |
Bermuda |
TF |
232 |
236 |
232 |
236 |
1.6 |
-1.7 |
1.8 |
0.1 |
442 |
466 |
454 |
437 |
0.2 |
Br.Virgin Is |
TF |
330 |
338 |
351 |
356 |
2.2 |
4.0 |
1.2 |
0.2 |
389 |
388 |
397 |
.. |
.. |
Cayman Islands |
TF |
288 |
309 |
322 |
345 |
7.2 |
4.1 |
7.4 |
0.2 |
485 |
458 |
480 |
.. |
.. |
Cuba |
TF |
2,507 |
2,688 |
2,815 |
.. |
7.2 |
4.7 |
.. |
.. |
2,187 |
2,283 |
2,326 |
.. |
.. |
Curaçao |
TF |
342 |
390 |
420 |
440 |
14.2 |
7.6 |
4.8 |
0.3 |
385 |
453 |
543 |
.. |
.. |
Dominica |
TF |
77 |
76 |
78 |
78 |
-1.3 |
3.4 |
0.2 |
0.0 |
94 |
106 |
76 |
82 |
0.0 |
Dominican Rp |
TF |
4,125 |
4,306 |
4,563 |
4,690 |
4.4 |
5.9 |
2.8 |
2.8 |
4,209 |
4,436 |
4,736 |
5,118 |
2.2 |
Grenada |
TF |
110 |
118 |
112 |
116 |
7.1 |
-5.1 |
3.7 |
0.1 |
112 |
117 |
122 |
120 |
0.1 |
Guadeloupe |
TCE |
392 |
418 |
.. |
.. |
6.5 |
.. |
.. |
.. |
510 |
583 |
.. |
.. |
.. |
Haiti |
TF |
255 |
349 |
349 |
420 |
36.9 |
0.1 |
20.2 |
0.2 |
169 |
162 |
170 |
.. |
.. |
Jamaica |
TF |
1,922 |
1,952 |
1,986 |
2,008 |
1.6 |
1.8 |
1.1 |
1.2 |
2,001 |
2,013 |
2,046 |
.. |
.. |
Martinique |
TF |
476 |
495 |
487 |
490 |
3.9 |
-1.6 |
0.5 |
0.3 |
472 |
516 |
462 |
.. |
.. |
Montserrat |
TF |
6 |
5 |
7 |
7 |
-9.8 |
35.5 |
-1.5 |
0.0 |
6 |
5 |
7 |
8 |
0.0 |
Puerto Rico |
TF |
3,186 |
3,048 |
3,069 |
3,200 |
-4.3 |
0.7 |
4.3 |
1.9 |
3,211 |
3,143 |
3,193 |
3,334 |
1.5 |
Saint Lucia |
TF |
306 |
312 |
307 |
319 |
2.1 |
-1.8 |
3.9 |
0.2 |
309 |
321 |
337 |
354 |
0.2 |
St.Kitts-Nev |
TF |
98 |
102 |
104 |
107 |
3.4 |
2.5 |
2.6 |
0.1 |
90 |
94 |
95 |
101 |
0.0 |
St.Maarten |
TF |
443 |
424 |
457 |
467 |
-4.2 |
7.6 |
2.3 |
0.3 |
674 |
719 |
842 |
.. |
.. |
St.Vincent,Grenadines |
TF |
72 |
74 |
74 |
72 |
1.9 |
0.7 |
-3.5 |
0.0 |
86 |
92 |
94 |
92 |
0.0 |
Trinidad Tbg |
TF |
388 |
402 |
.. |
.. |
3.7 |
.. |
.. |
.. |
450 |
472 |
.. |
.. |
.. |
Turks,Caicos |
TF |
281 |
354 |
292 |
291 |
26.0 |
-17.6 |
-0.4 |
0.2 |
.. |
.. |
.. |
.. |
.. |
US.Virgin Is |
TF |
590 |
532 |
580 |
.. |
-9.8 |
9.1 |
.. |
.. |
1,013 |
.. |
.. |
.. |
.. |
Central America |
|
7,908 |
8,256 |
8,860 |
9,192 |
4.4 |
7.3 |
3.7 |
5.5 |
6,627 |
7,787 |
8,723 |
9,380 |
4.1 |
Belize |
TF |
242 |
250 |
277 |
294 |
3.5 |
10.7 |
6.1 |
0.2 |
249 |
247 |
298 |
351 |
0.2 |
Costa Rica |
TF |
2,100 |
2,192 |
2,343 |
2,428 |
4.4 |
6.9 |
3.6 |
1.4 |
1,999 |
2,152 |
2,299 |
2,483 |
1.1 |
El Salvador |
TF |
1,150 |
1,184 |
1,255 |
1,308 |
3.0 |
5.9 |
4.2 |
0.8 |
390 |
415 |
558 |
621 |
0.3 |
Guatemala |
TF |
1,219 |
1,225 |
1,305 |
1,331 |
0.5 |
6.5 |
2.0 |
0.8 |
1,378 |
1,350 |
1,419 |
1,481 |
0.6 |
Honduras |
TF |
863 |
871 |
895 |
943 |
1.0 |
2.7 |
5.4 |
0.6 |
627 |
639 |
661 |
711 |
0.3 |
Nicaragua |
TF |
1,011 |
1,060 |
1,180 |
1,230 |
4.8 |
11.3 |
4.3 |
0.7 |
309 |
378 |
422 |
417 |
0.2 |
Panama |
TF |
1,324 |
1,473 |
1,606 |
1,658 |
11.2 |
9.1 |
3.2 |
1.0 |
1,676 |
2,605 |
3,067 |
3,316 |
1.4 |
South America |
|
23,614 |
25,460 |
26,727 |
27,429 |
7.8 |
5.0 |
2.6 |
16.3 |
20,189 |
23,071 |
23,626 |
23,927 |
10.4 |
Argentina |
TF |
5,325 |
5,705 |
5,585 |
5,571 |
7.1 |
-2.1 |
-0.3 |
3.3 |
4,942 |
5,354 |
4,887 |
4,411 |
1.9 |
Bolivia |
TF |
807 |
953 |
1,114 |
.. |
18.0 |
17.0 |
.. |
.. |
379 |
481 |
532 |
.. |
.. |
Brazil |
TF |
5,161 |
5,433 |
5,677 |
.. |
5.3 |
4.5 |
.. |
.. |
5,702 |
6,555 |
6,645 |
6,711 |
2.9 |
Chile |
TF |
2,801 |
3,137 |
3,554 |
3,576 |
12.0 |
13.3 |
0.6 |
2.1 |
1,645 |
1,889 |
2,150 |
2,219 |
1.0 |
Colombia |
TF |
2,385 |
2,042 |
2,175 |
2,288 |
-14.4 |
6.5 |
5.2 |
1.4 |
2,083 |
2,201 |
2,354 |
2,491 |
1.1 |
Ecuador |
VF |
1,047 |
1,141 |
1,272 |
1,366 |
9.0 |
11.5 |
7.4 |
0.8 |
781 |
843 |
1,033 |
1,246 |
0.5 |
French Guiana |
TF |
.. |
.. |
.. |
.. |
.. |
.. |
.. |
.. |
.. |
.. |
.. |
.. |
.. |
Guyana |
TF |
152 |
157 |
177 |
.. |
3.3 |
12.6 |
.. |
.. |
80 |
95 |
64 |
.. |
.. |
Paraguay |
TF |
465 |
524 |
579 |
610 |
12.6 |
10.6 |
5.3 |
0.4 |
217 |
241 |
265 |
273 |
0.1 |
Peru |
TF |
2,299 |
2,598 |
2,846 |
3,164 |
13.0 |
9.5 |
11.2 |
1.9 |
2,008 |
2,360 |
2,657 |
3,009 |
1.3 |
Suriname |
TF |
204 |
220 |
240 |
249 |
7.9 |
8.9 |
3.8 |
0.1 |
61 |
61 |
71 |
84 |
0.0 |
Uruguay |
TF |
2,349 |
2,857 |
2,695 |
2,684 |
21.6 |
-5.7 |
-0.4 |
1.6 |
1,509 |
2,203 |
2,076 |
1,920 |
0.8 |
Venezuela |
TF |
526 |
595 |
710 |
.. |
13.0 |
19.3 |
.. |
.. |
740 |
739 |
844 |
.. |
.. |
Source: World Tourism Organization (UNWTO) © |
|
|
|
|
|
|
|
|
(Data as collected by UNWTO May 2014) |
|||||
¹ See note on page 9 |
|
|
|
|
|
|
|
|
|
|
|
|
|
|
10 |
UNWTO Tourism Highlights, 2014 Edition |
|