

Оригинал
.pdfcomplex.
In summary, the normal chest lead ECG shows an rS-type complex in lead V1 with a steady increase in the relative size of the R wave toward the left chest and a decrease in S wave amplitude. Leads V5 and V6 generally show a qR-type complex.[*]
The concept of normal R wave progression is key in distinguishing normal and abnormal ECG patterns. For example, imagine the effect that an anterior wall myocardial infarction (MI) would have on normal R wave progression. Anterior wall infarction results in the death of myocardial cells and the loss of normal positive (R wave) voltages. Therefore, one major ECG sign of an anterior wall infarction is the loss of normal R wave progression in the chest leads (see Chapters 8 and 9).
An understanding of normal R wave progression in the chest leads also provides a basis for recognizing other basic ECG abnormalities. For example, consider the effect of left or right ventricular hypertrophy (enlarged muscle mass) on the chest lead patterns. As mentioned previously, the left ventricle is normally electrically predominant and left ventricular depolarization produces deep (negative) S waves in the right chest leads with tall (positive) R waves in the left chest leads. With left ventricular hypertrophy, these left ventricular voltages are further increased, resulting in very tall R waves in the left chest leads and very deep S waves in the right chest leads. On the other hand, right ventricular hypertrophy shifts the balance of electrical forces to the right, producing tall positive waves (R waves) in the right chest leads (see Chapter 6).
LIMB (EXTREMITY) LEADS
Of the six limb leads (I, II, III, aVR, aVL, and aVF), lead aVr is the easiest to visualize. The positive pole of lead aVR is oriented upward and toward the right shoulder. The ventricular stimulation forces are oriented primarily toward the left ventricle. Therefore lead aVR normally shows a predominantly negative QRS complex. Lead aVR may display any of the QRS-T complexes shown in Figure 4-9. In all cases, the QRS is predominantly negative. The T wave in lead aVR is also normally negative.
51
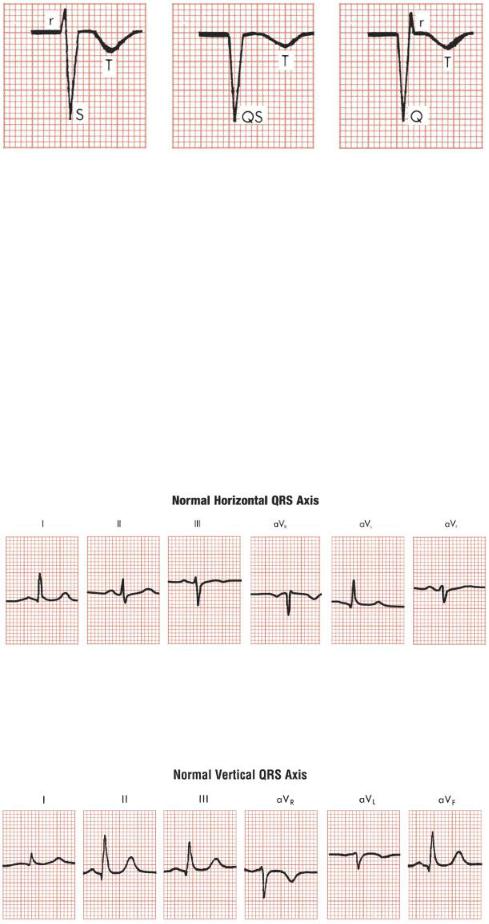
FIGURE 4-9 Lead aVR normally shows one of three basic negative patterns: an rS complex, a QS complex, or a Qr complex. The T wave also is normally negative.
The QRS patterns in the other five limb leads are somewhat more complicated. The reason is that the QRS patterns in the limb leads show considerable normal variation. For example, the limb leads in the ECGs of some normal people may show qR-type complexes in leads I and aVL and rS-type complexes in leads III and aVF
(Fig. 4-10). The ECGs of other people may show just the opposite picture, with qR complexes in leads II, III, and aVF and RS complexes in lead aVl and sometimes lead I (Fig. 4-11).
FIGURE 4-10 With a horizontal QRS position (axis), leads I and aVL show qR complexes, lead II shows an RS complex, and leads III and aVF show rS complexes.
52
FIGURE 4-11 With a vertical QRS position (axis), leads II, III, and aVF show qR complexes, but lead aVL (and sometimes lead I) shows an RS complex. This is the reverse of the pattern that occurs with a normal horizontal axis.
What accounts for this marked normal variability in the QRS patterns shown in the limb leads? The patterns that are seen depend on the electrical position of the heart. The term electrical position is virtually synonymous with mean QRS axis, which is described in greater detail in Chapter 5.
In simplest terms the electrical position of the heart may be described as either horizontal or vertical:
When the heart is electrically horizontal (horizontal QRS axis), ventricular
*depolarization is directed mainly horizontally and to the left in the frontal plane. As the frontal plane diagram in Figure 3-10 shows, the positive poles of leads I and aVL are oriented horizontally and to the left. Therefore, when the heart is electrically horizontal, the QRS voltages are directed toward leads I and aVL. Consequently, a tall R wave (usually as part of a qR complex) is seen in these leads.
When the heart is electrically vertical (vertical QRS axis), ventricular
*depolarization is directed mainly downward. In the frontal plane diagram (see Fig. 3-10), the positive poles of leads II, III, and aVF are oriented downward. Therefore, when the heart is electrically vertical, the QRS voltages are directed toward leads II, III, and aVF. This produces a tall R wave (usually as part of a qR complex) in these leads.
The concepts of electrically horizontal and electrically vertical heart positions can be expressed in another way. When the heart is electrically horizontal, leads I and aVl show qR complexes similar to the qR complexes seen normally in the left chest leads (V5 and V6). Leads II, III, and aVF show rS or RS complexes similar to those normally seen in the right chest leads. Therefore, when the heart is electrically horizontal, the patterns in leads I and aVl resemble those in leads V5 and V6 whereas the patterns in leads II, III, and aVF resemble those in the right chest leads.
53
Conversely, when the heart is electrically vertical, just the opposite patterns are seen in the limb leads. With a vertical heart, leads II, III, and aVF show qR complexes similar to those seen in the left chest leads, and leads I and aVL show rS-type complexes resembling those in the right chest leads.
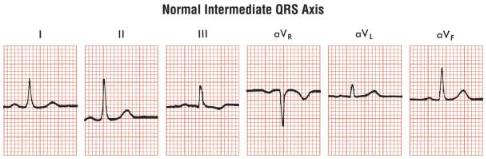
Dividing the electrical position of the heart into vertical and horizontal variants is obviously an oversimplification. In Figure 4-12, for example, leads I, II, aVL, and aVF all show positive QRS complexes. Therefore, this tracing has features of both the vertical and the horizontal variants. (Sometimes this pattern is referred to as an
“intermediate” heart position.)
FIGURE 4-12 Limb leads sometimes show patterns that are hybrids of vertical and horizontal variants, with R waves in leads I, II, III, aVL, and aVF. This represents an intermediate QRS axis and is also a normal variant.
For present purposes, however, you can regard the QRS patterns in the limb leads as basically variants of either the horizontal or the vertical QRS patterns described.
In summary, the limb leads in normal ECGs can show a variable QRS pattern. Lead aVR normally always records a predominantly negative QRS complex (Qr, QS, or rS). The QRS patterns in the other limb leads vary depending on the electrical position (QRS axis) of the heart. With an electrically vertical axis, leads II, III, and aVF show qR-type complexes. With an electrically horizontal axis, leads I and aVL show qR complexes. Therefore, it is not possible to define a single normal ECG pattern; rather, there is a normal variability. Students and clinicians must familiarize themselves with the normal variants in both the chest leads and the limb leads.
54