

Оригинал
.pdfthis electrical activity. This chapter describes the P-QRS-T patterns seen normally in each of the 12 leads. Fortunately, you do not have to memorize 12 or more separate patterns. Rather, if you understand a few basic ECG principles and the sequence of atrial and ventricular depolarization, you can predict the normal ECG patterns in each lead.
As the sample ECG in Figure 3-2 shows, each of the 12 leads appears to be different. In some leads, for example, the P waves are positive (upward); in others, they are negative (downward). In some leads, the QRS complexes are represented by an rS wave; in other leads, they are represented by RS or qR waves. Finally, the T waves are positive in some leads and negative in others. What determines this variety in the appearance of ECG complexes in the different leads, and how does the repetitive cycle of cardiac electrical activity produce such different patterns in these
leads?
|
THREE BASIC “LAWS” OF ELECTROCARDIOGRAPHY |
|
To answer the preceding questions, you need to understand three basic ECG |
“laws” (Fig. 4-1): |
|
|
A positive (upward) deflection appears in any lead if the wave of |
. |
depolarization spreads toward the positive pole of that lead. Thus if the path of |
|
atrial stimulation is directed downward and to the patient's left, toward the |
|
positive pole of lead II, a positive (upward) P wave is seen in lead II (Figs. 4-2 |
|
and 4-3). Similarly, if the ventricular stimulation path is directed to the left, a |
|
positive deflection (R wave) is seen in lead I (see Fig. 4-1A). |
|
A negative (downward) deflection appears in any lead if the wave of |
. |
depolarization spreads toward the negative pole of that lead (or away from the |
|
positive pole). Thus if the atrial stimulation path spreads downward and to the |
left, a negative P wave is seen in lead aVR (see Figs. 4-2 and 4-3). If the ventricular stimulation path is directed entirely away from the positive pole of any lead, a negative QRS complex (QS deflection) is seen (see Fig. 4-1B).
If the mean depolarization path is directed at right angles (perpendicular) 41
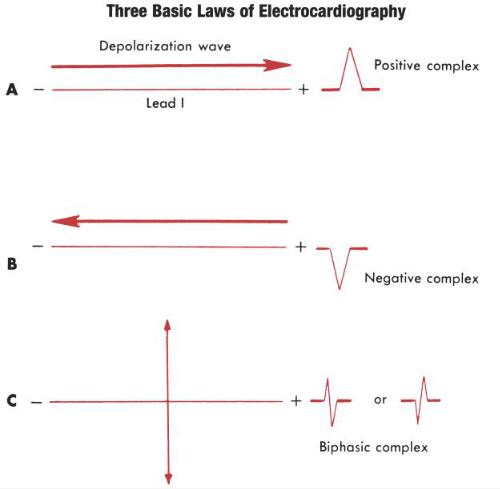
. to any lead, a small biphasic deflection (consisting of positive and negative deflections of equal size) is usually seen. If the atrial stimulation path spreads at right angles to any lead, a biphasic P wave is seen in that lead. If the ventricular stimulation path spreads at right angles to any lead, the QRS complex is biphasic (see Fig. 4-1C). A biphasic QRS complex may consist of either an RS pattern or a QR pattern.
FIGURE 4-1 A, A positive complex is seen in any lead if the wave of depolarization spreads toward the positive pole of that lead. B, A negative complex is seen if the depolarization wave spreads toward the negative pole (away from the positive pole) of the lead. C, A biphasic (partly positive, partly negative) complex is seen if the mean direction of the wave is at right angles (perpendicular) to the lead.
These three basic laws apply to both the P wave (atrial depolarization) and the QRS complex (ventricular depolarization).
42
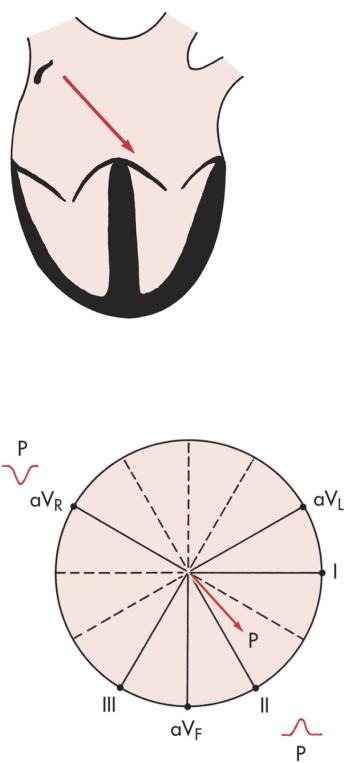
FIGURE 4-2 With normal sinus rhythm, the atrial depolarization wave (arrow) spreads from the right atrium downward toward the atrioventricular (AV) junction and left leg.
FIGURE 4-3 With sinus rhythm, the normal P wave is negative (downward) in lead aVR and positive (upward) in lead II. Recall that with normal atrial depolarization the arrow points down toward the patient's left (see Fig. 4-2), away from the positive pole of lead aVR and toward the positive pole of lead II.
In summary, when the mean depolarization wave spreads toward the positive
pole of any lead, it produces a positive (upward) deflection. When it spreads toward 43
the negative pole (away from the positive pole) of any lead, it produces a negative (downward) deflection. When it spreads at right angles to any lead axis, it produces a biphasic deflection.
Mention of repolarization—the return of stimulated muscle to the resting state— has deliberately been omitted. The subject is touched on later in this chapter in the discussion of the normal T wave.
Keeping the three ECG laws in mind, all you need to know is the direction in which depolarization spreads through the heart at any time. Using this information, you can predict what the P waves and the QRS complexes look like in any lead.
NORMAL P WAVE
The P wave, which represents atrial depolarization, is the first waveform seen in any cycle. Atrial depolarization is initiated by the sinus node in the right atrium (see Fig. 1-1). The atrial depolarization path therefore spreads from right to left and downward toward the atrioventricular (AV) junction. The spread of atrial depolarization can be represented by an arrow[*] that points downward and to the patient's left (see Fig. 4-2).
Figure 3-7C, which shows the spatial relationship of the six frontal plane (limb) leads, is redrawn in Figure 4-3. Notice that the positive pole of lead aVr points upward in the direction of the right shoulder. The normal path of atrial depolarization spreads downward toward the left leg (away from the positive pole of lead aVr). Therefore, with normal sinus rhythm, lead aVr always shows a negative P wave. Conversely, lead II is oriented with its positive pole pointing downward in the direction of the left leg (see Fig. 4-3). Therefore, the normal atrial depolarization path is directed toward the positive pole of that lead. When normal sinus rhythm is present, lead II always records a positive (upward) P wave.
In summary, when normal sinus rhythm is present, the P wave is always negative in lead aVr and positive in lead II.
Using the same principles of analysis, can you predict what the P wave looks like in leads II and aVr when the heart is being paced not by the sinus node but by the AV junction (AV junctional rhythm)? When the AV junction (or an ectopic
44
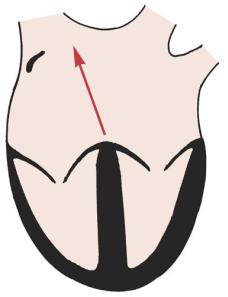
pacemaker in the lower part of either atrium) is pacing the heart, atrial depolarization must spread up the atria in a retrograde direction, which is just the opposite of what happens with normal sinus rhythm. Therefore, an arrow representing the spread of atrial depolarization with AV junctional rhythm points upward and to the right (Fig. 4-4), just the opposite of what occurs with normal sinus rhythm. The spread of atrial depolarization upward and to the right results in a positive P wave in lead aVR, since the stimulus is spreading toward the positive pole of that lead (Fig. 4-5). Conversely, lead II shows a negative P wave.
FIGURE 4-4 When the atrioventricular (AV) junction (or an ectopic pacemaker in the low atrial area) acts as the cardiac pacemaker (junctional or low atrial rhythm), the atria are depolarized in a retrograde (backward) fashion. In this situation, an arrow representing atrial depolarization points upward toward the right atrium. The opposite of the pattern is seen with sinus rhythm.
AV junctional rhythms are considered in detail in Part Two. The topic is introduced in this chapter simply to show how the polarity of the P waves in lead aVr and lead II depends on the direction of atrial depolarization and how the patterns can be predicted using simple basic principles.
At this point, you need not be concerned with the polarity of P waves in the other 10 leads. You can usually obtain all the clinical information you need to
45
determine whether the sinus node is pacing the atria by simply looking at the P waves in leads II and aVR. The size and shape of these waves in other leads may be important in determining whether left or right atrial enlargement is present (see Chapter 6).
FIGURE 4-5 With atrioventricular (AV) junctional rhythm (or low atrial ectopic rhythm), the P waves (if seen) are upward (positive) in lead aVR and downward (negative) in lead II.
NORMAL QRS COMPLEX
The principles used to predict P waves can also be applied in deducing the shape of the QRS waveform in the various leads. The QRS, which represents ventricular depolarization, is somewhat more complex than the P wave, but the same basic ECG rules apply to both.
To predict what the QRS looks like in the different leads, you must first know the direction of ventricular depolarization. Although the spread of atrial depolarization can be represented by a single arrow, the spread of ventricular depolarization consists of two major sequential phases:
The first phase of ventricular depolarization is of relatively brief duration
*(shorter than 0.04 sec) and small amplitude. It results from spread of the stimulus through the interventricular septum. The septum is the first part of the
46
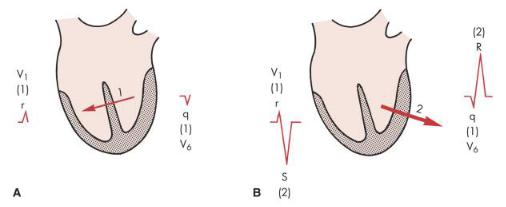
ventricles to be stimulated. Furthermore, the left side of the septum is stimulated first (by a branch of the left bundle of His). Thus depolarization spreads from the left ventricle to the right across the septum. Phase one of ventricular depolarization (septal stimulation) can therefore be represented by a small arrow pointing from the left septal wall to the right (Fig. 4-6A).
The second phase of ventricular depolarization involves simultaneous
*stimulation of the main mass of both the left and right ventricles from the inside (endocardium) to the outside (epicardium) of the heart muscle. In the normal heart, the left ventricle is electrically predominant. In other words, it electrically overbalances the right ventricle. Therefore, an arrow representing phase two of ventricular stimulation points toward the left ventricle (Fig. 4-6B).
FIGURE 4-6 A, The first phase of ventricular depolarization proceeds from the left wall of the septum to the right. An arrow representing this phase points through the septum from the left to the right side. B, The second phase involves depolarization of the main bulk of the ventricles. The arrow points through the left ventricle because this ventricle is normally electrically predominant. The two phases produce an rS complex in the right chest lead (V1) and a qR complex in the left chest lead (V6).
In summary, the ventricular depolarization process can be divided into two main phases: stimulation of the interventricular septum (represented by a short arrow pointing through the septum into the right ventricle), and simultaneous left and right ventricular stimulation (represented by a larger arrow pointing through the left
ventricle and toward the left chest).
47
Now that the ventricular stimulation sequence has been outlined, you can begin to predict the types of QRS patterns this sequence produces in the different leads. For the moment, the discussion is limited to QRS patterns normally seen in the chest leads (the horizontal plane leads).
CHEST LEADS
As discussed in Chapter 3, lead V1 shows voltages detected by an electrode placed on the right side of the sternum (fourth intercostal space). Lead V6, a left chest lead, shows voltages detected in the left midaxillary line (see Fig. 3-8). What does the QRS complex look like in these leads (see Fig. 4-6)? Ventricular stimulation occurs in two phases:
The first phase of ventricular stimulation, septal stimulation, is
*represented by an arrow pointing to the right, reflecting the left-to-right spread of the depolarization stimulus through the septum (see Fig. 4-6A). This small arrow points toward the positive pole of lead V1. Therefore the spread of stimulation to the right during the first phase produces a small positive deflection (r wave) in lead V1. What does lead V6 show? The left-to-right spread of septal stimulation produces a small negative deflection (q wave) in lead V6. Thus the same electrical event (septal stimulation) produces a small positive deflection (or r wave) in lead V1 and a small negative deflection (q wave) in a left precordial lead, like lead V6. (This situation is analogous to the one described for the P wave, which is normally positive in lead II but always negative in lead aVr.)
The second phase of ventricular stimulation is represented by an arrow
*pointing in the direction of the left ventricle (see Fig. 4-6B). This arrow points away from the positive pole of lead V1 and toward the negative pole of lead V6. Therefore, the spread of stimulation to the left during the second phase results in a negative deflection in the right precordial leads and a positive deflection in the left precordial leads. Lead V1 shows a deep negative (S) wave, and lead V6 displays a tall positive (R) wave.
48

In summary, with normal QRS patterns, lead V1 shows an rS type of complex. The small initial r wave represents the left-to-right spread of septal stimulation. This wave is sometimes referred to as the septal r wave because it reflects septal stimulation. The negative (S) wave reflects the spread of ventricular stimulation forces during phase two, away from the right and toward the dominant left ventricle. Conversely, viewed from an electrode in the V6 position, septal and ventricular stimulation produce a qR pattern. The q wave is a septal q wave, reflecting the left-to- right spread of the stimulus through the septum away from lead V6. The positive (R) wave reflects the leftward spread of ventricular stimulation voltages through the left ventricle.
Once again, to reemphasize, the same electrical event, whether depolarization of the atria or ventricles, produces very different looking waveforms in different leads because the spatial orientation of the leads is different.
FIGURE 4-7 R waves in the chest leads normally become relatively taller from lead V1 to the left chest leads. A, Notice the transition in lead V3. B, Somewhat delayed R wave progression, with the transition in lead V5. C, Early transition in lead V2.
49
What happens between leads V1 and V6? The answer is that as you move across the chest (in the direction of the electrically predominant left ventricle), the R wave tends to become relatively larger and the S wave becomes relatively smaller. This increase in height of the R wave, which usually reaches a maximum around lead V4 or V5, is called normal R wave progression. Figure 4-7 shows examples of normal R wave progression.
At some point, generally around the V3 or V4 position, the ratio of the R wave to the S wave becomes 1. This point, where the amplitude of the R wave equals that of the S wave, is called the transition zone (see Fig. 4-7). In the ECGs of some normal people, the transition may be seen as early as lead V2. This is called early transition.
In other cases, the transition zone may not appear until leads V5 and V6. This is called delayed transition.
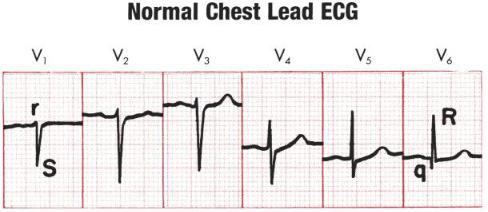
Examine the set of normal chest leads in Figure 4-8. Notice the rS complex in lead V1 and the qR complex in lead V6. The R wave tends to become gradually larger as you move toward the left chest leads. The transition zone, where the R wave and S wave are about equal, is in lead V4. In normal chest leads, the R wave voltage does not have to become literally larger as you go from leads V1 and V6. The overall trend should show a relative increase, however. In Figure 4-8, for example, notice that the complexes in leads V2 and V3 are about the same and that the R wave in lead V5 is taller than the R wave in lead V6.
FIGURE 4-8 The transition is in lead V4. In lead V1, notice the normal septal r wave as part of an rS complex. In lead V6, the normal septal q is part of a qR
50