


Part IV: Topical Cosmeceuticals, Formulations, and Indications
19 Natural Ingredients Used in Cosmeceuticals
Anthony C. Dweck
Dweck Data, Salisbury, Wiltshire, U.K.
INTRODUCTION
The term “cosmeceuticals” should be used with caution, because there are separate pieces of legislation that apply to pharmaceutical and cosmetics in the United Kingdom that have corresponding legislation that applies to the European Union (see Chapter 1). The manufacture of cosmetics and toiletries is more regulated than the food industry but not to the extent of the pharmaceutical industry. The comparison between the production of pharmaceuticals in terms of Good Manufacturing Practice (GMP) and the cosmetics and toiletries industry is not that dissimilar. In European countries, United
States, and Japan, the laws are quite specific, and although these countries strive to achieve parity, there are still many differences between the various legislative docu- ments, particularly in the area of sun care, antiperspirants, and toothpaste.
The European Economic Community (EEC) have Council Directive 76/768/ EEC up to the 27th Amending Directive 2003/15/EC and including the previous 26 amendments and this has to be translated into the language of each member state. In the United Kingdom, the law is Statutory Instrument 2004 No. 2152, The Cosmetic Products (Safety) Regulations 2004. In addition, products must not infringe the Medicines for Human Use (Marketing Authorizations, etc.) Regulations 1994, a very common infringement with today’s eagerness to have “alluring” pack copy. The regulations provide that, unless exempt, any “medicinal product” to which Chapters II to V of Directive 2001/83/EEC apply must not be placed on the U.K. market unless it has a marketing authorization (product license) granted by the European Commission or by the U.K. Licensing Authority. The Act similarly provides that, unless exempt, any other “medicinal product” must not be sold or supplied without a marketing authority. A marketing authorization or product license is only granted for a product that meets statutory standards of safety, quality, and efficacy.
The status of many products that are on the “borderline” between medicinal products and food supplements, cosmetic, or medical devices can be difficult to de- termine. The MHRA have produced a Guidance Note 8 document to explain how and on what basis the MCA decides whether products are medicines or not. It includes guidance on the statutory procedures in Regulation 3A of the Regulations introduced by the Medicines for Human Use (Marketing Authorizations, etc.) Amendment Regulations 2000 (S.I. 2000/292). There is also the requirement to ensure that claims made on the packaging comply with the Trade Descriptions Act 1968, Control of Misleading Advertising Regulations 1988 (as amended). Products must also comply with the Weights and Measures Act 1985. Certain categories (e.g., insect repellants and products that contain this property) may also be subject to the Statutory Instrument 2003 No. 429, The Biocidal Products (Amendment) Regulations 2003.
Compliance with these laws is mandatory in Europe and many countries have adopted them with little alteration. It will be the way of things to come and most
303

304 |
Dweck |
countries are in the process of harmonizing and adopting these legal safeguards. Any company that does not react ahead of the inevitable is going to find it an arduous and almost impossible task to implement in the time frames that are normally allowed for full compliance.
DEFINITION OF NATURAL
A natural is any material that is harvested, mined, or collected, and which may have subsequently been washed, decolorized, distilled, fractionated, ground, milled, separated, or concentrated, leaving a chemical or chemicals that would be available and detectable in the original source material. It is also the modification of natural material by the action of microorganisms, enzymes, or yeasts to modify or increase the yield of material by this process. Naturally derived materials are defined by the use of a natural raw material as the starting point in a chemical process that produces a new chemical or chemicals that in themselves may not be available in nature or in the starting material. Nature-identical materials are substances that have been synthetically produced, not usually from a natural starting material, in order to produce a material that is identical to that naturally occurring in nature.
SOURCES OF DATA FOR PRODUCTS THAT MAY HAVE TOPICAL COSMECEUTICAL BENEFIT
Many ethnopharmaceutical applications for topical application that have been used for countless generations have been tried and tested in those countries where their use is prevalent. In many cases, these are well described in the literature and have been identified from their phytochemical composition, preparation, part used, and dosage.
This search is no longer restricted to the European systems of herbal medicine but now extends to Russian, Chinese, Indian systems of Ayurvedic medicine and Unani, African, and more recently, Aboriginal traditional medicine. Less reliable sources are “grandmother’s recipes” or folklore, which pass from generation to generation without any real scientific basis. The works of the old herbalists such as Galen, Dio- scorides, Culpeper, Hildegarde von Bingen, and Paracelsus (Theophrastus Bombastus von Hohenheim) may give some insights to future investigation. In some cases, these remedies may be discounted after serious evaluation, but there are still many occasions when science substantiates their beneficial use.
PLANTS ARE COMPLEX CHEMICAL FACTORIES
A plant is a complex and ever-active chemical factory that produces a wide range of chemical moieties that it requires for protection against yeast and moulds, resistance to insect attack, even protection against UV and drought conditions in some special- ist plants. Other coastal region plants require very specific protection against salts and excess minerals. It is this complex environment that produces many dozens of chemical entities that may have benefit in human treatments for various skin condi- tions. The composition may vary according to the area of growth (country), the soil, the weather conditions, the time of harvest, the processing, and, of course, the part of the plant that is being extracted. The storage conditions of the plant, the time of extraction, and the solvents used in that extraction will all have a significant implica- tion on the final chemical composition, for example, the content of natural preserva- tives produced by plants to protect the fruit and the leaves will fall dramatically once

Natural Ingredients Used in Cosmeceuticals |
305 |
they have been separated from the main plant. This can be easily demonstrated by smelling a fresh bloom on a living rose and then cutting off that flower. In a matter of minutes, the rose note will alter drastically as the chemical composition alters.
The pharmaceutical industry and the purists would always prefer to work with single chemical entities derived from a single plant. Although this sounds a perfect solution for reproducibility, the truth is very different. Plants tend to have a full orchestra of individual phytochemically active materials that work synergisti- cally. The overall result is that the effect of the individual components is far out- weighed by the blend. In traditional Chinese medicine (TCM), the normal herbal treatment is tailored for an individual and targets both underlying causes and their effects. In the Far East, it is recognized that in some seasons a particular plant may lack potency but that another plant attributed with having the same effect is sub- stantially rich and effective, that is, one plant thrives in a rainy season but suffers in a hot dry season and vice versa. Blends that involve eight or more herbal materials is not uncommon with each pair acting on different indications, such as pruritis, erythema, edema, circulation, granulation, reepithelialization, and cicatrization. Although the terminology used in TCM may seem strange to Westerners, the correlation to terms we do understand and theirs is an almost perfect match.
Fatty Acids
The simplest treatment of dry skin conditions is with fixed vegetable oils. Many of these vegetable, nut, seed, and kernel oils are simple blends of fatty acids with vary- ing carbon chain lengths. Coconut, sunflower, safflower, rapeseed, corn, or sesame seed oil will give perfectly acceptable skin coverage and are most often used as carrier oils for essential oils. These oils will coat the skin to occlude and protect it by slowing down transepidermal water loss and so increasing hydration within the stratum corneum and top layers of the dermis. They will also “glue down” dry and desquamatous skin cells to make the skin look less rough and scaly. Some oils such as castor seed oil (Ricinus communis) are renowned not only for their very high gloss (and so a frequent component in lipsticks and lip salves), but also for their high degree of occlusiveness which makes them ideal for skin protection, for example, diaper or nappy rash creams, where the most traditional and best-known example would be zinc and castor oil cream.
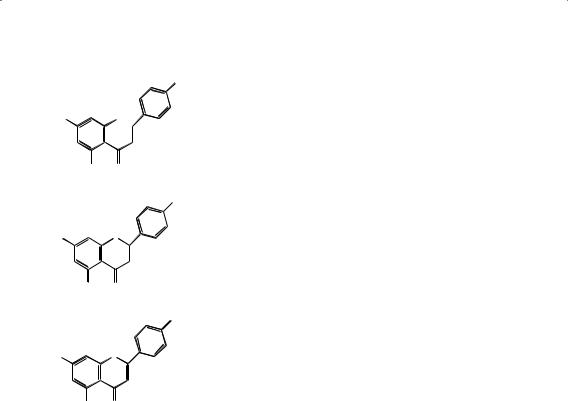
Other oils such as evening primrose oil (Oenothera biennis), borage (starflower) seed oil (Borago officinalis), and blackcurrant seed oil (Ribes nigrum) are particularly useful because of their high γ-linolenic acid content (Fig. 1). Evening primrose used to hold a pharmaceutical license for use on atopic dermatitis, but subsequently lost this status on the publication of further clinical trial data. It is still widely taken orally for mastitis (breast pain).
A new oil, made commercially available in 2006, is inchi oil (Plukentia volubilis), which also has the name Aztec peanut although it is totally unrelated to the peanut (Arachis hypogaea). This oil is abundant in omega-3, omega-6, and omega-12 fatty acids, and could well show huge promise in skin care. Another plant that is rich in
γ-linolenic acid is a particular species of rose hip seed oil (Rosa aff. rubiginosa) that is collected in the foothills of the Chilean Andes and often called Rosa moschata. This
H3C(CH2)4 |
(CH2)4COOH |
Figure 1 |
γ-Linolenic acid. |
|
|
306 |
Dweck |
oil is reputed to contain vitamin A according to some references. A large body of evidence (mainly anecdotal clinical) suggests that this oil has exceptional cicatrizing properties and is an excellent oil for restoring skin elasticity especially for postsurgical conditions where tightness has become a problem for the patient. It was also shown to be effective for treating the hyperpigmentation of certain scar tissues.
Flavonoids
“Flava” means yellow in Greek and the collective name of flavonoids for this group of compounds was proposed by Geissman in 1952. This is a very large group of compounds showing extraordinary diversity and variation and as the Greek root for the word suggests, many of these compounds are yellow in color. They consist of a number of structurally related groups of products, which are often identified as polyphenols. Many have a basic skeleton (Fig. 2) that contains 15 carbon atoms, which are usually subdivided into one part made up from a phenolic (6C) moiety and another which has a cinnamic acid molecule (C13) as a building block. The group called the chalcones may be considered as the Friedel-Crafts reaction product of a (substituted) cinnamic acid and a phenol.
The flavonoids in red wine (Vitis vinifera) such as quercetin, kaempferol, and anthocyanidins account for the free radical–scavenging activity. In green tea (Camellia sinensis or Thea viridis), it is the catechins and catechin gallate esters that are shown to be effective antioxidants against free radicals. The dietary effectiveness of these materials has been known for generations and similar antioxidant effective- ness has been shown to occur when these materials are topically applied to protect skin cells.
Flavonoids also are a source of natural color, with yellows from the chalcones and flavonols, and reds, blues, and violets from the anthocyanidins. The flavones are colorless, but are still able to absorb UV strongly and so act as a beacon to pollinating insects. The exploitation of these molecules as a source of natural color in cosmet- ics and toiletries is just beginning, but their poor light stability is often a stumbling block. Flavonoids may be found as their glycosides. These are molecules that are substituted on one or more of the hydroxyl groups with a sugar such as galactose, glucose, mannose, or rhamnose, etc. The aglycons do not carry a sugar moiety.
Chalcones
Chalcones act as precursors for an enormous range of flavonoid derivatives. Re- ductive ring closure of chalcones results in the formation of a flavone. Naringenin chalcone (Fig. 3A) is converted to a flavanone, naringenin (Fig. 3B), from which api- genin (Fig. 3C) (4′,5,7-trihydroxyflavone) is formed. Flavones are generally found in herbaceous families such as Labiatae, Umbelliferae, and Compositae. Flavones have the skeleton 2-phenylchromen-4-one and include apigenin, baicalein, chrysin, dios- metin, diosmin, flavone, luteolin, tangeretin, techtochrysin, rhamnazin, nobiletin,
O |
Figure 2 Chalcone skeleton. |
Natural Ingredients Used in Cosmeceuticals |
307 |
||
|
|
OH |
|
HO |
OH |
|
|
OH |
O |
|
|
(A) |
|
|
|
|
|
OH |
|
HO |
O |
|
|
OH |
O |
|
|
(B) |
|
|
|
|
|
OH |
|
HO |
O |
|
|
OH |
O |
Figure 3 Chalcone conversions: |
(A) naringenin chalcone, |
(C) |
|
||
|
(B) naringenin, and (C) apigenin. |
|
|
and natsudaidain. The most common flavones are apigenin found in celery (Apium graveolens) and parsley (Carum petroselinum); luteolin found in German chamomile (Matricaria recutita) and horsetail (Equisetum arvense), and diosmetin found in rosemary (Rosmarinus officinallis). All these materials are known for their soothing, calm- ing, and cicatrizing effects, although each has additional properties that are a result of other chemical moieties within their constituents, for example, the silicate content in horsetail gives it nail strengthening properties. The flavones often occur as glyco- sides. Flavones also occur in nature in association with tannins (polyesters of gallic acid; 3,4,5-trihydroxybenzoic acid). Gallic acid and its esters (e.g., propyl gallate, dodecyl gallate) are well-known powerful antioxidants, and it is probable that these products fulfill a similar role in higher plants.
Flavones
The simplest representative of the group of flavones is “flavone” (Fig. 4), which does not carry any hydroxy, methoxy, or glycosidic groups.
Flavanone Glycosides
The flavanone glycosides are very important, because they include naringin (Fig. 5A), which has been found specifically in grapefruit peel and seeds, and hesperidin (Fig.
5B) found in citrus peels and seeds. These materials have been shown to exhibit antimicrobial activity and have been used as preservatives (even though they are not listed in Annex VI of permitted preservatives).

308 |
Dweck |
O
|
|
Figure 4 Flavone. |
O |
Aurones
Some aurones occur naturally. In this group, the six-membered heterocyclic ring is replaced by a five-membered ring. An example of an aurone is sulfuretin, 6,3′,4′- trihydroxyaurone (Fig. 6) found in Rhus verniciflua and Dalbergia odorifera, which are being studied for their anti-inflammatory properties.
Flavonols
The most common flavonols (3-hydroxyflavones) are kaempferol, quercetin (Fig. 7), and rhamnetin. The name for quercetin comes from the genus in which the chemical was first identified, namely, Quercus spp., or oak, but the highest levels have been seen in evening primrose leaf (O. biennis) and the sap of mayapple (Podophyllum peltatum).
Kaempferol (Fig. 7B) is found in neem or Nimba flowers (Azadirachta indica) and pea (Pisum sativa). It is also widely found throughout the Brassica spp., such as cabbage, kohlrabi cauliflower, and kale. Interestingly, these plants have not been exploited for their anti-inflammatory activity. The flavonols also exist as flavonol glycosides such as rutin (Fig. 8), found in buckwheat (Fagopyrum esculentum) and rue (Ruta graveolens).
Isoflavones
The isoflavones (Fig. 9A) are mainly found within the Leguminosae (specifically in the sub-family Papilionoideae), although many other species (e.g., Compositae, Iridaceae, Myristicaceae, and Rosaceae) contain these chemical moieties (1). These
HO |
|
|
|
|
|
|
|
|
|
|
|
|
|
|
|
|
|
|
|
|
|
|
|
|
|
|
|
|
O O-naringeni |
|
|
|
|
|
|||||||
|
|
|
|
|
|
|
|
|
|
|
|
|
||||||||
|
|
OH |
|
|
|
|
|
|||||||||||||
|
|
|
|
|
|
|
|
|
|
|
|
|
|
|
||||||
HO |
|
|
|
|
|
|
|
|
|
|
|
|
|
|
|
|
|
|
|
|
|
|
|
|
|
|
|
|
|
|
|
|
|
|
|
|
|
|
|
||
|
|
|
|
|
|
|
|
|
|
|
|
|
|
|||||||
HO |
|
O O |
|
|
|
|
|
|
|
|
|
|
||||||||
CH3 |
|
|
|
|
|
|
|
|
|
|
|
|
|
|||||||
|
|
|
|
|
|
|
|
|
|
|
|
|
|
|
|
|||||
OH |
OH |
|
|
|
|
|
|
|
|
|
|
|||||||||
(A) |
|
|
|
|
|
|
|
|
|
|
|
|
|
|
|
|
|
|
|
|
|
|
|
|
|
|
|
|
O |
|
|
CH2 |
|
|
|
|
OCH3 |
||||
HO |
|
|
O |
|
|
O |
|
|
|
|
||||||||||
|
|
|
|
|
|
|
|
|
OO |
|
|
|
|
|
|
|||||
CH3 |
|
|
|
|
|
|
|
|
|
|
OH |
|||||||||
HO |
|
|
|
|
|
OHHO |
OH |
|
|
|
|
|
|
|
|
|||||
|
|
|
|
|
|
|
|
|
|
|
|
|
|
|
||||||
|
|
|
|
|
|
|
OH |
|
|
|
|
|
|
|||||||
|
|
|
|
|
|
|
|
|||||||||||||
|
|
|
|
|
|
|
|
|
|
|
|
|
|
|
|
|
|
|
||
(B) |
|
|
|
|
|
|
|
|
|
|
|
|
|
OH |
O |
|
|
|
Figure 5 Flavone glycosides: (A) naringin |
|
|
|
|
|
|
|
|
|
|
|
|
|
|
|
|
|
|
|
|||
|
|
|
|
|
|
|
|
|
|
|
|
|
|
|
|
|
|
and (B) hesperidin. |
||

Natural Ingredients Used in Cosmeceuticals |
309 |
OH
OH
HO O
O |
Figure 6 Sulfuretin. |
isoflavones can act as steroidal mimics by filling the stereochemical space that could be occupied by estrogenic compounds. This spatial chemistry helps explain the ef- fects of many nutritional herbal supplements and topical preparations (Fig. 9B,C).
Daidzein is a phytoestrogen (also called a phenolic estrogen, to distinguish it from a steroidal estrogen such as 17β-estradiol). The activity of phytoestrogen is much weaker than steroidal estrogens, varying from 0.005% to 2% (2). The estro- genic properties are insufficient in strength to replace steroidal estrogens, but they do have significant value in reducing the effects of aging and improving the quality of the skin. Phytoestrogens may also be viewed in relation to the phytochemical division of terpenoids, which comprise the largest group of natural plant products. All terpenoids are biogenetically derived from isoprene. The largest group of terpenoids are the triterpenoids, which include, among other divisions, the triterpenoid and steroid saponins and the phytosterols.
Nature has a rich portfolio of phytosterols, and it is easy to understand why compounds such as stigmasterol and β-sitosterol (Fig. 10A,B) have anti-inflammatory effects and are capable of reducing swelling and erythema when their structure is compared to corticosterone (Fig. 10C) and hydrocortisone (Fig. 10D).
The most commonly occurring isoflavones are: ▪ Biochanin A 5,7-Dihydroxy-4′-methoxyisoflavone
▪Daidzein 4′,7-Dihydroxyisoflavone
▪(±)-Equol 4′,7-Isoflavandiol
▪Formonometin 7-Hydroxy-4′-methoxyisoflavone
▪Glycitein 4′,7-Dihydroxy-6-methoxyisoflavone
▪Genistein 4′,5,7-Trihydroxyisoflavone
▪Genistein-4′,7-dimethylether 5-Hydroxy-4′,7-dimethoxyisoflavone
▪Prunetin 4′,5-Dihydroxy-7-methoxyisoflavone
|
|
OH |
HO |
O |
OH |
|
|
|
|
|
OH |
OH |
O |
|
|
|
OH |
HO |
O |
|
|
|
OH |
OH |
O |
Figure 7 Flavonols: (A) quercetin and (B) kaempferol. |

310 |
|
Dweck |
|
|
OH |
HO |
O |
OH |
|
|
|
|
|
O-rutinose |
OH |
O |
Figure 8 Rutin. |
With the associated glucosides:
▪Genistin Glucosyl-7-genistein
▪Glycitin 4′,7-Dihydroxy-6-methoxyisoflavone-7-d-glucoside
▪Ononin Formononetin-7-O-glucoside
▪Sissotrin Biochanin A-7-glucoside
Daidzein
Daidzein (7-hydroxy-3-(4-hydroxyphenyl)-4H-1-benzopyran-4-one,4′,7-dihydroxyiso- flavone) is a solid substance that is virtually insoluble in water. Daidzin, which has greater water solubility than daidzein, is 7-β glucoside of daidzein. Daidzein, the aglycone of daidzin, is an isoflavone and a phytoestrogen. The isoflavone is found naturally as the glycoside daidzin and as the glycosides 6″-O-malonyldaidzin and 6″-O-acetyldaidzin (Fig. 11A,B). Daidzein and its glycosides are mainly found in the
Leguminosae family that includes soybeans and chickpeas. Daidzein glycosides are the second most abundant isoflavones in soybeans and soy foods; genistein glyco- sides are the most abundant. Nonfermented soy foods, such as tofu, contain daidzein,
8 |
1 |
|
|
7 |
O |
2 |
|
|
|
||
|
|
2' |
|
|
4 |
3 |
|
6 |
1' |
||
|
|
3' |
|
|
|
|
|
5 |
O |
|
|
|
6' |
4' |
|
|
|
||
|
|
|
5' |
(A)
HO O
O
OH
(B)
HO
CH3 OH
(C)
Figure 9 Isoflavones: (A) isoflavone skeleton structure, (B) estrogen receptor with daidzen, and (C) estrogen receptor with 17β-estradiol.

Natural Ingredients Used in Cosmeceuticals |
311 |
CH3

 CH3 CH3 H
CH3
CH3 H

 H
H  H HO
H HO 

(A)
CH3
CH3
|
CH3 H |
CH3 |
|
CH3 |
H |
||
|
|||
H |
H |
|
|
HO |
|
|
|
(B) |
|
|
|
|
O |
OH |
|
|
CH3 |
||
HO |
|
||
|
|
||
CH3 |
H |
|
|
H |
H |
|
|
O |
|
|
(C)
O
HO CH3


 OHOH CH3
 H
H 


 H
H  H O
H O


(D)
Figure 10 (A) Stigmasterol, (B) β-sitosterol, (C) corticosterone, and (D) hydrocortisone.
principally in its glycoside forms. Fermented soy foods, such as tempeh and miso, contain significant levels of the aglycone.
Kudzu Vine (Pueraria labata)
The root of P. labata is an herbal medicine commonly known as the kudzu vine. It has been used for the treatment of alcohol abuse for centuries in TCM and thought to be effective because of the daidzein and daidzin found in the herb (3).
White Kwao Krua (Pueraria mirifica)
In addition to genistein, daidzein, daidzin, and genistin, the plant contains some unique isoflavones such as kwakhurin, kwakhurin hydrate (Fig. 12A), and puerarin (Fig. 12B) (4). The roots also contain mirificoumestan (Fig. 12C), deoxymiroestrol (Fig. 12D), and coumestrol (Fig. 12E). The traditional use of the plant is clearly for the hormonal properties, because in Thailand, it is used for breast development. When P. mirifica is taken as a dietary supplement, its phytoestrogen constituents

312 |
|
|
Dweck |
|
|
O |
OH |
O |
|
|
|
COOH |
|
|
|
|
|
|
|
O |
O |
|
|
O |
|
O |
|
|
OH |
|
|
|
|
|
|
|
OH |
|
|
OH |
|
|
|
(A) |
|
|
|
|
|
O |
OH |
O |
|
|
|
|
|
|
|
O |
O |
|
|
O |
|
O |
|
|
OH |
|
|
|
|
|
|
|
OH |
|
|
OH |
|
|
|
(B) |
|
|
Figure 11 (A) Malonyldaidzin and (B) acetyldaidzin. |
will naturally alleviate symptoms occurring as a result of the aging process and a deficiency in estrogen levels. Aging signs and symptoms will, to a certain extent, be reversed. The rich source of sterols and phytohormones also indicates the plant for the topical treatment of wrinkles and aging skin conditions.
Red Clover (Trifolium pratense L.) (Leguminosae)
Red clover flower heads contain the following isoflavones: biochanin A, daidzein, formononetin, genistein, pratensein, and trifoside. The plant has alterative, antispasmodic, expectorant properties and is a sedative dermatological agent. Its main use is for skin complaints such as psoriasis and eczema, as well as an expectorant in coughs and bronchial conditions (5). Biochanin A (Fig. 13A) and formononetin (Fig. 13B) are two isoflavones from red clover. They are very similar to genistein and daidzein, ex- cept that the hydroxyl groups have been methylated. These two isoflavones are con- siderably less estrogenic in their original forms; the stereochemistry of the methoxy groups means they are not able to efficiently bind to estrogen receptors. However, once ingested, they are demethylated by bacteria in the colon; biochanin A becomes genistein (Fig. 13C) and formononetin becomes daidzein. Daidzein can be further metabolized to equol (Fig. 13D). Internally, therefore, biochanin A and formononetin are a source of considerable estrogenic activity. It may well be that these mechanisms give red clover its reputation as an alterative remedy, cleansing the system yet mild enough for many children’s skin problems, even eczema. A lotion of red clover can be used externally to give relief from itching and other skin disorders (6). Red clover is recommended for athlete’s foot, sores, burns, and ulcers (7), and has been used in the herbal treatment of cancer, especially of the breast or ovaries (8). It is also a very popular alternative remedy for hormone replacement therapy.
Sweet Yellow Melilot (Melilotus officinalis)
Melilot is soothing, astringent, and anti-irritant possessing similar properties to red clover. It may also be anti-inflammatory, antiedema, and anesthetic (9). However, it is perhaps not the isoflavones at force here, but possibly the β-sitosterol or coumarin contained in the roots. M. officinalis L. extract, containing 0.25% coumarin (Fig. 14),

Natural Ingredients Used in Cosmeceuticals |
313 |
HO O
R
OCH3
(A)
HO
(B)
(C)
HO
(D)
OHO

 OH
OH
kwakhurin

 OH kwakhurin hydrate
glucose O
O 
 OH
OH
O O
OCH3
O

 OH
OH
OH
OH
O
O
HO |
O |
O |
O |
OH |
|
(E)
Figure 12 Chemicals contained in white kwao krua: (A) kwakhurin, kwakhurin hydrate; (B) puerarin; (C) mirificoumestan; (D) deoxymiroestrol; and (E) coumestrol.
was studied on acute inflammation induced with oil of turpentine in rabbits. The extract demonstrated anti-inflammatory effects similar to those of hydrocortisone sodium hemisuccinate (10).
Phytosterols and Related Compounds
The benefits of phytosterols may be seen in herbal materials indicated for arthritis, such as frankincense (Boswellia serrata). The boswellic acid (Fig. 15) present inhibits two inflammatory enzymes, 5-lipoxygenase (which produces leukotrienes) and hu- man leukocyte elastase (which degrades elastase). The Department of Biochemical Pharmacology of the Imperial College School of Medicine has prepared a paper

314 |
Dweck |
|
HO |
O |
|
|
OH |
O |
O |
|
|
|
|
|
|
|
CH3 |
|
(A) |
|
|
|
HO |
O |
|
|
|
O |
O |
|
|
|
|
|
|
|
CH3 |
|
(B) |
|
|
|
HO |
O |
|
|
OH |
O |
OH |
|
|
|
|
|
(C) |
|
|
HO |
O |
|
|

 OH
OH
(D)
Figure 13 Isoflavones from red clover and their metabolites: (A) biochanin A, (B) formononetin, (C) genistein, and (D) equol.
for discussion: “Assessment of the estrogenic potency of phyto-compounds.” This reviewed the available information on cellular and molecular mechanisms and phytoestrogen potencies. Taking all estrogen receptor binding assays into account, the review proposed the following rank order of phytoestrogen potency: estradiol >> coumestrol > 8-prenylnaringenin > equol ≥ genistein > biochanin A > daidzein > ge- nistein glucuronide* > daidzein glucuronide* > formononetin (the activity of those compounds marked * may be attributable to the presence of activating enzymes present in the receptor preparation). Phytoestrogens stimulated in vitro cell prolif eration at concentrations of 0.1 to 10 mM (3- to 4-fold less than estradiol). They did not induce the maximal proliferative effect of estradiol because higher con- centrations inhibited proliferation. Most endogenous estrogens (>90%) were not freely available but bound to plasma proteins. Phytoestrogens bound at 1/100th to
1/1000th of the affinity of estradiol. The availability of phytoestrogens in plasma relative to estradiol will be greater. Coumestrol, 8-prenylnaringenin, and equol were more than 1000-fold less potent than estradiol and the isoflavones more than
10,000-fold less potent.
O |
O |
|
|
Figure 14 |
Coumarin. |

Natural Ingredients Used in Cosmeceuticals |
315 |
||
|
|
CH3 |
|
|
|
H3C |
|
|
|
CH3 |
|
|
CH3 CH3 H |
|
|
|
H |
CH3 |
|
HO |
H |
|
|
|
|
|
|
HOOC CH3 |
Figure 15 |
Boswellic acid |
|
Wild Yam (Dioscorea villosa)
The wild yam (D. villosa) was the source of diosgenin (Fig. 16A), a steroidal saponin used as the starting point for the commercial source of pregnanolone (Fig. 16B) and progesterone (Fig. 16C), which were used in the first birth control pills. The root of
Dioscorea is used for numerous purposes, but its major use is for the suppression of menopausal symptoms such as hot flashes (11). During pregnancy, small frequent doses of wild yam will help allay nausea (12). As an antispasmodic, it is valuable in neuralgic affections such as spasmodic hiccup and spasmodic asthma (13). It has
HO
(A)
HO
(B)
O
(C)
HO
(D)
H3C O CH3 H
CH3 H H O
HH
O CH3
CH3
CH3 H
H H
H
O CH3
CH3
CH3 H
H H
CH3O
H
H H
H
CH3
Figure 16 (A) Diosgenin, (B) pregnanolone, (C) progesterone, and (D) estrone.
316 |
Dweck |
potential in skin care and body care, being anti-inflammatory and anti-rheumatic. It is also cited for dysmenorrhea, and ovarian and uterine pain (14,15).
It is interesting to note that Vitex agnus-castus is a source of natural progesterone, and many documented studies have investigated the use of these products to treat various gynecological disorders (16). The fruit of Vitex contains essential oils (including limonene, 1,8-cineole, and sabinene), iridoid glycosides (agnuside and aucubin), and flavonoids (including castican, orientin, and isovitexin). The active constituents have been determined as 17-α-hydroxyprogesterone (leaf), 17hydroxyprogesterone (leaf), androstenedione (leaf), δ-3-ketosteroids (leaf), epites- tosterone (flower), progesterone (leaf), testosterone (flower and leaf) (17,18).
It is highly unlikely that diosgenin in the plant could ever be metabolized to a corticosteroid or hormonal derivative on application to the skin. However, it does seem likely that this material (being the precursor to these estrogenic molecules) will, to some extent, mimic the function of those pharmaceutical active materials and benefit the skin (19). However, the production of wild yam was unable to sus- tain the demand for diosgenin as the starting precursor, for the production of birth control materials, which was dominated by estrone (Fig. 16D).
Fenugreek (Trigonella foenum graecum)
The world turned its attention to fenugreek (T. foenum graecum) for its source of diosgenin. Fenugreek seeds are emollient and accelerate the healing of suppuration and inflammation. Seeds are cooked with water into a porridge and used as hot compresses on boils and abscesses in a similar manner to the usage of linseed (20). A cataplasm obtained by boiling the flour of the seeds with vinegar and saltpeter is used for swelling of the spleen (21). Extracts of the seeds are incorporated into several cos- metics claimed to have effect on premature hair loss and as a skin cleanser (22), and it is also present in hair tonics and claimed to cure baldness (23). Many of the herbal ma- terials found to have an effect on hair growth have a hormonal or hormonal-mimetic basis. Likewise, there are a number of references to fenugreek having galactagogue (increase milk in nursing mothers) activity (8,24,25), which again is indicative of an estrogen-like activity. Fenugreek is reputed to be oxytocic and uterine stimulant ac- tivity has been documented in vitro (16), so its use during pregnancy and lactation is not advisable.
Pomegranate (Punica granatum)
The seeds of pomegranate, an ancient symbol of fertility, contain an estrone identical to the genuine hormone, and they are the best source of plant estrone (26). Pomegranate fermented juice and seed oil showed strong antioxidant activity (determined by measuring the coupled oxidation of carotene and linoleic acid), close to that of butylated hydroxyanisole (Fig. 17) and green tea, and significantly greater than that of red wine (27). This is clearly a fruit worthy of further exploration. The rind is used as an astringent (28) and the leaf has antibacterial properties (29).
Date Palm (Phoenix dactylifera)
A decrease of normal body hormones plays a role in skin aging, reduced skin thickness, and the disturbance of normal collagen turnover, which in turn results in a decrease in collagen I and III synthesis. Date palm kernel has seven compounds with regenerative, anti-oxidizing, firming, and soothing properties, extracted: phytosterols, phytosteroids, ursolic acid, isoflavones, policosonols, provitamin A, and vitamin E. Some studies suggest that dehydroepiandrosterone (DHEA) (Fig. 18), known for its

Natural Ingredients Used in Cosmeceuticals |
317 |
OH
C(CH3)3
OCH3 |
Figure 17 Butylated hydroxyanisole. |
capacity to promote keratinization of the epidermis, would have a beneficial effect against signs of aging. The effects of date palm kernel extract were compared with those of DHEA using ex vivo skin. There was a decrease of wrinkles within five weeks of date palm kernel extract application and the skin structure was also improved in a way superior to that of DHEA (30). The seed and the pollen have both been shown to contain estrone and this may further explain the reasons for this activity (31,32).
Hops (Humulus lupulus)
The hop contains β-sitosterol, estradiol, stigmasterol, and estrone, together with many other materials that are known for their sedative attributes. Regular doses of the herb can help regulate the menstrual cycle (33). It had long been known that menstrual periods came early in young girls hop picking. Considerable amounts of estrogen (30,000–300,000 IU per 100 g) have been found in hops. The presence of antiandrogens may explain why hops will suppress sexual excitement in men (26). Hop extract recovered the proliferation of hair follicle derived keratinocyte suppressed by androgen, stimulated the proliferation of hair follicle keratonicytes and demonstrated a potent acceleration of hair growth (34).
Sarsaparilla (Smilax ornate)
Sarsaparilla is used in concoctions with other plants as a tonic or aphrodisiac (35). It was formerly used in the treatment of syphilis (36), gonorrhea (37), rheumatism, and certain skin diseases. Used in soft drinks, the genins are also used in the partial synthesis of cortisone and other steroids (6). It is especially useful as part of a wider treatment for chronic rheumatism. It has also been shown that sarsaparilla contains chemicals with properties that aid testosterone activity in the body (15). Sarsaparilla contains saponins, sarsaponin, and parallin, which yield isomeric sapogenins, sarsapogenin, and smilogenin. It also contains sitosterol and stigmasterol in the free form and as glucosides. It is antirheumatic, antiseptic, antipruritic, and indicated for psoriasis and other cutaneous conditions. It is specifically used in cases of pso- riasis especially where there is desquamation (14).
Sugars, Polysaccharides, and Mucopolysaccharides
The skin appears to have an affinity for sugars, and there are many examples where they have been shown to have a significant cutaneous effect. In Third World countries
|
CH3O |
CH3 |
H |
H |
H |
HO |
Figure 18 Prasterone or dehydroepiandrosterone. |

318 |
Dweck |
and poorer communities, honey, the first choice as a natural source of these sugars, has been shown to be of great benefit in the treatment of burns, scalds, and wounds, especially because it has antibacterial properties when used undiluted. Reepithelialization is accelerated, granulation is even, and there is less necrotic tissue formed. Honey absorbs exudates and makes noninvasive cleaning simple and painless.
Mucopolysaccharides are present in numerous plant materials, including the ribwort and greater plantains (Plantago lanceolata and Plantago ovata). Mucilages are found in numerous species of seaweeds, for example, bladderwrack (Fucus vesiculosus), sea lettuce (Ulva lactuca), and oarweed, tangleweed, or kombu (Laminaria digitata). These plants have similar effects and they are used for dry, desquamatous, pruritic skin conditions.
SPECIALIST PLANTS
There are a number of plants that have unique chemical entities and are specific for treating skin diseases and damage.
Gotu Kola (Centella asiatica)
C. asiatica (Indian pennywort or cotyle) is an important medicinal herb in India. Its Sanskrit name is Brahmi and in Tamil it is known as Mandukaparni. An infusion of the leaves and stems has long been used in India for leprosy and other skin diseases.
Asiaticoside (Fig. 19) was found to be active against leprosy (by dissolving the waxy coating of Mycobacterium leprae) and an oxidized form, oxyasiaticoside, inhibited growth of tubercle bacillus in vitro and in vivo (38,39).
C. asiatica extracts are used for the treatment of skin ailments, particularly ulcers, wounds, and for prevention of keloid and hypertrophic scars. Centella extracts have been found to accelerate wound healing, particularly in cases of chronic, post- surgical, and posttraumatic wounds. Extracts have also been successfully used as a therapy in the treatment of secondand third-degree burns. The pharmacological activity of C. asiatica is thought to be attributable to several saponin constituents, including the asiatic acid and madecassic acid, and both compounds stimulate the production of human collagen I, a protein involved in wound healing. Asiaticoside
|
|
|
|
|
CH3 |
|
|
||
|
|
|
|
H3C |
|
|
|
|
|
HO |
|
|
CH3 |
CH3 |
H |
|
O |
||
|
|
|
|
|
|
|
|
|
|
|
|
|
H |
CH3 |
|
|
|||
HO |
|
|
H |
|
|
|
|
|
|
HO |
|
|
|
|
|
|
|
|
|
|
|
CH3 |
|
|
|
|
|
|
|
|
|
HO |
O O |
CH2 |
|
|
|||
|
|
|
|
|
|
||||
|
|
|
|
O |
|||||
|
|
|
OH |
|
|
O |
|
|
|
|
CH3 |
|
OH |
|
|
||||
|
OH |
HO |
|
|
|
|
|||
|
|
|
|
|
|||||
HO |
|
O O |
|
|
OH |
||||
|
|
|
|
|
|
||||
|
|
|
|
|
|
|
|
|
|
|
|
|
OH |
|
|
|
|
|
|
|
OH |
|
|
|
|
|
Figure 19 Asiaticoside. |
||

Natural Ingredients Used in Cosmeceuticals |
319 |
is effective in accelerating the healing of superficial postsurgical wounds and ulcers by an acceleration of cicatricial action.
Topical application of asiaticoside has been shown to promote wound healing in rats and significantly increased the tensile strength of the newly formed skin. Ex- tracts of C. asiatica, and in particular asiaticoside, have also been shown to be valuable in the treatment of hypertropic scars and keloids. The mechanism is because of the effect of the plant on the synthesis of collagen and acidic mucopolysaccharides, and by the inhibition of the inflammatory phase of hypertropic scars and keloids. Asiaticoside is likely to interfere with scar formation by acting on myofibroblasts and immature collagen (40).
Licorice (Glycyrrhiza glabra)
Theophrastus recommended licorice for quenching thirst, to combat cramps caused by stomach ulcers and asthma. Napoleon chewed licorice root regularly and eventually blackened his teeth (41). Licorice is one of the most commonly used plant materials in TCM, and various species, including Glycyrrhiza glabra, Glycyrrhiza uralensis, and Glycyrrhiza inflata, are used. The roots are most often used with other herbs to mediate their effects (41). It was introduced into Britain by the Black Friars in the 16th century and was later cultivated extensively in the Pontefract district of Yorkshire
(43). Glycyrrhizin, a triterpenoid saponin found in the roots, has anti inflammatory and antiallergic activity, the former attributed to the corticosteroid-like activity of glycyrrhetinic acid or enoxolone (Fig. 20A) and glycyrrhizin (Fig. 20B) (40).
Comfrey (Symphitum officinale)
Comfrey’s medieval reputation for knitting broken bones is reflected in its name of knitbone, which comes from the Latin conferre, meaning to bring together (45). The plant contains allantoin (Fig. 21), which acts as a vulnerary because of its cell prolifer- ant effect. The demulcent action is because of the high mucilage content. Significant anti-inflammatory activity has been demonstrated in vivo (46). The plant also contains
|
|
|
|
|
H3C |
COOH |
|
|
|
|
O |
H |
|
|
|
|
|
|
|
|
|
|
|
|
CH3 |
CH3 |
CH3 |
|
|
|
|
H |
CH3 |
|
HO |
|
|
H |
|
|
|
H3C |
|
|
|
|
||
|
CH3 |
|
|
|||
(A) |
|
|
|
|
|
|
|
COOH |
glycyrrhetinic ac |
||||
|
|
|
|
O O |
|
|
|
|
|
|
|
|
|
|
OH |
|
|
|||
HO |
|
|
|
|
|
|
COOH |
|
|
||||
|
|
|
O O |
|
|
|
OH |
|
|
|
|||
|
|
|
|
|
||
HO |
OH |
|
|
|||
|
|
|
Figure 20 (A) Glycyrrhetinic acid (enoxolone) and (B) glyc- |
|||
(B) |
|
|
|
|
||
|
|
|
|
yrrhizic acid. |
||

320 |
|
Dweck |
H |
H |
|
H2N N |
N |
O |
O |
|
NH |
O |
|
Figure 21 Allantoin. |
mucilage, tannins, starch, and two alkaloids, consolidine and symphytocynglossine. Large amounts of potassium, phosphorus, and vitamins A and C are also present (47).
Aloe Vera (Aloe barbadensis)
There are many studies on the healing power of aloe vera. Aloe-treated wounds in dogs had smaller unhealed areas than untreated controls and wounds treated with antibiotics (48). Mannose-6-phosphate is the major sugar in aloe, and mice receiving 300 mg/kg of mannose-6-phosphate had improved wound healing over saline controls (49).
After full-face dermabrasion, the abraded face was divided in half. One side was treated with a standard polyethylene oxide gel wound dressing, and the other was treated with a similar gel dressing saturated with stabilized aloe vera. By 24 to 48 hours, there was dramatic vasoconstriction and accompanying reduction in edema on the aloe-treated side. By the third to fourth day, there was less exudate and crust- ing at the aloe site, and by the fifth to sixth day the reepithelialization at the aloe site was complete. Overall, wound healing was approximately 72 hours faster at the aloe site. This acceleration in wound healing was important to reduce bacterial contamination, subsequent keloid formation, and pigmentary changes (50).
The influence of oral and topical aloe vera on wound healing (induced using a biopsy punch) in mice was studied. In the oral study, test animals received aloe vera (100 mg/kg/day) in drinking water for 2 months, and the controls received water only. In the topical study, test animals were given 25% aloe vera cream and the controls received cream only. There was a 62.5% reduction in wound diameter (oral aloe vera group) and a 50.8% reduction (topical aloe vera group). These data suggest that aloe vera is effective by both oral and topical routes of administration (51).
Eight topical agents in current use were studied for their effects on wound con- traction and rate of reepithelialization of full thickness skin excisions in pigs. The fol- lowing were applied daily for 27 days: scarlet red ointment, benzoyl peroxide lotion, bacitracin ointment, silver sulfadiazine cream, aloe vera gel, tretinoin cream, capsa- icin cream, and mupirocin ointment. Reepithelialization was significantly enhanced by capsaicin, bacitracin, silver sulfadiazine, and scarlet red, and was markedly re- tarded by tretinoin. Wound contraction was significantly retarded by mupirocin, bacitracin, and silver sulfadizine. Knowledge of the effects of topical agents on vari- ous aspects of healing allows the clinician to choose the most appropriate material to use in a given clinical situation to optimize the healing process (52).
Aloe vera (100 and 300 mg/kg daily for 4 days) blocked the wound healing suppression of hydrocortisone acetate by up to 100% using the wound tensile strength assay. The growth factors present in aloe vera mask wound healing inhibitors such as sterols and certain amino acids. The sterols showed good anti inflammatory ac- tivity in reducing the croton oil induced ear swelling (53,54). The use of aloe in treating leg ulcers has been described (55). Kligman writes in his conclusions, “It is our opinion that the Aloe vera materials tested did not interfere with the nor- mal rate of superficial dermal wound reepithelialization nor did they enhance the process any faster than the covered nontreated control wounds at the end of three

Natural Ingredients Used in Cosmeceuticals |
321 |
||||||
|
OH |
|
|
|
|||
HO |
|
|
|
|
|
|
|
HO |
|
|
O |
|
OH O |
|
|
|
|
|
O |
|
|
||
|
O |
|
OH |
|
|||
|
|
|
|
|
|
O |
|
|
|
|
|
|
|
||
|
|
|
HO |
OH |
|
||
|
|
|
|
|
|
OH |
|
|
|
|
|
|
|
OH |
|
(A) |
|
|
|
|
|
|
|
|
|
|
O OH |
|
|
|
|
|
|
|
R |
R = CH2OH |
|
||
|
HO |
|
|
|
|
|
|
|
|
|
|
|
|||
(B) |
|
OH OH |
|
|
Figure 22 (A) Hamamelitannin and (B) |
||
|
|
|
|
|
|
hamamelose. |
|
weeks. It can be stated that the wounds treated with Aloe vera healed better than uncovered wounds and were more cosmetically gratifying” (56). A review of the literature showed that the healing, soothing, and cooling claims routinely made for aloe are justified (57). Aloe vera also has a prophylactic effect in the protection of the skin against UV radiation (58) and also protects the skin against the radiation produced in radiotherapy treatment (59–61).
Witch Hazel (Hamamelis virginiana)
Known as hamamelis, snapping hazel, winter bloom, spotted alder, tobacco wood, and hamamelis water, witch hazel is a well-known plant with a long history of use in the Americas. Uses include the treatment of hemorrhoids, burns, and eye irritation. Preparations have been used topically for symptomatic treatment of itching and other skin inflammation, and its drying and astringent effects help treat skin inflammation (62) and also protects against infection. The astringent action is be- cause of the hamamelitannin (Fig. 22A) and hamamelose (Fig. 22B). Inflammation of mucous membranes including mouth, throat, and gums may also be treated with a witch hazel gargle. It is also used for swollen or tired eyes, to relieve the pain of sunburn, as a face splash for oily skin, and to control minor pimple formation. It reduces the pain of insect bites and can be used cold or with ice to reduce the pain of sprains or athletic injuries including bruises. It is used in some hospital recovery rooms to reduce the swelling from intravenous feeding (63).
CONCLUSIONS
A plant is a complex chemical factory, where each chemical component delivers spe- cific properties that in concert are often synergistic in their performance. In addition to some of the simple categories discussed herein, there are numerous plant species that have chemicals that are unique to them.
REFERENCES
1.Boland GM, Donnelly DMX. Isoflavonoids and related compounds. Nat Prod Rep 1998:241–260.

322 |
Dweck |
2.Brand-Garnys E, van Dansic P, Brand HM. Flavonoids: looking in the face of cosmeceuticals. SÖFW 2001; 127(1/2):8.
3.Keung W-M, Vallee BL. Daidzin and daidzein suppress free-choice ethanol intake by
Syrian Golden hamsters. Proc Natl Acad Sci USA 1993; 90:10008–10012.
4.Dweck AC. The Pueraria family with special interest in Pueraria mirifica. Pers Care Mag
2003; 4(1):7–8.
5.Wren RC. Rewritten by EM Williamson and FJ Evans: Potter’s New Cyclopaedia of
Botanical Drugs and Preparations, C.W. Daniels, 1994.
6.Evans WC. Trease and Evans Textbook of Pharmacognosy. 13th ed. Balliere Tindall, 1989.
7.Leung AY. Encyclopedia of Common Natural Ingredients Used in Food, Drugs and
Cosmetics. 1st ed. John Wiley, 1980.
8.Mills SY. The A-Z of modern herbalism. A Comprehensive Guide to Practical Herbal Therapy. Thorsons, 1989 (retitled).
9.Council of Europe. Plant Preparations used as Ingredients of Cosmetic Products. 1st ed.
Strasbourg: HMSO, 1989.
10.Plesca-Manea L, Parvu AE, Parvu M, et al. Effects of Melilotus officinalis on acute inflammation. Phytother Res 2002; 16(4):316–319.
11.Watson C. Love Potions A guide to aphrodisiacs. Optima Books, 1993.
12.Lust J. The Herb Book The Most Complete Herb Book Ever Published. 1st ed. Benedict Lust Publications, 1974.
13.Grieve M. A Modern Herbal The Medicinal, Culinary, Cosmetic and Economic Prop erties, Cultivation and Folklore of Herbs, Grasses, Fungi, Shrubs and Trees With All Their Modern Scientific Uses. London, U.K.: Tiger Books International, 1998.
14.The British Herbal Pharmacopoeia. British Herbal Manufacturers Association (B.H.M.A), 1983.
15.Hoffmann D. The New Holistic Herbal. Element. 2nd impression, 1991.
16.Newall CA, Anderson LA, Phillipson, JD. Herbal Medicines A Guide for Health-Care
Professionals. London, U.K.: The Pharmaceutical Press, 1996.
17.Brown DJ. Herbal Research review: Vitex agnus castusclinical monograph. Q Rev Nat Med, Summer 1994.
18.Phytochemical and Ethnobotanical Databases (www.ars-grin.gov/duke/.)
19.Dweck AC. The wild yam a review. Pers Care Mag 2002; 3(3):7–9.
20.Fluck H. Medicinal Plants. W. Foulsham & Co. Ltd., 1988.
21.Boulos L. Medicinal Plants of North Africa. Algonac, Mich: Reference Publications, 1983.
22.Iwu MM. Handbook of African Medicinal Plants. CRC Press, 1993.
23.Leung AY, Foster S. Encyclopedia of Common Natural Ingredients Used in Food, Drugs and Cosmetics. 2nd ed. John Wiley, 1996.
24.Bunney S. The Illustrated Book of Herbs. Octopus, 1984.
25.Burkill HM. The Useful Plants of West Topical Africa. 2nd ed, Vol. 3. Families J-L. Royal Botanic Gardens Kew, 1985.
26.Weiss RF. Herbal Medicine (Translated from the 6th. German edition of Lehrbuch der Phytotherapie by A.R. Meuss). The Bath Press, 1986.
27.Schubert SY, Lansky EP, Neeman I. Antioxidant and eicosanoid enzyme inhibition properties of pomegranate seed oil and fermented juice flavonoids. J Ethnopharmacol 1999; 66(1):11–17.
28.Lust J. The Herb Book. 16th impression. Bantam Publishing, 1986.
29.Stuart M. Illustrated Guide to Herbs. CPG (Cambridge Physic Garden) Edgerton International Ltd., 1994.
30.Dal Farra C. Date palm kernel extract exhibits anti-aging properties and significantly reduces skin wrinkles. Proceeding of the Active Ingredients Conference, Paris, June 17–19, 2003.
31.Morton, J. Date. p. 5–11. In: Fruits of Warm Climates. Miami, Fla: Julia F. Morton, 1987:
5–11 (www.hort.purdue.edu/newcrop/morton/Date.html.).
32.Duke JA. 1983. Handbook of Energy Crops (www.hort.purdue.edu/newcrop/duke_energy/ Phoenix_dactylifera.html.)
33.Keville K. The Illustrated Herb Encyclopaedia A Complete Culinary, Cosmetic, Medicinal and Ornamental Guide to Herbs. Grange Books, 1991.

Natural Ingredients Used in Cosmeceuticals |
323 |
34.Okano Y, Rin K, Okamoto N, et al. Hop extract as a new potent ingredient for hair growth.
Preprint, Vol. 3. 18th International IFSCC Congress, Venice, 1994.
35.Seaforth CE. Natural Products in Caribbean Folk Medicine. University of the West
Indies, 1988.
36.Carrington S. Wild Plants of the Eastern Caribbean. London, U.K.: Macmillan Education,
1998.
37.Honychurch PN. Caribbean Wild Plants and Their Uses. Macmillan, 1994.
38.Bep O. Medicinal Plants in Nigeria. Published as a private edition 1960 by the Nigerian College of Arts, Science and Technology.
39.Lewis WH, Elvin-Lewis MPF. Medical Botany Plants Affecting Man's Health. John Wiley & Sons, 1977.
40.World Health Organisation: WHO Monograph on Selected Medicinal Plants, Vol. 1. Geneva, Switzerland: World Health Organisation, 1999.
41.Schauenberg P, Paris F. Guide to Medicinal Plants. Lutterworth Press, 1990.
42.Tang S, Palmer M. Chinese Herbal Prescriptions A Practical and Authoritative Self-
Help Guide. Rider & Company, an imprint of Century Hutchinson Ltd., 1986.
43.Gordon L. A Country Herbal. Webb and Bower Ltd., 1980.
44.Sela MN, Steinberg D. Glycyrrhizin: the basic facts plus medical and dental benefits. In: Grenby TH, ed. Progress in Sweeteners. London, U.K.: Elsevier, 1989, 7:1–96.
45.Back P. The Illustrated Herbal. Hamlyn Publishers, 1987.
46.Bradley PR. British Herbal Compendium. Vol. 1. 1992.
47.Spoerke DG. Herbal Medications. Santa Barbara: Woodbridge Press, 1990.
48.Swaim SF. Riddell KP, McGuire JA. Effects of topical medications on the healing of open pad wounds in dogs. J Am Anim Hosp Assoc 1992; 28(6):499–502.
49.Davis RH, Donato JJ, Hartman GM, Haas RC. Anti-inflammatory and wound healing activity of a growth substance in Aloe vera. J Am Podiatr Med Assoc 1994; 84(2):77–81.
50.Fulton JE. The stimulation of postdermabrasion wound healing with stabilized aloe vera gel-polyethylene oxide dressing. J Dermatol Surg Oncol 1990; 16(5):460–467.
51.Davis RH, Leitner MG, Russo JM, Byrne ME. Wound healing. Oral and topical activity of
Aloe vera. J Am Podiatr Med Assoc 1989; 79(11):559–562.
52.Watcher MA, Wheeland RG. The role of topical agents in the healing of full thickness wounds. J Dermatol Surg Oncol 1989; 15(11):1188–1195.
53.Davis RH, DiDonato JJ, Johnson RW, Stewart CB. Aloe vera, hydrocortisone, and sterol influence on wound tensile strength and anti inflammation. J Am Podiatr Med Assoc 1994; 84(12):614–621.
54.Davis RH, Kabbani JM, Maro NP. Aloe vera and wound healing. J Am Podiatr Med Assoc
1987; 77(4):165–169.
55.Zawahry ME, Hegazy MR, Helal M. Use of aloe in treating leg ulcers and dermatoses.
Int J Dermatol 1973; 12(1):68–73.
56.Kligmann AM. Wound healing assay. Test report 3791 Ivy Research Laboratories Inc., 1979.
57.Reynolds T, Dweck AC. Aloe vera leaf gel a review update. J Ethnopharmacol 1999;
68:3–37.
58.Strickland FM, Pelley RP, Kripke ML. Prevention of ultraviolet radiation-induced suppression of contact and delayed hypersensitivity by Aloe barbadensis gel extract.
J Invest Dermatol 1994; 102(2):197–204
59.Sato Y, Ohta S, Shinoda M. Studies on chemical protectors against radiation: XXXI. Protection effects of Aloe arborescens on skin injury induced by X-irradiation. J Pharm Soc
Japan 1990; 110(11):876–884.
60.Iena IM. [The therapeutic properties of aloe]. Vrach-Delo 1993; (2–3):142–145.
61.Lushbaugh CC, Hale DB. Experimental acute radiodermatitis following beta irradiation.
Cancer 1958; 6:690–698.
62.Swoboda M, Meurer J. The treatment of atopic dermatitis with an ointment containing
Hamamelis virginiana extract: a double-blind study. Br J Phytother 1992; 2(3).
63.Buchman DD. Herbal Medicine: The Natural Way to Get Well and Stay Well. Century
Hutchinson, 1987.


20Influence of Formulation Design on the Clinical Performance of Topically Applied Formulations
Johann W. Wiechers
JW Solutions, Gouda, Netherlands
SUMMARY
Although enormous amounts of time and money are spent on identifying the right drug or active ingredient to overcome skin ailments, relatively little effort is given to the design of the topical formulation in which that drug or active ingredient is ultimately applied on the skin. As a consequence, some or, in the worst case, all of the intrinsic activity of the active ingredient may be lost. Of course, this is not deliberate, but topical product developers are also people with certain habits, and it is only logical to use the same formulation base that was previously successful for that new drug, active ingredient, or cosmeceutical.
This chapter proposes a rather radical approach, called “formulating for effi- cacy,” which is based on the optimization of two opposing effects: (1) to increase the absolute solubility of the drug or active ingredient in the formulation to ensure that there is sufficient material that can reach minimal effective concentrations (MECs) at the target site in the skin; (2) to reduce the relative solubility of the drug or active ingredient in the formulation to ensure an optimal driving force away from the for- mulation and into the skin. Examples will be shown illustrating that this approach leads to significantly higher skin penetration that subsequently results in signifi- cantly better clinical efficacy.
In addition, it will be shown that the application of this concept can also help to lower the dose of active ingredients without a loss of clinical efficacy, making the benefits of formulating for efficacy very visible: (1) to create an efficacious product;
(2) to enhance the efficacy of an already efficacious formulation; (3) to reduce the amount of active ingredient used in a cosmeceutical product without the loss of clinical efficacy.
INTRODUCTION
The first half of the 1990s was characterized by the advent of active ingredients. Every cosmetic product needed to contain a chemical entity with some biological activity to allow it to be successful in the market place. In vitro evidence for this biological activity was often sufficient to convince both the cosmetic product for- mulator as well as the consumer that there were clear benefits to be obtained from using this product. Cosmetic advertisements such as “Product X contains ingredient Y that is known to do Z” were both common and attractive. So-called cosmetic ingredient claims emerged on every product label and in advertisements in glossy magazines.
But time changes everything and consumers of cosmetic products started to realize that the antiaging creams that they bought did not necessarily prevent wrinkles
325
326 |
Wiechers |
forming. The efficacy of these cosmeceutical products was simply not enough. Cos- metic marketers became unhappy and started asking for more efficacious products while at the same time, regulators of cosmetic products started to ask for clinical evidence for the claims that were made. Cosmetic claim substantiation became a cosmetic discipline. Customers of cosmetic products wanted to see a real consumerperceivable benefit, cosmetic marketers wanted to deliver this benefit, and cosmetic regulators wanted to see the evidence. In the meantime, cosmetic formulators were the ones who had to deliver the clinical effect via the delivery of the active ingre- dient to the site of action in the skin at sufficiently high concentrations for a suf- ficiently long period of time. They tried new active ingredients with promising intrinsic activity profiles but were often not able to create efficacious products when using their standard cosmetic formulations. Suppliers of the new active ingredients were blamed. Some suppliers were smart and realized that the lack of skin delivery was the root cause of this and started to provide cosmetic delivery systems to the cosmetic industry: liposomes, nanosomes, microcapsules, and the like emerged into the market, and these were popular for some time and continue to be so in selected applications where they have demonstrated their benefit. But skin delivery sys- tems cannot be used generically. Something that is good for one active ingredient, drug, or cosmeceutical, is not necessarily good for another. Moreover, not everyone wanted to include costly gadgets into their topical preparations that would hopefully give them enhanced delivery. There was need for a more generic approach that would work with every active ingredient, under every condition (concentration) at no extra cost.
In 2003, I presented, together with my colleagues, a paper at the International Federation of Societies of Cosmetic Chemists Conference in Seoul, South Korea, that went a long way in providing exactly that. It was not set up to meet this objective, but started as a means to explain some seemingly contradictory requirements for skin delivery to my colleagues. When I was finally able to explain this to my col- leagues, the formulating for efficacy concept was born. Although very simple in principle, its consequences are far-reaching from both a marketing perspective as well as a consumer perspective. The use of this concept allows the formulator to cre- ate a more efficacious product at lower concentrations of active ingredient, a target that would delight people both within as well as outside the cosmetic or pharmaceutical industry.
In this chapter, I will first discuss the various factors influencing skin delivery from topical formulations, such as formulation type, structure, and composition.
I will explain the theoretical background of the formulating for efficacy concept, show how this has been used to enhance the skin penetration of active ingredients into the skin, and show clinical results from formulations that were and that were not optimized via this concept. This will be followed by new clinical results indi- cating that the dose of active ingredient can be lowered without a loss of efficacy.
The chapter will end with some further perspectives of possible improvements that could be made to the formulating for efficacy concept.
FACTORS INFLUENCING SKIN DELIVERY FROM TOPICAL FORMULATIONS
Various factors influence skin penetration. In short, they are the condition of the skin (whether it is healthy or diseased), the physicochemical properties of the pen- etrating molecule, the formulation in which the penetrating molecule is applied, and finally, the dosing conditions (1). The condition of skin, which includes such

Influence of Formulation Design on Clinical Performance |
327 |
aspects as skin lipid structure and organization, and how this may be influenced by various disease states, is discussed elsewhere in this book. It has been shown in patients suffering from atopic dermatitis, for instance, that the barrier function of the skin is reduced because of changes in the packing rigidity of skin lipids (2). The physicochemical properties that favor skin penetration in short are the following:
(1) a 10log octanol/water partition coefficient of 1 to 2, that is, the molecule should be 10to 100-fold more soluble in octanol than in water; (2) a low molecular weight (ideally, lower than 500, but when higher, generally the lower the better); (3) un- charged over the physiological pH range encountered during skin penetration; (4) a high dipole moment (1). A molecule such as dimethyl sulfoxide fulfills all these re- quirements and it penetrates human skin within seconds. The influence of formula- tion design on skin penetration is the subject of this chapter. The dosing conditions are generally of relatively minor importance, although in individual cases, they may have a big impact. This encompasses issues such as application under occlusion, which was shown to be very relevant for the topical application of corticosteroids, the number of daily applications, and the skin temperature. In the following, it is assumed that a formulation is applied onto healthy skin and contains a drug, an active ingredient, or a cosmeceutical, which has the right chemical characteristics to penetrate the skin.
Formulation Type
There are three fundamental levels on which a formulation can influence topical delivery. On the first level, there is the influence of formulation type, that is, whether the drug or active ingredient is dosed in a gel, an oil-in-water (O/W) emulsion or a water-in-oil (W/O) emulsion, a microemulsion, or an oil. In a systematic study, four model drugs of differing polarities (the polar 5-fluorouracil, the intermediate polarity hydrocortisone, the lipophilic testosterone, and the very lipophilic keto- conazole) were dosed at 1% w/w from the five formulation types mentioned earlier.
Both transdermal and dermal delivery were measured and results are discussed accordingly.
For transdermal delivery, the microemulsions were almost always superior to the other formulations tested (Fig. 1). In the table attached to Figure 1, a score of 1 means that that particular formulation type delivered the greatest amount of drug and a score of 5 means that it delivered the least amount. Please note that this is not an equidistant scale; 2 and 3 may be close together, whereas 1 and 2 may be numeri- cally far apart. The graph in Figure 1 clearly indicates that 5-fluorouracil penetration from a microemulsion is significantly higher than from any of the other formulation types tested. It must be said that considerably higher levels of surfactants were used to create this microemulsion and the microemulsions containing the other polarity drugs. It is therefore assumed that the higher transdermal penetration can be explained from the high levels of surfactant in the formulation because these are known to act as skin penetration enhancers. Transdermal delivery from these mi- croemulsions was consistently high but the dermal delivery was variable (results not shown).
Although this was not very surprising, the next finding was. When compar- ing the transdermal delivery from O/W and W/O emulsions, it was noted that this was always roughly the same with average scores ranging from 2 to 4. This suggested that transdermal delivery from an O/W emulsion is roughly the same as that from a W/O emulsion. However, when comparing the dermal delivery,

328 |
Wiechers |
% penetrated ± SE
14 |
5-FU gel |
|
|
12 |
5-FU w/o emulsion |
5-FU o/w emulsion |
|
10 |
5-FU microemulsion |
5-FU oil |
8
6
4
2 |
|
|
|
|
0 0 |
12 |
24 |
36 |
48 |
|
|
Time (hours) |
|
|
|
hydrophilic |
medium |
lipophilic |
very |
|
5-fluoro- |
polarity |
testos- |
lipophilic |
|
hydro- |
keto- |
||
Formulation |
uracil |
cortisone |
terone |
conazole |
|
|
|
|
|
gel |
5 |
3 |
5 |
5 |
|
|
|
|
|
w/o |
3 |
4 |
2 |
4 |
|
|
|
|
|
o/w |
3 |
5 |
3 |
2 |
|
|
|
|
|
micro |
1 |
1 |
1 |
3 |
|
|
|
|
|
oil |
2 |
2 |
4 |
1 |
|
|
|
|
|
Figure 1 Transdermal delivery of 5-fluorouracil, a model polar penetrant, from five different formulation types: gel, W/O emulsion, O/W emulsion, microemulsion, and oil. Penetration after 48 hours was ranked from 1 (highest) to 5 (lowest). When results were statistically insignificant, the same higher score (higher number) was given. The table on the right gives the transdermal skin penetration results of all four model penetrants from all five formulations. Note that the microemulsions delivered in three out of four cases the highest amount, most likely due to the high levels of surfactants used to create these microemulsions. Abbreviations: W/O, water-in-oil; O/W, oil-in-water.
a completely different picture was obtained. Here, we saw that dermal delivery from W/O emulsions was poor for the lipophilic model penetrants, whereas the dermal delivery from O/W emulsions was poor for the more hydrophilic penetrants! This was remarkable because generally accepted knowledge dictates that delivery is better from the external phase because the drug has immediate access to the skin.
Therefore, if this generally accepted wisdom is indeed correct, the delivery of the lipophilic model penetrants ketoconazole and testosterone should have been higher from W/O emulsions, but there is no evidence for this in the transdermal results.
In the dermal results, it is exactly the opposite. Also, dermal delivery of the hydro- philic 5-fluorouracil and intermediate polarity hydrocortisone is higher when it is incorporated in the internal phase, that is, in a W/O emulsion. An easy explanation for this would be that the internal phase has a smaller volume than the external phase. At constant loading levels of 1%, the local concentration in the internal phase would therefore be higher, hence the thermodynamic activity would be higher, but that is incorrect because all formulations (apart from ketoconazole in oil) were for- mulated at maximum thermodynamic activity! This is shown in Figure 2, where the transdermal delivery differences ranked as in Figure 1 are shown on the left and dermal delivery differences on the right.
Although this study yielded some very interesting observations, care should be taken not to extrapolate these findings to general guidelines. The chemicals used to make these formulations were the same within the same formulation (i.e., all gels had the same composition apart from the drug), but there were differences between the chemicals used for the different formulation types. This study did con- firm, however, that the most prominent characteristic determining skin penetration is the physicochemical nature of the penetrating molecule. In other words, when dealing with a molecule that does not have the intrinsic capability to penetrate the skin (because it is too big, of the wrong polarity, or ionized), then clever topical formulation design is not going to make it happen. Other means of skin penetration enhancement such as iontophoresis or encapsulation might still work. But for the

Influence of Formulation Design on Clinical Performance |
329 |
|
|
hydrophilic |
|
medium |
lipophilic |
very |
|
|
hydrophilic |
|
lipophilic |
||
|
|
5-fluoro- |
|
polarity |
testos- |
lipophilic |
|
|
|
hydro- |
keto- |
||
|
|
5-fluoro- |
|
hydro- |
testos- |
keto- |
|
Formulation |
uracil |
|
cortisone |
terone |
conazole |
|
uracil |
|
cortisone |
terone |
conazole |
|
|
gel |
5 |
|
3 |
5 |
5 |
|
w/o |
3 |
|
4 |
2 |
4 |
|
o/w |
|
|
5 |
3 |
2 |
|
3 |
|
||||
|
|
|||||
|
|
|
|
|
|
|
|
micro |
1 |
|
1 |
1 |
3 |
|
|
|
|
|
|
|
|
oil |
2 |
|
2 |
4 |
1 |
|
|
|
|
|
|
|
|
c |
medium |
lipophilic |
very |
|
hydrophilic |
polarity |
lipophilic |
|
|
5-fluoro- |
testos- |
||
|
hydro- |
keto- |
||
Formulation |
5-fluoro- |
hydro- |
testos- |
keto- |
uracil |
cortisone |
terone |
conazole |
|
Formulation |
uracil |
cortisone |
terone |
conazole |
gel |
3 |
2 |
3 |
3 |
w/o |
2 |
1 |
5 |
5 |
o/w |
5 |
5 |
1 |
3 |
|
|
|
|
|
micro |
4 |
4 |
2 |
1 |
|
|
|
|
|
oil |
1 |
3 |
3 |
1 |
|
|
|
|
|
Figure 2 Comparison of the transdermal (left ) and dermal delivery (right ) of four model penetrants from five different formulations, with particular emphasis on the W/O and O/W emulsions. Although transdermal delivery is on average the same for the various penetrants from O/W and W/O emulsions, their dermal delivery is distinctly different, favoring the penetration from the actives that are present in the internal phase.
classical topical formulations, it can be concluded that when the physical chemistry is not right, the drug or active ingredient will not penetrate skin.
Formulation Structure
A second level of influence is the physical formulation structure and in particular the influence of droplet size on skin penetration. Here, again, some rather interest- ing observations were made, which are contradictory to what most cosmetic and pharmaceutical formulators believe to be true. In a series of skin penetration ex- periments using tetracaine as the model penetrant in a series of formulations, all containing exactly the same ingredients but processed in different ways to give a range of different droplet sizes, no influence of droplet size on either transdermal or dermal delivery could be seen. In a first “Total Surfactant” experiment, the overall level of surfactant in the formulation was kept constant. Smaller droplets, however, need more surfactant to stabilize the emulsion because of the larger total interfacial surface of the smaller droplets. As a consequence, less free surfactant was present in the formulations with smaller droplet sizes, and one could explain that the observed lack of influence of droplet size was the net result of two opposing effects. If, on the one hand, skin penetration was enhanced from the smaller droplet size emulsions, but, on the other hand, also enhanced at higher free surfactant concentrations (pres- ent in larger droplet size emulsions), then the net result of droplet size could be zero. We therefore repeated the experiment, adapting the amount of surfactant used to the droplet surface area keeping the concentration of free surfactant constant, the
“Free Surfactant” experiment. Again, no influence of droplet size on transdermal and dermal delivery of tetracaine was noted. Although this initially surprised us, because we were expecting an increased penetration with reducing droplet size, our finding can in hindsight be easily rationalized from the fact that in skin pen- etration, each molecule is assumed to penetrate individually and in accordance with its physicochemical characteristics as expressed in the Potts-Guy equation (3). Therefore, it should not make any difference whether an active ingredient, drug, or cosmeceutical is incorporated in a small or large droplet; the skin delivery should be the same. The reason why it is generally assumed that smaller droplet size emul- sions enhance skin penetration is most likely because a large excess of surfactant is used to create the smaller droplet size emulsions (similar to the microemulsions in

330 |
Wiechers |
the formulation type study described earlier). This droplet size study was the first systematic investigation that used exactly the same formulation components and only differed in the way the formulations were manufactured (4).
Results from the Total Surfactant and the Free Surfactant experiments are shown in Figure 3. Dermal delivery, expressed as microgram of tetracaine per mil- ligram of skin, is plotted on the left-hand Y axis (open symbols), whereas transder- mal delivery, expressed as the percentage of the dose that penetrated skin within 24 hours, is plotted on the right-hand Y axis (closed symbols). Droplet size is plot- ted logarithmically on the X axis. Although the lines are not perfectly straight, the observed differences are far from statistically significant and it can therefore be con- cluded that there is no influence of emulsion droplet size on both transdermal and dermal delivery.
Again, as described earlier for the influence of formulation type on skin pen- etration, care should be taken not to generalize this finding. After all, we evaluated only one active ingredient (tetracaine) and one surfactant system (C12–15 Pareth-7, commercial name Synperonic A7). However, feedback has been received from other cosmetic scientists who claim to have found the same results using another emollient as the active ingredient and another surfactant system, but they never pub- lished their findings because they go very much against normally accepted rules.
|
0.30 |
|
|
70 |
Tetracaine |
aAt. Atconstanttotaltotal |
|
|
|
|
|
|
60 |
|
|||
|
0.25 |
|
|
permeated |
|
|||
|
|
|
surfactantconcentrationn |
|
||||
|
|
|
|
|
||||
|
|
|
|
50 |
|
|||
g/mg) |
0.20 |
|
|
|
|
|
||
|
|
|
|
|
|
|||
0.15 |
|
|
40 |
|
|
|
||
|
|
|
|
|
|
|||
(µ |
|
|
30 |
(%) |
|
|
|
|
|
|
0.30 |
|
70 |
|
|||
ret |
|
|
|
|
||||
0.10 |
|
|
|
|
||||
Q |
|
|
20 |
|
|
|
Tetracaine |
|
|
|
|
|
|
60 |
|||
0.05 |
|
0.25 |
|
|
|
|||
|
|
|
|
|
||||
|
|
10 |
|
|
50 |
|||
|
|
0.20 |
|
|
|
|||
0.00 |
|
0 |
|
|
|
|||
|
|
|
|
40 |
||||
100 |
1000 |
0.15 |
|
|
|
|||
r (nm) |
(µg/mg) |
|
|
|
30 |
|||
|
|
|
|
|||||
|
|
|
|
|
||||
|
0.10 |
|
|
|
|
|||
|
|
ret |
|
|
|
20 |
permeated |
|
|
|
|
|
|
|
|||
|
bAt. Atconstantfreefree |
Q |
0.05 |
|
|
|
10 |
|
|
|
|
|
|
(%) |
|||
|
surfactant concentration |
|
|
|
|
|||
|
|
|
|
|
|
|||
|
0.00 |
|
|
|
0 |
|
||
|
|
|
|
100 |
|
|||
|
|
|
|
|
1000 |
|
||
r (nm)
Figure 3 Dermal (open squares) and transdermal (filled in circles) delivery of tetracaine from macroemulsion and nanoemulsion either at a constant total free surfactant concentration or a constant free surfactant concentration. Both experiments show that there is no influence of droplet size on either dermal or transdermal delivery because observed differences are not statistically significant (P > 0.05). These findings contradict the general belief that skin penetration from smaller droplet sizes is enhanced, a finding that is based on studies in which the formulations vary not only in droplet size but also in surfactant concentrations required to stabilize emulsions with smaller droplet sizes, which is probably the reason for this enhancement. The formulations used in this study only differed in the way they were mechanically processed and not in chemical composition.

Influence of Formulation Design on Clinical Performance |
331 |
The conclusion of all these studies is that there is some influence of formula- tion type but not of formulation structure on dermal and transdermal delivery. Most of the claimed differences of droplet size seem to be due to the presence of (excess) surfactant in the formulation, that is, the composition of the formulation seems to be influencing skin delivery of a given active ingredient more than anything else.
As a consequence, formulation design could very well become a trial-and-error pro- cess before one will find the best composition to optimize the skin delivery of a particular active. Therefore, a more systematic approach, based on understanding rather than on a trial-and-error method, is needed. Formulating for efficacy is such a systematic approach that was developed on a fundamental understanding of skin delivery processes. In the following, the theoretical background of formulating for efficacy will be explained as well as the use of this concept in formulation design. Clinical results will be shown for formulations that were and were not optimized by this concept to show the validity of this concept.
THEORETICAL BACKGROUND OF FORMULATING FOR EFFICACY
Both dermal and transdermal delivery aim to achieve one goal summarized in the four R’s of delivery: to deliver the right chemical at the right concentration to the right site in (dermal delivery) or beyond (transdermal delivery) the skin for the cor- rect period of time. If one of these four R’s is not achieved, there is no delivery and as a result no clinical efficacy can be obtained. The active ingredient or drug needs to be stable in the formulation as well as during its passage through the stratum corneum and viable epidermis and dermis, although in certain cases, prodrugs that penetrate the skin better and rely on skin metabolism to transform the prodrug to the parent drug that subsequently has the right intrinsic activity, are used. The right site is often achieved in topical delivery by applying the drug to the relevant surface area of the body but this site definition goes much further. One may want to target a specific cell type within the viable epidermis and the common way to achieve this is to sim- ply dose enough on the skin surface in an attempt to deliver sufficient quantities of active ingredient to the site of action. The correct length of time is seldom an issue in topical delivery; topical formulations are applied indefinitely and the only issue could be a too-short application time because of accidental removal of the formulation by the mechanical movement of clothes or our body movements. This leaves only the right concentration. Efficacy is only obtained if we deliver more than the MEC and less than the toxic concentration, two concentrations that can be obtained from in vitro experiments using the drug, cosmeceutical, or active ingredient.
Two separate issues need to be ensured if you want to deliver enough material to reach levels beyond the MEC. On the one hand, one needs to ensure that there is enough active ingredient in the formulation that the MEC can be reached. This requires a high absolute solubility of the cosmeceutical in the formulation. This can be achieved by matching the polarity of the formulation to the polarity of the drug or active ingredient. If the two are similar, the solubility of the active ingredient in the formulation will be high but its driving force for delivery will be low. One therefore also needs to optimize the driving force to ensure that the cosmeceutical will leave the formulation and penetrate into the skin in order to reach its site of action. For this, it needs to have a low solubility in the formulation relative to its solubility in the stratum corneum. The two requirements seem contradictory, but what one is really looking for is for the active ingredient to be very soluble in the formulation but even more soluble in the stratum corneum. Our work revealed that it is possible

332 |
Wiechers |
to calculate the optimal polarity of the phase in which the active ingredient is incor- porated that will give you the maximally achievable skin delivery possible for that specific molecule (5). The formula for the polarity of the formulation from which you will achieve 50% skin penetration is:
polarity of formulation = polarity of penetrant ± penetrant polarity gap
The penetrant polarity gap is the polarity difference between the active ingredient and the stratum corneum. Polarity of penetrants, stratum corneum, and formula- tions can be calculated via polarity index (PI) values, which are a mixture of many different molecular physicochemical characteristics that influence solubility and skin penetration. The polarity of the stratum corneum was assumed to be slightly more polar than n-butanol based on literature reports (6). In formulating for efficacy terminology, the relative polarity index (RPI) is the difference between the PI values of active ingredient and the formulation component under study, whereas the pen- etrant polarity gap is the difference between the PI values of active ingredient and the stratum corneum (5). The optimal polarity of a formulation can now be realized by mixing a primary emollient with a low RPI (hence a high solubility of the active ingredient in that emollient) with a secondary emollient with a high RPI (hence a low solubility of the active ingredient in that emollient but therefore with high driving force to leave the emollient) in the right proportions to achieve the best of both worlds, that is, a high solubility and a high driving force. This is schematically illustrated in Figure 4.
Experimentally, one uses a primary emollient with a small RPI (i.e., with a polarity that is very similar to the active ingredient that one wants to formulate) to dissolve the desired amount of active ingredient (green arrow in Fig. 4) and then adds a secondary emollient with a large RPI (i.e., with a polarity that is very differ- ent from the active ingredient that one wants to formulate) to maximize the driving force for diffusion (red arrow). The resulting mixture, indicated by the blue arrow, has the optimal polarity to ensure a maximum driving force for the amount of active ingredient incorporated into the formulation.
Optimal polarities of formulation |
|
solubility |
driving force |
penetrant |
penetrant |
more |
- PPG polarity + PPG |
more |
hydrophilic |
penetrant |
lipophilic |
Figure 4 A schematic overview of formulating for efficacy. The active ingredient is dissolved in the primary emollient with a low relative polarity index (RPI) in which it is very soluble (light grey arrow). Subsequently, a secondary emollient with a high RPI ensuring a high driving force for diffusion (medium grey arrow) is added. The proportions of primary and secondary emollient relative to the concentration of the active ingredient will ensure that the optimal polarity for the formulation is achieved (dark grey arrow) where skin delivery is maximal.

Influence of Formulation Design on Clinical Performance |
333 |
SKIN DELIVERY AND CLINICAL EVIDENCE VALIDATING THE FORMULATING FOR EFFICACY CONCEPT
We have used the formulating for efficacy concept to make skin delivery–optimized formulations containing octadecenedioic acid, a novel skin whitener. Formulation
A was made without using the Formulation for Efficacy concept and contained 2% active ingredient. Formulation B was made using the formulating for efficacy concept and also contained 2% octadecenedioic acid. The exact composition of the formulations is provided in Table 1. The only difference between the formulations is the choice of the emollients. Propylene glycol isostearate is used as the primary emollient in formulation B, whereas triethylhexanoin was used as the secondary emollient. Skin delivery experiments using the two formulations on full-thickness pig skin were performed and showed a statistically significant, 3.5-fold increase in dermal delivery (Fig. 5) (5).
The delivery result (Fig. 5) illustrates that the formulating for efficacy concept delivers significantly more octadecenedioic acid into the skin. The fact that this in- crease was 3.5-fold is accidental because this depends on the extent of skin delivery from the formulation that was not optimized for skin delivery. Therefore, it cannot in general be stated by what factor skin delivery will increase using the formulating for efficacy concept. But both formulations contained 2% active, yet the delivery was much more effective from the second optimized formulation.
This enhanced skin delivery suggests that the clinical efficacy should also increase. Octadecenedioic acid is a new skin-whitening molecule that interacts with the γ isoform of the peroxisome proliferator–activated receptor, PPARγ. This interaction results in reduced tyrosinase mRNA production, which subsequently results in reduced tyrosinase production (7). As tyrosinase is the rate-limiting enzyme in skin melanogenesis, its reduced production means that skin should become whiter. Clinical studies in which skin color was measured using a chro- mameter were carried out. In both studies, 20 subjects applied either formulation
A or B for a period of eight weeks twice a day. The chromameter measures the L, a, and b values that characterize the color of any object. The L scale is the luminosity
TABLE 1 Composition of the Nonoptimized (A) and Two Skin Delivery Optimized Formulations (B and C)
|
|
Concentration (% w/w) |
||
|
|
|
|
|
INCI name |
Function |
Formulation A |
Formulation B |
Formulation C |
|
|
|
|
|
Octadecenedioic acid |
Active ingredient |
2.0 |
2.0 |
1.0 |
Propylene glycol isostearate |
Primary emollient |
– |
15.0 |
7.5 |
Triethylhexanoin |
Secondary |
– |
3.0 |
1.5 |
|
emollient |
|
|
|
Caprylic/capric Triglyceride |
Emollient |
10.0 |
– |
– |
Cetyl alcohol |
Emollient |
2.0 |
– |
– |
Glyceryl stearate SE |
Self-emulsifying |
2.0 |
– |
– |
|
emollient |
|
|
|
Steareth-21 |
Emulsifier |
5.0 |
5.0 |
5.0 |
Steareth-2 |
Coemulsifier |
1.0 |
1.0 |
1.0 |
Glycerin |
Moisturizer |
4.0 |
4.0 |
4.0 |
Xanthan gum |
Thickener |
– |
0.2 |
0.2 |
Preservative |
Preservative |
0.2 |
0.7 |
0.7 |
2-Amino-2-methyl-1-propanol |
pH modifier |
qs |
– |
– |
Water |
|
qs 100 |
qs 100 |
qs 100 |
|
|
|
|
|

334 |
Wiechers |
) |
15 |
|
(µg/cm2 |
10 |
|
Delivery |
||
Tapes |
||
|
||
|
Skin |
|
Dioic Acid |
Transdermal |
|
5 |
||
0 |
||
|
Formulation A not |
Delivery optimized |
optimized for delivery |
formulation B |
Figure 5 Skin delivery of octadecenedioic acid from formulations not optimized
(A) and optimized (B) for skin delivery (for composition, see also Table 1). Note that the latter delivers significantly more dioic acid to the skin.
scale and its extreme colors are black and white; the L value represents the color difference on the L scale relative to the start of the study. The results of these two studies are compared in Figure 6.
The skin delivery–optimized formulation B showed not only an increased skin delivery but also an increased skin efficacy. Theoretically, there should be a direct correlation between skin delivery and clinical efficacy, and this was confirmed in the enhancement factors, 3.5-fold for skin delivery and 3.2-fold for clinical efficacy.
However, there is more that the formulating for efficacy concept can achieve.
In a delivery-optimized formulation, it is the ratio between the primary emollient, the secondary emollient, and the drug, active ingredient, or cosmeceutical that op- timizes the flux of the penetrant relative to its concentration. What will happen to the skin delivery of the active ingredient if the percentage of the oil phase is reduced and in doing so the amount of a lipophilic active in the formulation is also reduced? Because the ratio between the three constituents of the oil phase is not changed by this reduction, delivery expressed as μg/cm2/hr should remain the same, although delivery expressed as a percentage would increase.
To prove this point, a third formulation was prepared, formulation C, in which the oil phase was halved relative to formulation B (see Table 1 for composition), and this formulation was also clinically tested for its skin whitening efficacy. The clinical results of formulations A, B, and C are shown in Figure 7. Relative to formulation A (which contained 2% octadecenedioic acid and was not optimized for skin deliv- ery), the clinical effect of formulation C (which contained 1% octadecenedioic acid but was optimized for skin delivery) was enhanced by a factor of 3.9. There was no statistically significant difference in clinical efficacy between formulations B and C,
wk 0 |
2.5 |
|
|
|
|
2 |
|
|
|
|
|
to |
|
|
|
|
|
|
|
|
|
|
|
relative |
1.5 |
|
|
|
|
1 |
|
|
|
|
|
L-value |
0.5 |
|
|
|
|
0 0 |
|
|
|
|
|
|
2 |
4 |
6 |
8 |
Time (weeks)
 Formulation A

 Formulation B
Figure 6 Clinical efficacy of two formulations both containing 2% octadecenedioic acid. Formulation A was not optimized for skin delivery, whereas formulation B was. The clinical efficacy of formulation B at week 8 is 3.2-fold enhanced relative to formulation A (P < 0.05).

Influence of Formulation Design on Clinical Performance |
335 |
wk 0 |
2.5 |
|
|
|
|
2 |
|
|
|
|
|
to |
|
|
|
|
|
|
|
|
|
|
|
relative |
1.5 |
|
|
|
|
1 |
|
|
|
|
|
L-value |
0.5 |
|
|
|
|
0 |
|
|
|
|
|
|
|
|
|
|
|
|
0 |
2 |
4 |
6 |
8 |
Time (weeks)
 Formulation A

 Formulation B
 Formulation C
Figure 7 Clinical efficacy of three formulations containing octadecenedioic acid, the same formulations A and B that were shown in Figure 6 containing 2% of the active ingredient but also formulation C containing 1% octadecenedioic acid and optimized for skin delivery. Relative to formulation A, the clinical efficacy of formulation C is enhanced by a factor of 3.9 (P < 0.002), whereas there is no statistically significant difference between formulations B and C as was expected on theoretical grounds. This graph shows that it is not the concentration of the active that determines the extent of clinical efficacy but the ratio between drug, primary emollient, and secondary emollient, which can be found via the formulating for efficacy concept.
whereas there was between formulations A and B (P < 0.05) and formulations A and C (P < 0.002). This proves that it is the ratio between drug, primary emollient, and secondary emollient that is of importance, and not the absolute concentration of the drug in a formulation, that determines the clinical efficacy. However, this does not mean that one can infinitely reduce the concentration of the cosmeceutical in the formulation because there will be point that there is simply not enough drug left in the vehicle to obtain the minimum effective concentration at the target site. Stud- ies in which the concentration is continuously reduced, that is, from 1.0% down to 0.05% octadecenedioic acid, are underway to determine the optimal concentration in the formulation. The optimal concentration (or OC100) in the formulation is de- fined here as the minimum concentration of the active ingredient at which maximal efficacy can be obtained and should not be confused with the minimum effective concentration (or MEC) at the target site.
The discussion above illustrates that formulating for efficacy has three poten- tial applications as shown in Figure 8. In a formulation that is not optimized for skin delivery, there is a constant increase in the amount delivered to the target site in the skin when the concentration of the active ingredient in the formulation is increased.
At the point of saturation of the active ingredient in the formulation, maximal ther- modynamic activity is reached and a further increase in the concentration of the active ingredient does not bring any additional cosmeceutical to the target site. If you have a situation where there is insufficient delivery to exceed the MEC, use of the formulating for efficacy concept may create an effective product because levels above the MEC are reached and clinical effect can be obtained. This is indicated as situation A in Figure 8. If you are already exceeding the MEC, your formulation, which is not optimized for delivery, will have a suboptimal efficacy. Use of the for- mulating for efficacy concept will maximize the clinical effect at the same level of ac- tive ingredient loading (situation B in Fig. 8). The comparison between formulations A and B in Figure 6 is an example of this situation in which we have enhanced or maximized clinical effect. Finally, you may already have obtained maximum clini- cal efficacy but at a high concentration of active ingredient. Situation C in Figure 8
336 |
|
|
Wiechers |
site |
|
|
|
target |
|
C |
A. Create efficacy |
|
|
||
at |
B |
|
B. Enhance efficacy |
delivered |
|
C. Reduce concentration |
|
|
|
||
|
|
|
|
Concentration |
A |
|
|
|
|
Minimum effective concentration |
|
|
|
|
|
|
|
Concentration in formulation |
|
=non skiin delivery--optimizedformulationn
=skin delivery--optimizedformulation
Figure 8 The three possible benefits of formulating for efficacy. When one does not have sufficient delivery to reach the minimum effective concentration, use of the formulating for efficacy concept can make your formulation clinically effective (situation A). When one has insufficient skin delivery to have maximal clinical efficacy, use of the formulating for efficacy concept can enhance the clinical efficacy of your formulation (situation B). Finally, when you have a formulation with maximal clinical efficacy, use of the formulating for efficacy concept will allow you to reduce the concentration of your active in your formulation without losing clinical efficacy (situation C). Mixed forms of benefit where you reduce the concentration yet achieve more clinical efficacy are also possible.
illustrates that you can reduce the concentration without losing clinical efficacy. This was shown in the comparison between formulations B and C in Figure 7.
CONCLUDING REMARKS
In order for cosmetic products to exert clinical efficacy, the active ingredient or cos- meceutical will need to penetrate the skin to reach the site of action at a sufficiently high concentration for a sufficiently long period of time. The most important de- terminant for skin penetration is the physicochemical nature of the molecule, in particular its octanol-water partition coefficient and molecular weight and volume.
If a molecule does not have the right physicochemical properties to penetrate, nothing can be done via formulation design to enable the chemical to penetrate the skin apart from special delivery systems such as transfersomes, etc.
Assuming the chemical of interest does have the right physicochemical properties, the formulation type in which the active ingredient is incorporated does have an influence on skin delivery, but the influence depends on the polarity of the cos- meceutical. Information as provided in Figure 2 may give some guidance towards the influence of formulation type although it should be realized that more than 20 formulations are needed to conclusively state the influence of formulation type on skin delivery.
Reducing the droplet size in emulsions is often claimed to enhance the skin delivery of cosmeceuticals but we were not able to confirm this when we kept the composition of the formulations exactly the same and only changed the way in which the emulsions were mechanically processed: neither dermal nor transdermal delivery showed a dependence on droplet size. Formulation composition, on the other hand, had a pronounced influence on skin delivery.

Influence of Formulation Design on Clinical Performance |
337 |
Our research indicated that the emollients determine how much active ingre- dient penetrates into the skin, whereas the emulsifiers determine where it penetrates into the skin. The formulating for efficacy concept allows calculation of the required polarity of the formulation that will maximize the skin delivery. This should not only result in more skin delivery but also in increased efficacy of the topically ap- plied formulation as was shown for formulations containing octadecenedioic acid.
In essence, use of formulating for efficacy should allow three different scenarios:
(1) to create a clinically effective formulation from a previously noneffective formu- lation at the same dosage of active ingredient; (2) to enhance the clinical efficacy of a suboptimal delivering formulation, again at the same dosage of active ingredient; and (3) to reduce the level of the active ingredient of an already optimized formula- tion without losing any clinical efficacy. Of course, mixed possibilities such as ob- taining greater efficacy at a lower dose level of active ingredient are also possible.
Cosmetic and pharmaceutical product developers should realize that topical formulation design is no longer a matter of trial and error but that it can be opti- mized by concepts such as formulating for efficacy. This, in turn, should result in more efficacious products so that there is no longer an excuse for lack of clinical efficacy from a formulation that contains sufficient active material.
REFERENCES
1.Wiechers JW. The barrier function of the skin in relation to percutaneous absorption of drugs. Pharm Weekbl Sci Ed 1989; 11:185–198.
2.Pilgram GSK, Vissers DCJ, van der Meulen H, et al. Aberrant lipid organization in stratum corneum of patients with atopic dermatitis and lamellar ichthyosis. J Invest
Dermatol 2001; 117:710–717.
3.Potts RO, Guy RH. Predicting skin permeability. Pharm Res 1992; 9:663–669.
4.Izquierdo P, Wiechers JW, Escribano E, et al. A study on the influence of emulsion droplet size on the skin penetration of tetracaine. Skin Pharmacol Physiol, accepted for publication, 2007; 20:263–270.
5.Wiechers JW, Kelly CL, Blease TG, et al. Formulating for efficacy. Int J Cosmet Sci 2004; 26:173–182.
6.Scheuplein RJ, Blank IH. Mechanism of percutaneous absorption: IV. Penetration of nonelectrolytes (alcohols) from aqueous solutions and from pure liquids. J Invest Dermatol 1973; 60:286–296.
7.Wiechers JW, Rawlings AV, Garcia C, et al. A new mechanism of action for skin whitening agents: binding to the peroxisome proliferator-activated receptor. Int J Cosmet Sci 2005; 27:123–132.


21 Dry Skin and Moisturizers
Anthony Vincent Rawlings
AVR Consulting Ltd., Northwich, Cheshire, U.K.
Paul John Matts
Procter & Gamble Beauty, Egham, Surrey, U.K.
INTRODUCTION
Over a decade ago, Rawlings et al. (1) summarized the knowledge on the state of the art of stratum corneum (SC) biology and dry skin, and this was recently elaborated by Rawlings and Matts (2). This chapter builds on these publications and Chapter 7 to discuss the latest understanding of dry skin (Fig. 1) and the ef- fect of moisturizers on this most common dermatological problem. First, however, we need to consider the role of water loss through the SC. We are all losing water through our skin unless we live in 100% relative humidity (RH) climates. Under normal circumstances, the SC must be as impermeable as possible, except for a small amount of water loss, to (1) hydrate the outer layers of the SC to maintain flexibility and (2) provide enough water to allow enzyme reactions that facilitate
SC maturation events, together with corneodesmolysis and, ultimately, desquama- tion (Fig. 2) (3–6). This inbuilt mechanism of transepidermal water loss (TEWL) is vi- tal for the normal functioning of the SC. Naturally, in this process, water gradients are generated within the tissue. However, a key to precipitating the condition we call “dry skin” is a perturbation of these water gradients within the SC, and Warner and his team at Procter & Gamble were the first to demonstrate the changes in SC water gradients in dry skin (7) where about one-third of the outer layers of the SC are reported to contain less than 10% water content (Fig. 3). At this level of water, the SC will be dysfunctional and brittle (8).
The SC uses the following three main mechanisms to hold onto water:
1.The presence of intercellular lamellar lipids, whose physical conformation, pre- dominantly an orthorhombic laterally-packed gel and a 13-nm-long periodicity lamellar phase induced by linoleate-containing, long-chain ceramides, provide a tight and semi-permeable barrier to the passage of water through the tissue
2.The presence of fully matured, resilient, corneodesmosome-bound and ceramidehydrophobed corneocytes, which influence the tortuosity of the SC and thereby the diffusion path length of water
3.The presence of both intracellular and extracellular hygroscopic materials called natural moisturizing factors (NMFs)
STRATUM CORNEUM AND EPIDERMAL STRUCTURE
The original picture of the SC with a basket-weave appearance at the histological level and a stratum compactum–stratum disjunctum at the electron microscope level has come under scrutiny over the last decade. For instance, Pfeiffer et al. (10) developed new, high-pressure freezing followed by freeze substitution techniques
339

340 |
Rawlings and Matts |
|
|
Figure 1 Typical photo |
||
|
|
graphs of cosmetic dry skin. |
||
|
|
Source: From Ref. 2. |
||
Progressive |
|
|
|
|
corneodesmosomal |
|
|
|
|
degradation & desquamation |
|
|
|
|
Transglutaminase |
|
|
OUTER |
|
mediated corneocyt |
|
STRATUM CORNEUM |
|
|
strengthening |
|
|
|
|
Dehydration triggers |
|
|
|
|
conversion of filaggrin to |
|
|
INNER |
|
Acidification & lipid |
|
STRATUM CORNEUM |
|
|
|
|
|
|
|
lamellar bilayer formation |
|
|
|
|
Lamellar granule and |
|
STRATUM GRANULOSUM |
|
|
lipid precursor formation |
|
|
|
|
NMF precursor-profilaggrin |
|
|
|
|
formation |
|
STRATUM SPINOSUM |
|
|
|
|
|
||
Transglutaminase |
|
|
|
|
|
|
|
|
|
mediated corneocyte |
|
|
|
|
envelope formation |
|
STRATUM BASALE |
|
|
|
|
|
||
Cells linked by desmosomes |
|
|
|
|
|
|
|
|
|
Figure 2 Typical structure of the epidermis and critical steps in formation of the SC. Source: From Ref. 1 and 9.
Figure 3 (A) Water profile averaged over a single rectan gular region of a cryosection con tained from an individual with good skin, grade 0.5. The hori zontal axis is distance across the SC with the SC/granulosum junction indicated by a vertical line. (B) Water profile averaged over a single rectangular region of a cryosection obtained from an individual with dry skin, grade 4. Source: From Ref. 7.

Dry Skin and Moisturizers |
341 |
Figure 4 High-magnification cryoscanning elec tron microscopy images of two sheets of stratum corneum (SC) hydrated to 90% w/w. Both sheets show an increased hydration level in their central regions and a low hydration in the superficial and lowest part of the SC. Source: From Ref. 13.
for electron microscopy methods and visualized an SC that appeared more compact with smaller intercellular spaces and, hence, tighter cell-cell interactions. More con- troversial, however, was the lack of keratohyalin granules in the epidermis. Norlen (11) has also developed novel cryotransmission electron microscopy techniques to image vitreous sections of skin without the use of cryoprotectants and, again, a more densely packed SC was apparent compared with conventional images and new organelles or tubular structures were observed in the epidermis. Norlen (12) has further proposed a cubic rod-packing model for SC keratin structures. How- ever, even with a more compacted SC, several swelling regions have been estab- lished by Bouwstra et al. (13) and Richter et al. (14) upon skin hydration that appear to be related to loss of barrier function and loss of NMF in the outer layers of the SC, hydrolysis of filaggrin to NMF and lysis of nonperipheral corneodesmosomes, allowing greater intercorneocyte freedom and transglutaminase-mediated matura- tion of corneocytes toward the surface layers of the SC (Fig. 4). All these events become aberrant in dry skin.
STRATUM CORNEUM LIPID CHEMISTRY AND BIOPHYSICS
All SC lipids are important for barrier function of the skin, but because of their unique properties and structure, the ceramides have been of most interest in re- cent years. Ceramides constitute (on a weight basis) approximately 47% of the SC lipids (15). A new nomenclature based on structure, rather than the original chro- matographic migration characteristics, was proposed by Motta et al. (16). In this system, ceramides are classified in general as CER FB, where F is the type of fatty acid and B indicates the type of base. When an ester-linked fatty acid is present, a prefix E is used. Normal fatty acids (saturated or unsaturated), α-hydroxy fatty acids, and ω-hydroxy fatty acids are N, A, and O, respectively, whereas sphingo- sines, phytosphingosines, and 6-hydroxysphingosine are indicated by S, P, and H, respectively. Sphinganine (not previously classified) is proposed to be SP in this nomenclature system. A novel long-chain ceramide containing branched-chain fatty acids is also found in vernix caseosa (17). Typical structures of human ceramides are given in Figure 5. Newly identified ceramides have also been found attached to the corneocyte envelope. In addition to ceramide A (sphingosine) and ceramide B (6-hydroxysphingosine), Chopart et al. (18) recently identified covalently bound ω-hydroxyl fatty acid containing sphinganine and phytosphingosine ceramides. These covalently bound ceramides should now be named CER OS, CER OH, CER OSP, and CER OP.

342 |
Rawlings and Matts |
= |
= |
=O |
|
O |
|
|
|
|
O |
HN |
|
|
|||
|
|
|
|
OH |
|
||
|
CER EOS |
|
|
||||
|
|
OH |
|
||||
|
|
O |
|
|
|
|
O |
|
HN OH |
|
|
|
HN |
OH |
|
CER NS |
|
OH |
|
CER NP |
|
|
OH |
|
=O |
O |
OH |
||||
|
|
|
|
|
|||
|
|
|
O |
|
|
|
|
|
|
|
HN |
|
OH |
|
|
|
CER EOH |
|
|
||||
|
|
OH |
|
||||
|
|
OH |
|
OH |
|
||
|
|
|
|
OH |
|||
|
|
O |
|
|
|
O |
|
|
|
HN |
OH |
|
|
HN |
OH |
CER AS |
|
|
OH |
CER AP |
|
|
OH |
|
OH |
|
|
OH |
|||
|
|
|
|
|
|||
|
|
O |
OH |
|
|
|
O |
|
|
HN |
|
|
HN |
OH |
|
CER AH |
|
OH |
CER NH |
|
OH |
||
|
OH |
|
|
OH |
|||
|
|
|
|
||||
= |
= |
=O |
|
O |
|
|
|
|
O |
|
OH |
|
|||
|
|
|
HN |
|
|||
|
CER EOP |
|
|||||
|
|
|
OH |
|
|||
OH
Figure 5 Structures of human SC ceramides.
Ceramides are produced as precursors in the form of glucosylceramides, epider- mosides, or sphingomyelin. Epidermosides are glycated precursors of ω-hydroxyl– containing ceramides. Hamanaka et al. (19) have demonstrated that sphingomyelin provides a proportion of CER NS and CER AS, whereas the glucosylceramides are precursors to ceramides and epidermosides are precursors to the covalently bound ceramides, together with CER EOS, CER EOH, and CER EOP.
It is the lipid packing states, however, and not only the chemical structures of the SC lipids that are important for barrier function. Lipids in vivo appear to exist as a balance between a solid crystalline state (orthorhombic packing) and gel (hex- agonal packing) or liquid crystalline states. The former lipids are the most tightly packed conformation and have optimal barrier properties but a greater proportion of hexagonally packed lipid conformations are known to occur in the outer layers of the SC (20). This is consistent with a weakening of the barrier toward the outer layers of the SC. It is possible that short-chain fatty acids derived from sebum con- tribute to the crystalline to gel transition in the upper SC layers (21).
Bouwstra et al. (22) recently proposed a sandwich model for the lamellar lip- ids consisting of two broad lipid layers with a crystalline structure separated by a narrow central lipid layer with fluid domains (Fig. 6). It seems that cholesterol and ceramides are important for the formation of the lamellar phase, whereas fatty acids play a greater role in the lateral packing of the lipids. Cholesterol may be located with the fatty acid tail of CER EOS in the fluid phase. CER EOS, EOH, and EOP play essential roles in formation of the additional lamellar arrangements. The repeat distances were found to be 13 nm in dimension, composed of two units measuring approximately 5 nm each and one unit measuring approximately 3 nm in thickness. These repeat lamellar patterns were also observed by X-ray diffraction studies and were named the longand short-periodicity phases (LPP and SPP, respectively).
For total lipid mixtures in the absence of CER EOS, mostly hexagonal phases are observed, and no LPP phase is formed. Moreover, the importance of ceramide 1 or CER EOS–linoleate in facilitating the formation of the LPP has been further elaborated by understanding the influence of the type of fatty acid esterified to the ω-hydroxyl fatty acid (Fig. 7) (23). As a consequence, greater amounts of the LPP is observed mainly with linoleate-containing CER EOS, less with oleate-containing CER EOS and

Dry Skin and Moisturizers |
343 |
Figure 6 (A) “Sandwich model,” the characteristics of which are the following: (1) the liquid sublattice is located in the central lipid layer of this phase; in this layer mainly unsaturated linoleic acid and cho lesterol are present. (2) in the sub lattice adjacent to the central layer, a gradual change in lipid mobility occurs due to the presence of less mobile long saturated hydrocarbon chains. (3) only a small fraction of lipids forms a fluid phase in the SC; therefore, one can assume that this central lipid layer is not a continuous phase. (B) The liquid phase parallel to the basal layers of the lamellae facilitates transport and therefore communication be tween the desmosomes. Source: From Ref. 22.
is absent if only stearate-containing CER EOS is present in the lipid mixtures. These studies indicate that for formation of the LPP, a certain fraction of the lipids has to form a liquid phase. If the liquid phase is too high (as with the oleate-containing CER EOS) or too low (as with stearate-containing CER EOS), the levels of the SPP increase at the expense of the LPP. It is important to remember that the fatty acid composition of CER EOS is highly complex but contains a large proportion of linoleic acid.
Compositional changes in SC lipids could, therefore, dramatically influence the condition of the skin. In this respect, using electron microscopy of tape strip- pings from the outer layers of normal healthy SC, Rawlings et al. (24) reported com- plete loss of lamellar ordering in the outer layers of the SC (Fig. 8). These results have been confirmed by Warner et al. (25) and more recently by Berry et al. (26).
|
|
|
|
|
|
|
|
|
|
|
|
|
|
|
|
|
|
|
|
|
|
|
|
|
|
|
|
|
|
Lamellar phases |
|
|
|
|
|
|
Not present |
||||||||
|
LPP SPP |
|
LPP SPP |
|
LPP SPP |
LPP SPP |
Moderately |
|||||||||||||||
|
|
|
|
|
|
|
|
|
|
|
|
|
|
|
|
|
|
|
|
|
|
present |
|
|
|
|
|
|
|
|
|
|
|
|
|
|
|
|
|
|
|
|
|
|
Predominantly |
|
|
|
|
|
|
|
|
|
|
|
|
|
|
|
|
|
|
|
|
|
|
present |
HCER(1-8) |
HCER(1-ste,2-8) |
|
HCER(1-ol,2-8) |
HCER(1-ln,2-8) |
||||||||||||||||||
|
|
|||||||||||||||||||||
|
|
|||||||||||||||||||||
|
|
|
|
|
|
|
|
|
|
|
|
|
|
|
|
|
|
|
|
|
|
|
Figure 7 A summary of the lamellar phases and CER EOS in various lipid mix tures. HCER(1–8) mixtures in which HCER (EOS) is replaced with synthetic stearate– containing CER EOS, oleate-containing
CER EOS, or linoleate-containing CER
EOS. Source: From Ref. 23.

344 |
Rawlings and Matts |
Figure 8 Organization of SC lipids in tape strippings of individuals with clinically nor mal skin. Transmission electron micrographs of tape strippings. Ultrastructural changes in lipid organization toward the sur face of the SC: (A) first strip, absence of bilayers and pres ence of amorphous lipidic material; (B) second strip, dis ruption of lipid lamellae; (C) third strip, normal lipid lamel lae (×200,000). Source: From Ref. 24.
CORNEODESMOSOMES AND CORNEODESMOLYSIS
Corneodesmosomes (27) are macromolecular glycoprotein complexes incorporated into the corneocyte envelope (CE) that consist of the cadherin family of transmem- brane glycoproteins, desmoglein 1 (Dsg 1), and desmocollin 1 (Dsc 1). These gly- coproteins span the cornified envelope into the lipid enriched intercellular spaces between the corneocytes and provide cohesion by binding homeophilically with proteins on adjacent cells. Within the corneocytes, Dsg 1 and Dsc 1 are linked to keratin filaments via corneodesmosomal plaque proteins such as plakoglobin, desmoplakins and plakophilins. The corneodesmosomal protein, corneodesmosin (Cdsn), after secretion by the lamellar bodies together with the intercellular lipids and certain proteases, becomes associated with the desmosomal proteins just before transformation of desmosomes into corneodesmosomes. - these proteins are crosslinked into the complex by transglutaminase, their controlled disruption must oc- cur by proteolysis to allow desquamation to proceed. Indeed, Rawlings et al. (24) and Fig. 9 demonstrated degradation of the corneodesmosomes toward the surface of the SC in humans.
Corneodesmolysis, and ultimately desquamation, is facilitated by the action of specific hydrolytic enzymes in the SC that degrade the corneodesmosomal link- ages. Currently, several serine, cysteine, and aspartic enzymes are believed to be involved in this process, namely, SC chymotryptic enzyme (SCCE), SC tryptic en- zymes (SCTE), SC thiol protease (SCTP now known as cathepsin L-2), cathepsin E, and the aspartic protease cathepsin D. SCCE and SCTE are alkaline-optimal en-

Dry Skin and Moisturizers |
345 |
Figure 9 Electron micrographs of tape strippings of normal skin (grade 1). Degradation of corneo desmosomes (CD) toward the sur face of the SC: (A) First strip, CD fully degraded; (B) second strip; CD partially degraded and encap sulated by lipid lamellae; (C) third strip; CD partially degraded, vacu lation of structure. (D) Third strip, normal CD in contact with lamellar lipids. Source: From Ref. 24.
zymes, whereas the latter ones are acidic-optimum enzymes (28–32). Cathepsin L has also recently been implicated in Cdsn hydrolysis (33). Only SCTE and not SCCE, however, was capable of degrading Dsg 1 (34). This enzyme was also reported to be involved in the processing of pro-SCCE. Bernard et al. (35) have also identified an endoglycosidase, heparanase 1, within the SC, thought to play a role in the preproteolytic processing of the protecting sugar moieties on corneodesmosomal pro- teins. Cdsn undergoes several proteolytic steps. Cleavage of the N-terminal glycine loop domain occurs first at the compactum-disjunctum interface (48–46- to 36–30-kDa transition), followed by cleavage of the C-terminal glycine loop domain in exfoliated corneocytes (36–30- to 15-kDa transition) (36). The last step appears to be inhibited by calcium resulting in residual intercorneocyte cohesion. Nevertheless, the presence of oligosaccharides did not protect Cdsn against proteolysis by SCCE (34). A complete list of the putative desquamatory enzymes is given in Table 1.
These enzymes are secreted with the lamellar bodies and have been immu- nolocalized to the intercorneocyte lipid lamellae. Sondell et al. (37) used antibodies that immunoreact precisely with pro-SCCE to confirm that this enzyme was trans- ported to the SC extracellular space via lamellar bodies. In later studies, using an- tibodies to both pro-SCCE and SCCE, Watkinson et al. (38) demonstrated that the processed enzyme was more associated with the corneodesmosomal plaque. More recently, Igarashi et al. (39) have immunolocalized cathepsin D to the intercellular space, whereas cathepsin E was localized within the corneocytes. Finally, KLK8 has also been reported to be localized to the intercellular spaces of the SC (40).
Naturally, as the desquamatory enzymes are present in the intercellular space, the physical properties of the SC lipids, together with the water activity in this mi- croenvironment, will influence their activity. However, SCCE appears to have a
346 |
|
Rawlings and Matts |
|
Table 1 Desquamatory Enzymes |
|
|
|
|
|
|
|
Sphingoid hydrolases |
Ceramidase |
|
|
|
Glucocerebrosidase |
|
|
|
Sphingomylinase |
|
|
|
Sphingomyelin deacylase |
|
|
|
Glucosylceramide deacylase |
|
|
Sulfatases |
Steroid sulfatase |
|
|
Glycosidases |
Heparanase 1 |
|
|
Serine proteases |
SC chymotryptic-like enzyme |
(SCCE/KLK7) |
|
|
SC tryptic-like enzyme |
(SCTE/KLK5) |
|
Cysteine proteases |
SC thiol protease |
(SCTP/L2) |
|
|
SC cathepsin L-like enzyme |
(SCCL) |
|
Aspartic proteases |
SC cathepsin D-like enzyme |
(SCCDE) |
|
|
SC cathepsin E-like enzyme |
(SCCEE) |
|
|
Skin aspartic protease |
(SASPase) |
|
|
Caspase 14 |
|
|
Abbreviation: SC, stratum corneum.
greater tolerance to water deprivation than other proteolytic enzymes and this may be an adaptation to maintain enzyme activity even within the water-depleted SC intercellular space (41). However, a variety of inhibitors are also present to attenuate their activities, cholesterol sulfate being one. Other protein and peptide inhibitors are present such as elfin, covalently bound to the corneocyte envelope, antileuko- proteinase, α-1-antitrypsin, α-1-antichymotrypsin, and the SPINK5-derived pep- tides (42). Antileukoprotease is believed to be the major physiological inhibitor of SCCE; the serpins are too low in concentration to be physiologically relevant (43). Caubet et al. (34) recently speculated in a new model of desquamation that SPINK5 may also inhibit SCTE.
Currently, little is understood of the molecular activation mechanisms of SCCE or other enzymes within the SC, but Brattsand et al. (44) have proposed a model for the activation of the kallikreins (Fig. 10). Clearly, SC pH and water content will in- fluence enzymic activity. As the SC pH declines toward the surface of the skin, the
Figure 10 Proposed kallikrein activation cascade in human SC. Source: From Ref. 44.

Dry Skin and Moisturizers |
347 |
activity of SCTE and SCCE may be reduced and perhaps the acid-optimal cathepsin enzymes mediate the final desquamatory steps. The role of the newly identified skin aspartic protease and caspase 14 is still awaiting clarification.
CORNEOCYTE ENVELOPE MATURATION AND THE ROLE OF TRANSGLUTAMINASES
The corneocyte envelope is an extremely insoluble proteinaceous layered struc- ture whose stability is attributed to the degree of cross-linking of envelope pro- teins by either disulfide, glutamyl-lysine isodipeptide bonds or glutamyl polyamine cross-linking of glutamine residues of several corneocyte envelope proteins (45). The enzymes, responsible for catalysing the γ-glutamyl-ε-lysine isodipeptide bond formation, are the calcium-dependent transglutaminases (TGase; glutamyl-amine aminotransferases EC 2.3.2.13), of which four are expressed in the epidermis: TGase 1, 2, 3, and 5. However, only TGase 1, 3, and 5 are thought to be involved in kerati- nocyte differentiation.
During the formation of the corneocyte envelope at early time points in the keratinocyte differentiation process, envoplakin and periplakin are expressed and become associated with desmosomes in the viable epidermis. Subsequently, invo- lucrin (the glutamyl-rich protein that covalently binds to lipids) is expressed at the same time as TGase 1 (46–48). TGase 1 then cross-links involucrin to the other early expressed proteins, such as members of the small proline rich (SPRR) family, and subsequently, other plasma membrane proteins become cross-linked and these form a scaffold for further reinforcement and maturation events (49).
When viewed by Normarski microscopy, corneocyte envelopes (CEs) were shown to have a crumpled surface when isolated from the lower layers of the SC and a smoother, more flattened surface when isolated from the upper SC (Fig. 11). These two populations of corneocyte envelopes were named fragile (CEf) and rigid (CEr). Mils et al. (50) reported that about 80% of corneocytes from volar forearm skin were smooth and rigid, whereas 90% from foot sole were rough or fragile cells. They can also be further differentiated by their binding of tetra methyl rhodamine isothio- cyanate (TRITC), with the rigid envelopes staining to a greater extent (51), how- ever, Hirao et al. (52) used a more elegant method to identify corneocyte envelopes based on their hydrophobicity (staining with Nile red) and antigenicity (to antiinvolucrin). It is clear from these studies that immature envelopes (CEf) occur in the deeper layers of the SC (involucrin-positive and weak staining to Nile red or TRITC) and that mature envelopes occur in the surface layers of healthy skin (apparent
Figure 11 Normaski phase contrast microscopy of TRIC stained cornified envelopes demonstrating increased fluorescence labeling of Cer compared with CEf. Source: From Ref. 51.

348
CEr |
Population mean = 832.94µN |
|
0.16 |
|
|
|
|
|
|
|
|
|
|
|
|
|
|
0.14 |
|
|
|
|
|
|
|
|
|
|
|
|
|
probability% |
0.12 |
|
|
|
|
|
|
|
|
|
|
|
|
|
0.06 |
|
|
|
|
|
|
|
|
|
|
|
|
|
|
|
0.1 |
|
|
|
|
|
|
|
|
|
|
|
|
|
|
0.08 |
|
|
|
|
|
|
|
|
|
|
|
|
|
|
0.04 |
|
|
|
|
|
|
|
|
|
|
|
|
|
|
0.02 |
|
|
|
|
|
|
|
|
|
|
|
|
|
|
0 |
350 |
450 |
550 |
650 |
750 |
850 |
950 |
1050 |
1150 |
1250 |
1350 |
1450 |
1550 |
|
250 |
|||||||||||||
|
|
|
|
|
|
Force range (µN) |
|
|
|
|
|
|||
|
CEf |
|
|
|
|
|
|
|
|
0.4 |
|
|
|
Sample mean = 135.1µN |
|||
probability |
0.35 |
|
|
|
|
|
|
|
0.3 |
|
|
|
|
|
|
|
|
0.25 |
|
|
|
|
|
|
|
|
0.2 |
|
|
|
|
|
|
|
|
0.15 |
|
|
|
|
|
|
|
|
% |
|
|
|
|
|
|
|
|
0.1 |
|
|
|
|
|
|
|
|
|
|
|
|
|
|
|
|
|
|
0.05 |
|
|
|
|
|
|
|
|
0 |
|
110 |
130 |
150 |
170 |
190 |
210 |
|
70 |
90 |
||||||
Force range (µN)
Rawlings and Matts
Figure 12 Distribution pro file of the maximal compres sional forces (μN) of individual CEs. Top panel shows the force range for Cer and the bottom for CEf. The maximal compression force was significantly differ ent between the corneocytes. Source: From Ref. 51.
involucrin staining lessened and increased staining with Nile red or TRITC). More recent work from Kashibuchi et al. (53) using atomic force microscopy confirmed these structural changes in corneocytes from the deeper layers of the SC.
The classification of fragile and rigid envelopes has subsequently been found to be a pertinent classification system as, mechanically, they have fragile and rigid characteristics under compressional force (Fig. 12) (51). Supporting this concept of increasing CE strength, γ-glutamyl-lysine cross-links also increase in the subsequent layers of the SC, due to enhanced TGase activity. Three pools of TGase activity have been identified in the SC, which have been classified based upon their solubility characteristics: a water-soluble TGase (mainly TGase 1 and 3), a detergent-soluble TGase (TGase 1) and a particulate form that cannot be liberated from the corneo- cyte. Whether all enzyme fractions are active in this maturation process of CEf to CEr is currently unknown.
STRATUM CORNEUM NATURAL MOISTURIZING FACTORS
Readers should refer to older reviews for a historical perspective on filaggrin bi- ology (1) where it is described that NMF allows the outermost layers of the SC to retain moisture against the desiccating action of the environment. Traditionally, it was believed that this water plasticized the SC, keeping it resilient by prevent- ing cracking and flaking that might occur through mechanical stress. The general mechanisms by which these NMF components influence SC functionality have been

Dry Skin and Moisturizers |
349 |
studied extensively. The specific ionic interaction between keratin and NMF, ac- companied by a decreased mobility of water, leads to a reduction of intermolecular forces between the keratin fibers and an increased elastic behavior. Recent studies have emphasized that it is the neutral and basic free amino acids (54), in particu- lar, that are important for the plasticization properties of the SC. The generation of NMF is summarized by Mechin et al. (Fig. 13) (55) who highlight the importance of peptidylarginine deminases involved in the processing of filaggrin allowing its hydrolysis to NMF.
Hyaluronic acid and glycerol have recently been shown to be present natu- rally in the SC (56). Glycerol can also be derived from sebaceous triglyceride break- down and again, to emphasize the importance of this molecule, studies by Fluhr et al. (57) have indicated that topically applied glycerol can restore to normal the quality of SC observed in asebic mice (lacking sebaceous secretions). The impor- tance of glycerol as a natural skin moisturizng molecule has also been shown by
Elias et al. (58). These two molecules have been largely ignored in descriptions of NMF composition (1). A further understanding of the effect of lactate on SC proper- ties was recently described. Lactate and potassium were found to be the only com- ponents of NMF that correlated significantly with the state of hydration, stiffness, and pH, in the SC (59).
An acid pH within the SC, or the so-called acid mantle, is critical to the cor- rect functioning of this tissue. Studies point to the role of free fatty acids, gener- ated through phospholipase activity, as being vital for SC acidification (60), whereas Krein and Kermici (61) have recently proposed that urocanic acid (UCA) plays a vital role in the regulation of SC pH. Although this is in dispute, it is likely that all NMF components contribute significantly to the overall maintenance of pH.
Other components of NMF, not derived from filaggrin and urea, like lactate may also be derived in part from sweat. However, the presence of sugars in the SC represents primarily the activity of the enzyme β-D-glucocerebrosidase, as it catalyses the removal of glucose from glucosylceramides to initiate lipid lamellae organization in the deep SC (1).
In the last decade new tools have been developed for the measurement of such compounds in vivo. Caspers et al. (62) have pioneered the use of confocal Raman
Figure 13 Schematic rep resentation of profilaggrin ca tabolism and filaggrin hydro lysis to NMF and activation of peptidylarginine deiminase. Source: From Ref. 4.

350 |
Rawlings and Matts |
microspectroscopy to determine the concentration of defined NMF components, non-invasively, in vivo within the SC.
THE EFFECT OF HUMIDITY ON EPIDERMAL DIFFERENTIATION AND SC QUALITY
Before considering the biology of dry skin, it is important to review the effect of environmental conditions on the SC and the epidermis, as these are the primary ini- tiating events for the precipitation of the condition. Rogers et al. (63) demonstrated that there was a significant reduction in the levels of SC ceramides and fatty acids, together with linoleate-containing CER EOS in subjects in winter compared with summer. Similar differences in scalp lipid levels have been observed between the wet and dry seasons in Thailand (64). More importantly, Declercq et al. (65) have reported an adaptive response in human barrier function, where subjects living in a dry climate such as in Arizona (compared with a humid climate in New York) had much stronger barrier function and less dry skin due to increased ceramide levels and increased desquamatory enzyme levels (SCCE and SCTE).
Elias et al. have conducted several studies that support these findings. TEWL was reduced by approximately 30% in animals exposed to a dry (<10% RH) environ- ment due to increased lipid biosynthesis, increased lamellar body extrusion and a slightly thicker SC layer, whereas in animals exposed to a high humidity environ- ment (80% RH), this induction of lipid biosynthesis was reduced (66). However, abrupt changes in environmental humidity can also influence SC moisturization (67). After transferring animals from a humid (80% RH) to dry (<10% RH) envi- ronment, a sixfold increase in TEWL occurred. Barrier function returned to normal within seven days due to normal lipid repair processes. These changes did not oc- cur in animals transferred from a normal to dry humidity environment. Changes in barrier function have also been reported in a group of Chinese workers who were exposed to very low humidity conditions. However, the changes in barrier func- tion take longer to reach equilibrium than anticipated from the animal studies (68). Similar findings were reported for the water-holding capacity and free amino acid content of the SC. Katagiri et al. (69) demonstrated that exposure of mice to a humid environment, and subsequent transfer to a dry one, reduced skin conductance and amino acid levels, even at seven days following transfer; after transfer from a normal environment, however, decreased amino acid levels recovered within three days.
Exposure to low humidity conditions also increases epidermal DNA synthesis and amplifies the DNA synthetic response to barrier disruption (70). Equally, when in a dry environment epidermal interleukin 1 levels increased and levels of this cy- tokine were greater when the barrier was experimentally challenged (71). More re- cently, the same group also reported increased numbers of mast cells and increased dermal histamine levels (but unchanged epidermal histamine levels) (72).
These changes in barrier properties of the SC are attributable to changes in SC moisture content and provide evidence that changes in environmental humidity con- tribute to the seasonal exacerbation or amelioration of xerotic skin conditions, which are characterized by a defective barrier, epidermal hyperplasia, and inflammation.
WINTERAND SOAP-INDUCED DRY SKIN
In dry, flaky skin conditions, corneodesmosomes are not degraded efficiently and corneocytes accumulate on the skin’s surface layer leading to scaling and flaking.

Dry Skin and Moisturizers |
351 |
Increased levels of corneodesmosomes in soap-induced dry skin were first reported by Rawlings et al. (24) but have been confirmed more recently by Simon et al. (73). Many corneodesmosomal proteins are increased in the SC and surface layers of xe- rotic skin (24, 72–74). Interestingly, however, in winter xerosis, the accumulation of the corneodemosomal proteins, Dsg1, and plakoglobin, correlated with each other. Cdsn protein levels, which were also increased, do not, however, have such an as- sociation suggesting that different proteolytic mechanisms occur for the different corneodesmosomal components during desquamation. As suggested by Simon et al. (73), as plakoglobin is a cytoplasmic protein, this would indicate that at least the cytoplasmic domain of Dsg1 may be cleaved. In fact, immunoreactivity to the carboxy-terminal tail of the cytoplasmic portion of Dsg1 was observed. Perhaps the intracellular portions of Dsg1 are also degraded within the corneocyte (for example, plakoglobin by the trypsin-like activity or cathepsin E activity reported within the corneocyte matrix). Conversely, Cdsn might be degraded by SCCE, SCTE or cathep- sin D in the lamellar matrix. This is consistent with early electron microscope im- ages (24) showing that corneodesmosomes become internally vacuolated, followed by complete detachment of the protein structures from the corneocyte envelope (Fig. 9).
The lamellar lipid matrix is also perturbed dramatically in dry skin (Fig. 14) (24). As the main desquamatory enzymes are found within this lipid matrix, the physical properties of the lamellar lipids will, therefore, influence enzyme activity.
Reduced levels of SCCE were originally reported by Rawlings et al. (5) in the outer layers of xerotic SC compared with normal skin. This was confirmed recently in more extensive studies by Van Overloop et al. (75) who found that the equally important SCTE activity was also reduced. Conversely, in sodium lauryl sulfate
Figure 14 Organization of SC lipids in tape stripping of subjects with winter xerosis. Transmission electron micrographs of tape strip pings of individuals with severe xerosis. Perturbation in lipid organi zation toward the surface of the SC. (A) First strip, disorganized lipid lamellae; (B) second strip, disorga nized lipid lamellae; (C) third strip, normal lipid lamellae (×200,000). Source: From Ref. 24.

352 |
Rawlings and Matts |
(SLS)–induced dry skin, increased activities of these enzymes were reported (29). More recently, the overactivation of the plasminogen cascade has been associated with dry skin. Normally, only observed in the epidermal basal layers, skin plasmin is widely distributed through the epidermis in dry skin. A urokinase-type plasmin- ogen activator also exists in the SC (76). Clearly, these and other enzymes are poten- tially involved in the inflammatory and hyperproliferative aspects of dry skin.
It is now well established that in hyperproliferative disorders such as dry skin there is a change in SC lipid composition. In particular, the composition of the ceramide subtypes change and a predominance of sphingosine-containing ce- ramides (at the expense of the phytosphingosine-containing ceramides) have been observed in the SC of subjects with dry skin. Fulmer and Kramer (77) first identi- fied these changes in SDS induced dry skin (increased levels of ceramide 2 and 4, and reduced levels of ceramide 3). However, Saint-Leger et al. (78) could not find any changes in ceramide levels in dry skin, but found increased fatty acid levels.
Rawlings et al. demonstrated reduced levels of ceramides at the surface of the SC in winter xerosis (24). At this time, the full complexity of the different ceramide structure was not known but Chopart et al. (79) observed dramatic reductions in the levels of phytosphingosine-containing ceramides in dry skin (approximately 50%), together with a shortening and lengthening of the acyl-sphingoid bases sphingosine and 6-hydroxysphingosine. Van Overloop et al. (75) also demon- strated that the phytosphingosine-containing ceramides were reduced to a greater extent than other ceramides, with increasing dryness levels. Fulmer and Kramer (77) also observed dramatic reductions in the levels of long-chain fatty acids in dry skin. Imokawa et al. (80) did not find reduced ceramide levels in xerotic skin (but only average levels, rather than superficial levels, were measured).
These changes in lipid composition will, of course, influence the lamellar packing of the lipids. In fact, Schreiner et al. (81) established a reduction of CER EOS and EOH with increased concentrations of sphingosine-containing ceramides (CER NS and CER AS) and crystalline cholesterol in association with a loss of the LPP. However, although the lipid ultrastructure is clearly aberrant in the outer layers of dry skin (24), more work is needed to ascribe a particular lipid phase.
The proportions the different corneocyte envelope phenotypes also change in subjects with dry skin (44,51). Soap washing leads to a dramatic increase in the levels of the fragile envelope phenotype at the expense of the rigid phenotype. It is known that SC transglutaminase activities increase toward the surface of the SC, particu- larly the detergent-soluble and particulate fractions. Although the same trend of the relative increase in TGase between the inner and outer corneum is true of dry skin, TGase activities are dramatically lowered in dry skin compared with healthy skin, particularly the detergent-soluble fraction, which contains mainly TGase 1.
Reduced NMF levels are also implicated in dry skin conditions. The loss of NMF generally reported with increased ageing, however, is not consistent with the recent observations (82) of increased NMF in subjects with senile xerosis, and sug- gests that our understanding of this process is far from complete.
THE DRY SKIN CYCLE MODEL
Recently, it has been proposed that the induction and propagation of dry skin con- ditions may be best and most intuitively expressed as a cyclical model, dependent on SC integrity and particularly upon barrier function and homeostasis (2). In this model, it is emphasized that a spiralling deterioration in skin condition occurs that,

Dry Skin and Moisturizers |
353 |
without intervention, would lead to a progressive worsening in model endpoints. Additionally, it is implicit that intervention at one, or preferably multiple, points within this cycle is necessary to arrest the progression of this continuing downward spiral. The model describes several phases within this cycle and, therefore, possible targets against which treatments could be directed. Reference to the graphical de- piction of the model (Fig. 15) may facilitate complete understanding of the relation- ship of these phases.
The induction phase can be mediated by a variety of different factors:
▪Low environmental temperature and humidity
▪Abrupt changes in environmental conditions that includes the effect of modern indoor climate-controlled environments
▪Surfactant dissolution of SC lipid and NMF
▪Chronological ageing and genetics
Once the skin is provoked by one or more of these factors, there is an inevitable sequence of events that may be described conveniently as a cycle.
Blank (8) estimated that the SC loses its flexibility once its water content falls below approximately 10%, the provocation for which may constitute one or a com- bination of the factors noted above. Without intervention, this quickly leads to a steeper SC hydration gradient, a decrease in net recondensation on the SC surface, a corresponding increase in evaporative water loss from the SC surface, a conse- quent further drop in SC water concentration, and so on. The inevitable rapid con- sequence of this series of events is a decrease in the plastic or viscous properties of the SC (commonly interpreted as skin softness or suppleness), an increase in SC fragility/brittleness and an impairment of SC barrier function (83–86). This surface dehydration is the first step in the development of the dry skin cycle and is further exacerbated by destruction of the normal barrier lipid lamellae in the outer layers of the SC during bathing (24). The impaired barrier in the superficial layers of the SC allows leaching of NMF from the outermost skin cells, thereby reducing SC water activity. Whiteness between the dermatoglyphics (caused by backscatter from mul- tiple tissue–air interfaces) and minor scaling due to the dehydration of individual
Figure 15 Schematic dia gram showing pivotal events within the dry skin cycle. Abbreviations: NMF, natural moisturiz ing factor; SC, stratum corneum; TEWL, transepidermal water loss. Source: From Ref. 2.

354 |
Rawlings and Matts |
corneocytes are the first visible steps in the cycle. Perturbation to the barrier then leads to further development of dry skin.
Enhanced keratinocyte proliferation, consequent hyperkeratosis, and mild in- flammatory changes, one of the hallmarks of dry skin conditions, occur as the skin attempts to repair itself. This response is mediated via production and secretion of cytokines and growth factors, with many researchers citing the ratio between interleukin-1 receptor antagonist protein and interleukin 1α as a key marker of this process (87–90). The degree of hyperproliferation is dependent upon the corre- sponding degree of barrier perturbation (91), probably reflecting both the ingress of exogenous irritants through the impaired barrier and the growing realization that the SC barrier is itself a biosensor and that corneocytes and keratinocytes are par- ticipating in the release of these messengers. The hyperproliferation of the epider- mis probably occurs as a result of the double paracrine signalling events between the epidermis and dermis. Interleukin 1 acts on fibroblasts that, in turn, secrete KGF and GMCSF inducing hyperproliferation and dysfunctional differentiation of keratinocytes (92).
The induction of this inflammatory hyperproliferative state is absolutely a key in the cycle of dry skin as it fundamentally leads to aberrant differentiation and the overhasty production of a variety of poor quality materials and structures vital to the proper functioning of the SC barrier and normal healthy skin. These include
1.the production of smaller and immature corneocyte envelopes;
2.changes in epidermal lipid and particular ceramide biology;
3.reduced protease and transglutaminase activity;
4.reduced filaggrin synthesis and NMF levels.
Finally, a loss in efficiency of desquamation, due to reduced activity of des- quamatory enzymes at the surface of the dry SC, and ensuing scaling, thickening and loss of hygroscopicity of the SC occurs. Marked scaling is one of the obvious consumer-noticeable expressions of dry skin. The formation of a thicker SC with impaired desquamation has, again, immense biophysical importance. The water gradient across the thicker SC becomes steeper, leading to further increases in evap- orative water loss, reducing further water concentration in the outer SC and propa- gating directly another round of the dry skin cycle.
Corneocytes that should be in a mature fully hydrophobed format are now replaced by fragile corneocytes. The resulting barrier protecting these corneocytes and their contents is now weaker due to changes in barrier lipid profiles and surface hydrophobicity. Equally, the hygroscopic (though highly water-labile) NMF present within corneocytes of normal SC, are depleted gradually through normal everyday activities such as cleansing and/or occupational duties (1,60). The corneocytes of dry SC are, therefore, subject to exaggerated insult due to their changed biochemi- cal and biophysical properties. The dry skin cycle, thus, is propagated further by an increased loss of NMF relative to normal skin and a corresponding loss in SC hygroscopicity.
Finally and most importantly, the development of an increasingly thick, dry SC results in a layer characterized, from a biomechanical viewpoint, by a dramatic increase in hardness and brittleness. The consumer perceives this as tightness. These properties create an SC barrier inherently susceptible to mechanical stress and frac- ture, another factor driving the impairment in barrier function cyclical nature of the dry skin cycle.

Dry Skin and Moisturizers |
355 |
The clinical endpoint of dry skin cannot be regarded as static but rather is most fully described as a cycle that, without intervention, tends to perpetuate itself. Pivotal to every stage of this cycle and its propagation is a compromised SC barrier. Interventions that truly break the dry skin cycle, therefore, by definition need to repair and augment SC barrier function.
MOISTURIZERS AND THE MANAGEMENT OF DRY SKIN
Humectants and Occlusive Agents
Traditionally, humectants, occlusives, and emollients have been, and will continue to be, the mainstay of cosmetic treatments (93), and arguably, the most widely used and effective humectant used for xerotic skin is glycerol, due to its excellent safety pro- file, cost, and outstanding water-retaining (humectant) and hygroscopic properties. There is now much evidence, however, that glycerol is not only a mere humectant, but also (i ) is a lipid fluidizer (94), modulating the temperature-dependent rheology
Figure 16 (A) Osmium tetroxide–fixed SC. (i ) Control tissue, no treatment and incubated at 44% RH. Note electron dense corneodesmosomes fully intact. (ii ) Tissue incubated at 80% RH for seven days. Note partial degradation of corneodesmosomes. (iii ) Tissue incubated at 80% RH following 5% glycerol treatment. Note paucity of corneodesmosomes and virtually complete degradation of their structures. (B) Comparison of the number of corneodesmosomes in control SC and SC incu bated at 44%, 80%, and 80% RH following 5% glycerol treatment. Note the decrease in intact cor neodesmosomes in 80% RH-treated samples and the significantly reduced number of intact (black boxes) and total (gray boxes) corneodesmosomes in glycerol-treated tissue incubated at 80% RH.
(C) Comparison of the effect of 5% glycerol on Dsg 1 digestion at 80% RH. Note the dramatic de crease in Dsg 1 levels in glycerol-treated samples. (D) Comparison of the effect of lotions with and without the addition of 5% glycerol on corneocyte release. Source: From Ref. 95.
356 |
Rawlings and Matts |
of SC lipids, thus preventing a loss of fluidity of their lamellar structure at low rela- tive humidities, and (ii) has corneodesmolytic activity, facilitating the proteolytic digestion of superficial corneodesmosomes in dry skin (Fig. 16) (95).
Humectants are also an essential requirement for most of the additional ap- proaches. In O/W creams, occlusives and bilayer-forming lipids (described below) also require glycerol to alleviate dry skin. Moreover, humectants are required for the transglutaminase-mediated corneocyte envelope maturation required for a healthy SC (Fig. 17) (96). In this respect, combinations of humectants including glycerol have been shown to be more effective than using glycerol alone. Glycerol has also been shown to enhance the barrier function of the SC (97).
Like glycerol, urea is a natural component of the SC NMF and has been used as a humectant in creams since 1943 (98). Urea (10%) has been shown to be more ef- ficacious than salicylic acid and petroleum jelly. Urea-containing moisturizers have been reported to improve barrier function, reduce TEWL, increase skin capacitance, and reduce irritation (99–102).
As a principal component of NMF there is considerable interest in the abil- ity of pyrrolidone carboxylic acid (PCA) and its derivatives to moisturize the SC. Creams and lotions containing the sodium salt of PCA are reported to hydrate the SC and improve dry, flaky skin (103–107).
Petroleum jelly acts primarily as an occlusive agent having been shown to reduce TEWL by over 98%, whereas other oils only manage a 20% to 30% reduction. Yet this agent does not simply act as an occlusive film over the surface of the skin. It has been shown to diffuse into the SC intercellular domains, which may add to its efficacy. On penetrating the epidermis, it was also shown to accelerate lipid biosyn- thesis thereby aiding barrier repair (108).
Figure 17 Enhanced CE maturation in dry skin following moisturization. (A) Evidence of in creased TRITC staining (P < 0.00001); (B) as visualized under a fluorescent microscope. Source: From. Ref. 51.

Dry Skin and Moisturizers |
357 |
Bilayer-Forming Lipids
From current understanding of the compositional changes in dry skin, five aspects of SC lipid biochemistry need to be corrected:
1.The lowered levels of ceramides generally
2.The phytosphingosine-containing ceramide insufficiency
3.The ceramide 1 linoleate (CEOS) insufficiency
4.The lowered covalently bound ceramides
5.The precise chain length of the ceramide sphingoid bases and free fatty acids
Overall, however, the lipid lamellar architecture in the outer layers of the SC needs to be normalized in dry, flaky skin conditions. Evidence also indicates that a reduc- tion in long-chain fatty acids also occurs in SLS-induced dry skin. As these lipids are important for inducing an orthorhombic lateral packing state they also need to be supplied to the skin to more effectively correct barrier function. Moreover cor- rection of the reduction of SC NMF levels, correction of the aberration of corneocyte envelope maturation and the impaired corneodesmolysis is needed for dry skin treatments.
Several clinical studies evaluating the effects of ceramides have been con- ducted recently. However, it is important to remember that to derive the full benefits
Figure 18 Moisturization efficacy tests: (A) Comparing the effect of 1% glycerol (square) with a no-treatment control (triangle); (B) comparing the effect of a lotion containing 1% phospholipids, 2% cholesterol and 1% stearic acid (square) with a no-treatment control (triangle); (C) comparing the effect of a lotion containing 1% phospholipids, 2% cholesterol, and 1% stearic acid plus 1% glycerol
(square) with a no-treatment control (triangle); (D) comparing the effect of a lotion containing 1% phospholipid, 2% cholesterol, 1% stearic acid plus 5% glycerol (square) with a lotion containing 1% petrolatum, 2% cholesterol, 1% stearic acid plus 5% glycerol (triangle). Source: From Ref. 115.

358 |
Rawlings and Matts |
of ceramide technology, formulation into heavy emulsions where other emollients dominate the formulation will be difficult to discern unless the ceramides are at a high enough concentration. Two studies investigated the properties of Locobase Re- pair cream and found opposite effects on barrier recovery. Barany et al. (109) did not find any improvements over placebo, whereas Kucharekova et al. (110) found that the CER NP containing cream significantly reduced TEWL, erythema, and epider- mal proliferation compared with placebo cream. Further improvements in function are observed with complete lipid mixtures. De Paepe et al. (111) demonstrated im- provements in barrier functionality and SC hydration from a lipid mixture of CER NP (0.2%), CER AS (0.1%), and CER UP (0.2%) together with cholesterol (0.25%), linoleic acid (0.25%), and phytosphingosine (0.5%) compared with placebo lotions and a lotion containing only CER NP (0.6%) and CER UP (0.4%). The increases in TEWL and SC hydration are shown in Fig. 15. Berardesca et al. (112) have also estab- lished that balanced lipid mixtures containing CER NP are effective in improving the barrier properties and clinical condition of skin in subjects with contact derma- titis. Equally convincing are the studies of Chamlin et al. (113) showing that a cer amide dominant barrier repair cream alleviated childhood atopic dermatitis. Over the six-week treatment period, TEWL values decreased by 50% and the number of D-squame tape strippings required to break the barrier increased from approxi- mately 12 to 22 indicating a stronger SC barrier function. In addition to ceramides, which have been introduced to supplement the SC barrier (114), phospholipids are also bilayer-forming lipids and when combined with glycerol have been shown to be clinically superior to petroleum jelly in relieving dry skin (Fig. 18) (115).
Hydroxyacids
Hydroxyacids are used to facilitate desquamation and improve lipid biosynthesis and barrier function. The influence of α- and β-hydroxy acids (116) on desquama- tion is well established (Fig. 19) but new lipophilic variants of salicylic acid appear to influence corneodesmolysis differently. Whereas lactic and salicylic acid act on all corneodesmosomes, LSA only acted on the stratum disjunctum corneodesmosomes. These lipophilic variants appear to act on the whole structure of the corneodesmo- somes, whereas the “ordinary” acids fractionate the corneodesmosomes. Fartarsch et al. (117) also demonstrated that the action of glycolic acid on corneodesmolysis
Figure 19 Improvement in dry skin condition following twice daily applications of a 12% lactic acid for mulation. Source: From Ref 121.

Dry Skin and Moisturizers |
359 |
was restricted to the stratum disjunctum suggesting a targeted action without com- promising barrier function. Medium-chain fatty acids have also been reported to improve SC flexibility and assist in the relief of dry skin in combination with bar- rier lipids. Further enhanced dry skin relief was observed in the presence of barrier lipids (118), and the l-isomer, in particular, increased SC extensibility and keratino- cyte ceramide synthesis (Fig. 20) (119). In SC extensibility studies, using extensions where only lipids are believed to be extended, longer chain α-hydroxyacids also plasticize the corneum (120).
SC turnover time, measured by dansyl chloride (a measure of epidermal prolif- eration matched by desquamation), increased by 15% after applying a moisturizing cream at pH 3.8. Further increases were obtained by increasing the concentration of the free acid of glycolic acid or by decreasing the pH of the base. At 8% glycolic acid (4% free acid), Johnson (122) reported approximately 30% increase in SC turnover time. The increased turnover time must be matched by increased desquamation otherwise retention hyperkeratosis would occur. Desquamation is enhanced by fur- ther activating acidic-optimum enzymes or by chelating calcium, which is known to reduce the final processing steps of Cdsn degradation.
Not all hydroxyacids perform equally and some appear to enhance the skin’s sensitivity to UV irradiation (e.g., glycolic acid). However, glucanolactone and tar- taric acid have been shown to be superior to glycolic acid and lactic acid in improv- ing barrier function (Fig. 21) and do not increase sunburn cell formation (123).
Moisturization Augmentation by Inducing Epidermal
Differentiation and Lipogenesis
Unsaturated fatty acids are ligands for nuclear receptors such as the peroxisomal proliferator–activated receptor, and have been shown to improve epidermal
Figure 20 Effect of lactic acid on SC lipid levels and barrier function following a one-month topi cal application of 4% lactic acid in an aqueous vehicle. TEWL evaluated before application of SLS patch and 24 hours after removal (*P < 0.05). Source: From Ref. 119.

360 |
Rawlings and Matts |
18
gluconolactone
16 glycolic
 lactic
14 |
tartaric |
|
12 |
untreated |
|
vehicle |
|
|
|
|
|
10 |
|
|
8 |
|
|
6 |
|
|
4 |
|
Figure 21 TEWL after sodium lauryl sulfate chal |
|
lenge (g/m2/hr). Lower barrier damage was detected in |
|
|
|
|
2 |
|
α-hydroxy acid–treated sites compared with vehicle and |
TEWLbas TEWLpre-irrit TEWLO TEWL24 TEWL48 |
untreated sites. Source: From Ref. 123. |
|
differentiation and increase ceramide and filaggrin levels (124). This superfamily of nuclear transcription receptors includes receptors for retinoic acid, steroids, thyroid, and vitamin D, together with the peroxisome proliferator–activated receptor (PPAR), the farnesol-activated receptor (FXR), and the liver-activated receptor (LXR). These transcription factors bind their respective ligands and reg- ulate many aspects of cellular proliferation and differentiation. Fatty acids are important ligands for the PPAR receptor, farnesol for the FXR, and hydroxylated cholesterol derivatives or cholestenoic acid for the LXR. All of these pathways stimulate epidermal differentiation and increased the synthesis of involucrin, filaggrin, and enzymes of the ceramide synthesis pathway.
The transcription factor most intensively investigated is the PPAR. There are three main PPAR isoforms α, β/δ, and γ. Nevertheless, PPAR-δ was recently ob- served to be the predominant PPAR subtype in human keratinocytes, whereas PPAR-α and PPAR-γ were only induced during epidermal differentiation suggest- ing nonredundant functions during differentiation (125). Respective ligands for all of these isoforms increase epidermal differentiation. Pharmaceutical ligands for the PPAR receptors increase ceramide synthesis in vitro by increasing the expression of SPT, glucosyl ceramide synthase and glucocerebrosidase but not sphingomyelinase (126). More recently, PPAR-δ ligands were found to be the most potent in inducing epidermal differentiation (tetrathioacetic acid) by increasing involucrin and trans- glutaminase while decreasing proliferation.
Petroselenic acid (127) and conjugated linoleic acid (128) have been identified as potent PPAR-α activators, improving epidermal differentiation, reducing inflam- mation, increasing extracellular matrix components and eliciting skin lightening. Increased levels of transglutaminase, involucrin, filaggrin and corneocyte envelope formation were observed in keratinocytes in vitro after treatment with petroselenic acid. These effects were confirmed in vivo by short-term patch testing over three weeks and increased involucrin and filaggrin were also observed (Fig. 22). Improve- ments in the signs of photodamage, skin tone, and dry skin were also observed in a 12-week clinical study on forearm skin (129). Octadecenedioic acid has also recently been identified as a pan-PPAR agonist (with a preference for PPAR-γ). It has been shown to reduce skin hyperpigmentation and is also expected to improve epider- mal differentiation (130).

Dry Skin and Moisturizers |
361 |
Figure 22 Increased syn thesis of profilaggrin/filaggrin in human axilla skin detected by immunohistochemistry follow ing a three-week application of a 1% petroselinic acid formula tion. Source: From Ref. 131.
Changes in lipid levels and types can be corrected by topical application of agents to manipulate lipid synthesis within the epidermis. However, as described above in dry skin conditions, the epidermis produces less phytosphingosinecontaining ceramides, changes the carbon chain lengths of other sphingoid bases and produces less long-chain fatty acids. These results suggest that changes in the levels or activities of the different fatty acid synthetases and the enzymes involved in phytosphingosine synthesis occur in dry skin. The biology of these enzymes is yet to be described in these conditions.
Elias et al. (132) used lipid mixtures to aid barrier recovery in acetone damaged barrier studies. Cholesterol was shown to aid barrier recovery in a tape-stripping model in aged skin but not young skin. In fact any incomplete mixture of the three major lipid species slows barrier recovery in this model. An equimolar mixture of the three dominant SC lipids allows normal rates of barrier recovery in normal skin, whereas adjustment to a 3:1:1 (ceramide/cholesterol/fatty acid) molar ratio accelerates barrier recovery. As expected the requirements for optimal barrier recovery in aged skin is different and it has been shown that a cholesterol dominant lipid mixture ac- celerates barrier recovery in aged skin, whereas a fatty acid dominant mixture delays barrier recovery. In young skin any lipid species can be dominant and the barrier will recover quickly but in atopic dermatitis a ceramide dominant mixture is required (133). Further studies on the use of long-chain fatty acids are recommended. It has been shown that mevalonic acid, the product of the rate limiting enzyme HMGCoA reductase, increases cholesterol biosynthesis (134).
There are several other means to increase ceramide synthesis in vivo and im- prove barrier function. As described above α-hydroxy acids, well known for their desquamatory properties, stimulate lipid biosynthesis. Lactic acid, especially the l- isomer, increases ceramide biosynthesis in vitro and in vivo. Presumably, lactic acid achieves this by acting as a general lipid precursor by providing acetate and more reducing power in the form of NADH or NADPH (135). Interestingly, lactic acid also increased the levels of linoleate-containing CER EOS, which may contribute to the improvements in skin functionality.
The pleotropic skin benefits of niacinamide have been the subject of intense study and have been excellently reviewed by Matts et al. (136). Niacinamide has been reported to stimulate the synthesis of glucosylceramides, sphingomeylin, cholesterol

362 |
Rawlings and Matts |
|
Table 2 Agents That Increase Ceramide Biosynthesis |
||
|
|
|
Lipids |
Optimized mixtures of ceramides, cholesterol, fatty acids |
|
Lipid precursors |
Phytosphingosine, tetraacetylphytosphingosine, ω-hydroxy |
|
α-Hydroxy acids |
fatty acids, linoleic acid |
|
l-Lactic acid |
||
Humectants |
Glycerol, urea |
|
Vitamins |
Niacinamide, lipoic acid, ascorbic acid |
|
Protease inhibitors |
Aminocyclohexanecarboxylic acid, egg white lysozyme |
|
Minerals |
Magnesium, calcium |
|
Histamine receptor |
H1 receptor antagonist |
|
Antagonists |
H2 receptor antagonist |
|
PPAR |
PPAR-α agonists |
|
Electrical potential |
Negative potential |
|
Triterpenoids |
Ursolic acid |
|
GABA agonists |
GABA type A agonists (musimol, isoguvacine) |
|
Purinergic receptor |
P2Y antagonists |
|
Fragrances |
Fragrances |
|
GC receptor |
Glucocorticoid receptor antagonists |
|
Abbreviations: PPAR, peroxisome proliferator–activated receptor; GABA, γ-aminobutyric acid. Source: From Ref. 143.
and fatty acids by keratinocytes in vitro (129). The increases in ceramide synthesis were achieved by enhancing the activity of SPT together with the expression of LCB 1 and 2. In vivo, however, increased levels of SC fatty acid (67%) and ceramide (34%) levels were observed. Similar to studies with lactic acid, increases in the levels of SC cholesterol are refractory to change. Tanno et al. (137) have also been researching the changes in skin functionality in sensitive skin. In their most recent studies topi- cal application of niacinamide improved the barrier of the most severely affected
|
|
N |
V2 |
D |
|
K |
G |
A |
|
NT |
|
3 |
|
|
|
|
|
|
|
|
|
Dryness |
2.5 |
|
|
|
|
|
|
|
|
|
2 |
|
|
|
|
|
|
|
|
|
|
1.5 |
|
|
|
|
|
|
|
|
|
|
Visual |
|
|
|
|
|
|
|
|
|
|
1 |
|
|
|
|
|
|
|
|
|
|
|
|
|
|
|
|
|
|
|
|
|
|
0.5 |
|
|
|
|
|
|
|
|
|
|
0 |
|
|
|
|
|
|
|
|
|
|
0 |
1 |
3 |
5 |
7 |
10 |
|
14 |
21 |
28 |
N is significantly (P<0.05) different to all other products at days 3, 5, 7, 10 & 14
Figure 23 Results from the treatment phase of a Kligman-type regression study (products ap plied twice daily at 2 mg/cm2 to randomized sites on the outer, lower leg of female subjects (n = 36) with inclusion of a no-treatment control). Products represented high-efficacy commercial moistur izers with ingredients of differing dry skin relief mechanism. Abbreviations: NT, no treatment control;
N, niacinamide-containing lotion; A, lactic acid–containing moisturizer; other product codes repre sent commercial products with high loadings of traditional humectants and emollients (including glycerin and petrolatum). Source: From Ref. 2.

Dry Skin and Moisturizers

 N
N  V2
V2  D
D  K
K  G
G  A
A  NT
NT
g/m2/h |
25 |
|
20 |
||
|
||
TEWL |
15 |
|
10 |
||
|
5 |
|
|
0 |
Baseline |
24 Hr after SLS |
|
N is significantly (P<0.05) different to all other products Still superior at days 2 & 3 data not shown
Full recovery of TEWL at day 5
(A) |
|
|
|
|
|
|
|
|
N |
V2 |
D |
K |
G |
A |
NT |
|
12 |
|
|
|
|
|
|
|
10 |
|
|
|
|
|
|
g/m2/h |
8 |
|
|
|
|
|
|
6 |
|
|
|
|
|
|
|
TEWL |
4 |
|
|
|
|
|
|
|
|
|
|
|
|
|
|
|
2 |
|
|
|
|
|
|
|
0 |
|
|
|
|
24 Hr after TS |
|
|
Baseline |
|
|
|
|||
|
N is significantly (P<0.05) different to products V2, D & K |
||||||
(B) |
|
|
|
|
|
|
|
363
Figure 24 (A) Change in TEWL in posttreatment phase after SLS patch chemical insult expressed as difference from pretreatment base line. (B) Change in TEWL in post treatment phase after tape-stripping mechanical insult expressed as dif ference from pre-treatment baseline
Source: From Ref. 147.
subject with sensitive skin with a concomitant improvement in stinging score. Ertel et al. (138) observed similar improvements in barrier functionality together with an increased SC turnover rate using a 2% niacinamide cream. Others (139) observed significant improvements in SC barrier function and improvement in global skin condition in subjects with stage I/II rosacea.
Topical application of phytosphingosine and its derivatives have also been shown to increase SC ceramide levels and barrier function (140). This is especially important as the phytosphingosine-containing ceramides are deficient in dry skin. Although increases in the total levels of ceramides were observed, greater increases in CER EOS and CER AS were found when combined with juniperic acid and lin- oleic acid. Linoleic acid on its own is incorporated into CER EOS in vivo (141), which is important for lipid phase behavior and skin properties. Lipid fractions from un- saponifiable fractions of avocado (furanyl-8-11- cis heptadecadiene) and sunflower oleodistillates (mainly linoleic and oleic acids) also increase ceramide and choles- terol biosynthesis ex vivo (142).
The effects of increasing SC lipid levels by stimulating ceramide biosynthe- sis have been investigated extensively by Denda et al. (141). Histamine antagonists

364 |
Rawlings and Matts |
and certain fragrances stimulate lipid biosynthesis. Mixtures of magnesium and calcium salts have also been shown to accelerate skin barrier recovery and improve surfactantor tape-stripping–induced dry skin. Although these studies indicate the importance of these ions for epidermal homeostasis, more work is needed with cos- metic formulations. More recently, it has been demonstrated that γ-aminobutyric acid (GABA) type A receptor agonists, muscimol, and isoguvacine accelerate bar- rier recovery following disruption. Conversely, ATP (purinergic) receptor (P2X) agonists delay barrier recovery, whereas P2Y antagonists accelerate it. These also reduced the epidermal hyperproliferative response induced by acetone treatment under low environmental humidity (summary on Table 2).
Other agents have been shown to stimulate ceramide synthesis in vitro. Li- poic acid and N-acetylcysteine were also reported to increase ceramide synthesis in vitro (144). Recently vitamin C has been shown to activate PKC and increase ceramide synthesis and improve the ceramide subspecies profile in epidermal skin equivalents (145). Others (146) have also demonstrated that ursolic acid increased ceramides in human skin.
Recently, niacinamide has been formulated in lotions, together with glycerol and other NMF components, which effectively alleviate dry skin and provide sig- nificant improvement in SC barrier function (147). These lotions are more effective than traditional emollient and lactic acid–containing moisturizers in relieving dry skin in the treatment phase of a typical Kligman-type regression study (Fig. 23), to-
Enzyme mediated degradation of corneodesmosome and lipids, weakening of barrier
& loss of NMF
Enzyme diffuses towards corneodesmosomes to begin their degradation and encapsulation with barrier lipids,
transformation of fragile to resilient corneocyte
Intact corneodesmosomes and normal lipid bilayers,
filaggrin hydrolysis dependent on water activity
|
|
D= Corneodesmosome |
|
|
|
E= Stratum corneum enzymes |
|
e |
CELL |
e=Intracellular enzymes |
|
SURFACE LAYERS |
|||
|
E |
||
|
OF |
||
e |
CELL |
STRATUM CORNEUM |
|
|
|||
e |
E D |
|
|
FRAGILE CELL |
INNER LAYERS |
||
|
D |
||
|
OF |
||
e |
|
STRATUM CORNEUM |
|
|
|
||
FRAGILE CELL |
|
||
(A)
Intact corneodesmosomes, reduced enzyme activity, lipid disruption, decreased lipids leading to abnormal barrier function, excessive
loss of NMF & retention
of fragile corneocyte phenotype
Intact corneodesmosomes and lipid disruption,
lack of maturation of corneocytes reduced Tgase activity
Intact corneodesmosomes & normal lipid bilayers
eFRAGILE CELL |
D= Corneodesmosome |
|
E= Stratum corneum enzymes |
||
e=Intracellular enzymes |
||
Ee |
D |
SURFACE LAYERS |
OF |
||
FRAGILE CELL STRATUM CORNEUM |
||
E |
D |
|
e |
|
|
FRAGILE CELL |
|
|
E |
D |
INNER LAYERS |
e |
|
OF |
|
STRATUM CORNEUM |
|
FRAGILE CELL |
||
RELEASE OF INFLAMMATORY MEDIATORS AND PROTEASES
(B)
Figure 25 Summary of SC maturationandcorneodesmoly sis in (A) normal and (B) dry skin. Source: From Ref. 2.

Dry Skin and Moisturizers |
365 |
gether with the changes in moisturization and barrier function as well as improv- ing resistance to SLS and tape-stripping–induced barrier perturbation (Fig. 24) (100). Increased SC thickness due to increased SC hydration was also proven in vivo using Raman microspectroscopy following topical application of niacinamide lotions (148).
SUMMARY AND CONCLUSIONS
Tremendous advances in our knowledge of SC biology have been made over the last decade but more importantly the understanding of the aberration of the nor- mal functioning of the SC in dry, flaky skin conditions has become clearer and a new model of dry skin has been described (Fig. 25). On perturbation of SC barrier function, superficial dehydration of the SC occurs and release of inflammatory me- diators, induction of hyperproliferation, and disruption of epidermal differentia- tion is induced. As has become apparent, reductions in SC water and NMF levels, changes in lipid ultrastructure and reductions in enzyme activities contribute to the reduced corneodesmolysis that occurs in these conditions (Fig. 24). Although occlusives, emollients, and humectants have been the mainstay of cosmetic treat- ments, their effects on epidermal and SC biology have only recently been described. New ingredients, such as ceramides and other bilayer forming lipids, hydroxyacids, ligands for nuclear receptors such as PPAR and agents such as niacinamide, have been evaluated. The combination of traditional and new approaches has resulted in new therapies for the treatment of dry skin.
REFERENCES
1.Rawlings AV, Scott IR, Harding CR, et al. Stratum corneum moisturization at the molecular level. J Invest Dermatol 1994; 103:731–740.
2.Rawlings AV, Matts PJ. Stratum corneum moisturization at the molecular level: an update in relation to the dry skin cycle. J Invest Dermatol 2005; 124:1099–1110.
3.Rawlings AV. Skin waxes: their composition, properties, structures and biological significance. In: Hamilton, RJ, ed. Waxes: Chemistry, Molecular Biology and Functions. Dundee, Scotland: The Oily Press, 1994:221–256.
4.Harding CR, Watkinson A, Rawlings AV. Dry skin, moisturization and corneodesmolysis. Int J Cosmet Sci 2000; 22:21–52.
5.Rawlings AV, Harding CR, Watkinson, et al. Dry and xerotic skin conditions. In: Leyden JJ, Rawlings AV, eds. Skin Moisturization. New York: Marcel Dekker, 2002:119–143.
6.Rawlings AV. Trends in stratum corneum research and the treatment of dry skin conditions. Int J Cosmetic Sci 2003; 25:63–95.
7.Warner RR, Lilly NA. Correlation of water content with ultrastructure in the stratum corneum. In: Elsner P, Berardesca E, Maibach HI, eds. Bioengineering of the Skin: Water and the Stratum Corneum. Boca Raton, Fla: CRC Press, 1994:3–12.
8.Blank IH. Factors which influence the water content of the stratum corneum. J Invest Dermatol 1952; 18:433–440.
9.Rawlings AV, Harding CR. Moisturization and skin barrier function. Dermatol Ther 2004; 17: 43–48.
10.Pfeiffer S, Vielhaber G, Vietzke JP, et al. High-pressure freezing provides new information on human epidermis: simultaneous protein antigen and lamellar lipid structure preservation. Study on human epidermis by cryoimmobilization. J Invest Dermatol 2000; 114(5):1030–1038.
11.Norlen L. Skin barrier structure and function: The single gel phase model. J Invest Dermatol 2001; 117:830–836.
366 |
Rawlings and Matts |
12.Norlen L, Al-Amoudi A. Stratum corneum keratin structure, function, and formation: the cubic rod-packing and membrane templating model. J Invest Dermatol 2004; 123(4):715– 732.
13.Bouwstra JA, de Graaff A, Gooris GS, et al. Water distribution and related morphology in human stratum corneum at different hydration levels. J Invest Dermatol 2003; 120(5):750–758.
14.Richter T, Peuckert C, Sattler M, et al. Dead but highly dynamic—the stratum corneum is divided into three hydration zones. Skin Pharmacol Physiol 2004; 17(5):246–257.
15.Downing DT, Stewart ME. Epidermal composition. In: Loden M, Maibach HI, eds. Dry Skin and Moisturizers. Boca Raton, Fla: CRC Press, 2000:13–26.
16.Motta SM, Monti M, Sesana S, et al. Ceramide composition of psoriatic scale. Biochim Biophys Acta 1993; 1182: 147–151.
17.Oku H, Mimura K, Tokitsu Y, et al. Biased distribution of the branched-chain fatty acids in ceramides of vernix caseosa. Lipids 2000; 35(4):373–381.
18.Chopart M, Castiel-Higounenc I, Arbey E, et al. Anew type of covalently bound ceramide in human epithelium. Stratum Corneum 2001; III (poster).
19.Hamanaka S, Hara M, Nishio H, et al. Human epidermal glucosylceramides are major precursors of stratum corneum ceramides. J Invest Dermatol 2002; 119:416–423.
20.Pilgram GSK, Engelsma-van Pelt AM, Bouwstra JA, et al. Electron diffraction provides new information on human stratum corneum lipid organisation studied in relation to depth and temperature. J Invest Dermatol 1999; 113:403–409.
21.Brancaleon L, Bamberg MP, Sakamaki T, et al.Attenuated total reflection-fourier transform infrared spectroscopy as a possible method to investigate biophysical parameters of stratum corneum in vivo. J Invest Dermatol 2001; 116:380–386.
22.Bouwstra J, Pilgram G, Gooris G, et al. New aspects of the skin barrier organization. Skin Pharmacol Appl Skin Physiol 2001; 14:52–62.
23.Bouwstra J, Gooris GS, Dubbelaar FER, et al. Phase behaviour of stratum corneum lipid mixtures based on human ceramides: The role of natural and synthetic ceramide 1. J Invest Dermatol 2002; 118:606–617.
24.Rawlings AV, Watkinson A, Rogers J, et al. Abnormalities in stratum corneum structure lipid composition and desmosome degradation in soap-induced winter xerosis. J Soc Cosmet Chem 1994; 45:203–220.
25.Warner RR, Boissy YL. Effect of moisturizing products on the structure of lipids in the outer stratum corneum of humans. In: Loden M, Maibach HI, eds. Dry Skin and Moisturisers. Boca Raton, Fla: CRC Press, 2000:349–372.
26.Berry N, Charmeil C, Gouion C, et al. A clinical, biometrological and ultrastructural study of xerotic skin. Int J Cosmet Sci 1999; 21:241–249.
27.Serre G, Mils V, Haftek M, et al. Identification of late differentiation antigens of human cornified epithelia, expressed in re-organized desmosomes and bound to cross-linked envelope. J Invest Dermatol 1991; 97:1061–1072.
28.Lundstorm A, Egelud T. Cell shedding from human plantar skin in vitro: evidence that two different types of protein structures are degraded by a chymotrypsin-like enzyme. Arch Dermatol Res 1990; 282:243–237.
29.Suzuki Y, Nomura J, Koyama J, et al. The role of proteases in stratum corneum: involve ment in stratum corneum desquamation. Arch Dermatol Res 1994; 286:249–253.
30.Horikoshi T, Igarashi S, Uchiwa H, et al. Role of endogenous cathepsin D-like and chymotrypsin-like proteolysis in human epidermal desquamation. Br J Dermatol 1999; 141:453–459.
31.Horikoshi T, Arany I, Rajaraman S, et al. Isoforms of cathepsin D human epidermal differentiation. Biochimie 1998; 80:605–612.
32.Watkinson A. Stratum corneum thiol protease (SCTP): a novel cysteine protease of late epidermal differentiation Arch Dermatol Res 1999; 291:260–268.
33.Bernard D, Mehul B, Thomas-Collignon A, et al. Analysis of proteins with caseinolytic activity in a human stratum corneum extract revealed a yet unidentified cysteine protease and identified the so-called ‘stratum corneum thiol protease’ as cathepsin L2. J Invest Dermatol 2003; 120:592–600.
34.Caubet C, Jonca N, Brattsand M, et al. Degradation of corneodesmosome proteins by two serine proteases of the kallikrein family. J Invest Dermatol 2004; 122:1235–1244.

Dry Skin and Moisturizers |
367 |
35.Bernard D, Mehul B, Delattre C, et al. Purification and characterization of the endogly cosidase heparanase 1 from human plantar stratum corneum: a key enzyme in epidermal physiology. J Invest Dermatol 2001; 117:1266–1273.
36.Simon M, Jonca N, Guerrin M, et al. Refined characterization of corneodesmosin proteolysis during terminal differentiation of human epidermis and its relationship to desquamation. J Biol Chem 2001; 276:20292–20299.
37.Sondell B, Thornell LE, Stigbrand T, et al. Immunolocalization of SCCE in human skin. Histo Cyto 1994; 42:459–465.
38.Watkinson A, Smith C, Coan P, et al. The role of Pro-SCCE and SCCE in desquamation. 21st IFSCC Congress 2000:16–25.
39.Igarashi S, Takizawa T, Yasuda Y, et al. Cathepsin D, and not cathepsin E, degrades des mosomes during epidermal desquamation. Br J Dermatol 2004; 151(2):355–61.
40.Ishida-Yamamoto A, Simon M, Kishibe M, et al. Epidermal lamellar granules transport different cargoes as distinct aggregates. J Invest Dermatol 2004; 122:1145–1153.
41.Watkinson A, Harding C, Moore A, et al. Water modulation of stratum corneum chymo tryptic enzyme activity and desquamation. Arch Dermatol Res 2001; 293:470–476.
42.Komatsu N, Takata M, Otsuki N, et al. Elevated stratum corneum hydrolytic activity in Netherton syndrome suggests an inhibitory regulation of desquamation by spink5derived peptides. J Invest Dermatol 2002; 118:436–443.
43.Franzke CW, Baici A, Bartels J, et al. Antileukoprotease inhibits stratum corneum chymotryptic enzyme. J Biol Chem 1996; 271:21886–21890.
44.Brattsand M, Stefansson K, Lundh C, et al. A proteolytic cascade of kallikreins in the stratum corneum. J Invest Dermatol 2005; 124:198–203.
45.Watkinson A, Harding CR, Rawlings AV. The cornified envelope: its role on stratum corneum structure and maturation. In: Leyden JJ, Rawlings AV, eds. Skin Moisturization. New York: Marcel Dekker, 2002:95–117.
46.Candi E, Tarcsa E, Idler WW, et al. Transglutaminase cross-linking properties of the small proline rich 1 family of cornified envelope proteins. J Biol Chem 1999; 274:7226–7237.
47.KimIG,GormanJJ,ParkSC,etal.Thededucedsequenceofthenovelprotransglutaminase- E (TGase 3) of human and mouse. J Biol Chem 1993; 268:12682–12690.
48.Nemes Z, Marekov LN, Steinert PM. Involucrin cross-linking by transglutaminase 1. J Biol Chem 1999; 274:11013–11021.
49.Cabral A, Voskamp P, Cleton-Jansen M, et al. Structural organisation and regulation of the small proline rich family of cornified envelope precursors suggest a role in adaptive barrier function. J Biol Chem 2001; 276:19231–19237.
50.Mils V, Vincent C, Croute F, et al. The expression of desmosomal and corneodesmosomal antigens shows specific variations during the terminal differentiation of epidermis and hair follicle epithelia. J Histochem Cytochem 1992; 40:1329–1337.
51.Harding CR, Long S, Richardson J, et al. The cornified cell envelope: an important marker of stratum corneum maturation in healthy and dry skin. Int J Cosmet Sci 2003; 25:1–11.
52.Hirao T, Denda M, Takahashi M. Identification of immature cornified envelopes in the barrier-impaired epidermis by characterization of their hydrophobicity and antigenicities of the components. Exp Dermatol 2001; 10:35–44.
53.Kashibuchi N, Hirai Y, O’Goshi K, et al. Three-dimensional analyses of individual corneocytes with atomic force microscope: morphological changes related to age, location and to the pathologic skin conditions. Skin Res Technol 2002; 8:203–211.
54.Jokura Y, Ishikawa S, Tokuda H, et al. Molecular analysis of elastic properties of the stratum corneum by solid-state C13-nuclear magnetic resonance spectroscopy, J Invest Dermatol 1995; 104:806–812.
55.Mechin MC, Enji M, Nachat R, et al. The peptidylarginine deiminases expressed in human epidermis differ in their substrate specificities and subcellular locations. CMLS D01 2005:1–12; 62(17):1984–95.
56.Sakai S, Yasuda R, Sayo T, et al. Hyaluronan exists in the normal stratum corneum. J Invest Dermatol 2000; 114:1184–1187.
57.Fluhr JW, Mao-Qiang M, Brown BE, et al. Glycerol regulates stratum corneum hydration in sebaceous gland deficient (Asebia) mice. J Invest Dermatol 2003; 120:728–737.
58.Choi EH, Man MQ, Wang F, et al. Is endogenous glycerol a determinant of stratum corneum hydration in humans. J Invest Dermatol 2005; 124:1–6.

368 |
Rawlings and Matts |
59.Nakagawa N, Sakai S, Matsumoto M, et al. Relationship between NMF (potassium and lactate) content and the physical properties of the stratum corneum in healthy subjects, J Invest Dermatol 2004; 122:755–763.
60.Fluhr JW, Kao J, Jain M, et al. Generation of free fatty acids from phospholipids regulates stratum corneum acidification and integrity. J Invest Dermatol 2001; 117:44–51.
61.Krien PM, Kermici M. Evidence for the existence of a self-regulated enzymatic process within the human stratum corneum—an unexpected role for urocanic acid. J Invest Dermatol 2000; 115:414–420.
62.Caspers PJ, Lucassen GW, Carter EA, et al. In vivo confocal raman microspectroscopy of the skin: non-invasive determination of molecular concentration profiles. J Invest Dermatol 2001; 116:434–442.
63.Rogers J, Harding CR, Mayo A, et al. Stratum corneum lipids: the effect of ageing and the seasons. Arch Dermatol Res 1996; 288:765–770.
64.Meldrum H, et al. The characteristic decrease in scalp stratum corneum lipids in dandruff is reversed by use of a ZnPTO containing shampoo. IFSCC Mag 2003; 6(1):3–6.
65.Declercq L, Muizzuddin N, Hellemans L, et al. Adaptation response in human skin barrier to a hot and dry environment. J Invest Dermatol 2002; 119:716.
66.Denda M, Sato J, MasudaY, et al. Exposure to a dry environment enhances epidermal permeability barrier function. J Invest Dermatol 1998; 111:858–863.
67.Sato J, Denda M, Chang S, et al. Abrupt decreases in environmental humidity induce abnormalities in permeability barrier homeostasis. J Invest Dermatol 2002; 119:900–904.
68.Chou TC, Lin KH, Wang SM, et al. Transepidermal water loss and skin capacitance alte- rations among workers in an ultra-low humidity environment. Arch Dermatol Res 2005; 296:489–495.
69.Katagiri C, Sato J, Nomura J, et al. Changes in environmental humidity affect the waterholding capacity of the stratum corneum and its free amino acid content, and the expression of filaggrin in the epidermis of hairless mice. J Dermatol Sci 2003; 31:29–35.
70.Denda M, Sato J, Tsuchiya T, et al. Low humidity stimulates epidermal DNAsynthesis and amplifies the hyperproliferative response to barrier disruption: Implication for seasonal exacerbation of inflammatory dermatoses. J. Invest Dermatol 1988; 111:873–878.
71.Ashida Y, Ogo M, Denda M. Epidermal interleukin-1 generation is amplified at low humidity: implications for the pathogenesis of inflammatory dermatoses. Br J Dermatol 2001; 144:238–243.
72.Ashida Y, Denda M. Dry environment increases mast cell number and histamine content in dermis in hairless mice. Br J Dermatol 2003; 149:240–247.
73.Simon M, Bernard D, Minondo AM, et al. Persistence of both peripheral and nonperipheral corneodesmosomes in the upper stratum corneum of winter xerosis skin versus only peripheral in normal skin. J Invest Dermatol 2001; 116:23–30.
74.Long S, Banks J, Watkinson A, et al. Desmocollins: a key marker for desmosome processing in stratum corneum. J Invest Dermatol 1996; 106:872.
75.Van Overloop L, Declercq L, Maes D. Visual scaling of human skin correlates to decreased ceramide levels and decreased stratum corneum protease activity. J Invest Dermatol 2001; 117:811.
76.Kawai E, Kohno Y, Ogawa K, et al. Can inorganic powders provide any biological benefit in stratum corneum while residing on the skin surface. IFSCC Congress, Edinburgh, 2002, 10.
77.Fulmer AW, Kramer GJ. Stratum corneum lipid abnormalities in surfactant-induced scaly skin. J Invest Dermatol 1986; 86:598–602.
78.Saint-Leger D, Francois AM, Leveque JL, et al. Stratum corneum lipids in skin xerosis. Dermatologica 1989; 178:151–155.
79.Chopart M, Castiel-Higounenc C, Arbey E, et al. Quantitative analysis of ceramides in stratum corneum of normal and dry skin. Stratum Corneum 2001; III (poster).
80.Imokawa G. Ceramides as natural moisturizing factors and their efficacy in dry skin. In: Leyden JJ, Rawlings AV, eds. Skin Moisturization. New York: Marcel Dekker, 2002:267–302.
81.Schreiner V, Gooris GS, Pfeiffer S, et al. Barrier characteristics of different human skin types investigated with x-ray diffraction, lipid analysis and electron microscopy imaging. J Invest Dermatol 2000; 114:654–660.
82.Tezuka T. Electron-microscopic changes in xerosis senilis epidermis. Its abnormal membrane-coating granule formation. Dermatologica 1983; 166:57–61.

Dry Skin and Moisturizers |
369 |
83.Matts PJ, Goodyer E. A new instrument to measure the mechanical properties of human skin in vivo. J Cosmet Sci 1998; 49:321–333.
84.Matts PJ. Hardware and measurement principles: the gas-bearing electrodynamometer and linear skin rheometer. In: Elsner P, Beradesca E, Wilhem KP, et al, eds. Bioengineering of the Skin: Skin Biomechanics. Boca Raton, Fla: CRC Press, 2002; 335–48.
85.Cooper ER, Missel PJ, Hannon DP, et al. Mechanical properties of dry, normal and glycerol-treated skin as measured by the gas-bearing electrodynamometer. J Cosmet Sci 1985; 36:335–348.
86.Christensen MS, Hargens CW, Nacht S, et al. Viscoelastic properties of intact human skin: instrumentation, hydration effects, and the contribution of the stratum corneum. J Invest Dermatol 1977; 69(3):282–286.
87.Denda M, Wood LC, Emami S, et al. The epidermal hyperplasia associated with repeated barrier disruption by acetone treatment or tape stripping cannot be attributed to increased water loss. Arch Dermatol Res 1996; 288(5–6):230–238.
88.Kikuchi K, Kobayashi H, Hirao T, et al. Improvement of mild inflammatory changes of the facial skin induced by winter environment with daily applications of a moisturizing cream. A half-side test of biophysical skin parameters, cytokine expression pattern and the formation of cornified envelope. Dermatology 2003; 207(3):269–275.
89.Terui T, Hirao T, Sato Y, et al. An increased ratio of interleukin-1 receptor antagonist to interleukin-1 in inflammatory skin diseases, Exp Dermatol 1998; 7:327–334.
90.Proksch E, Jensen J, Elias PM. Skin lipids and epidermal differentiation in atopic dermatitis. Clinics in Dermatology 2003; 21:134–144.
91.Proksch E, Feingold KR, Man MQ, et al. Barrier function regulates epidermal DNA synthesis. J Clin Invest 1991; 87(5):1668–1673.
92.Angel P, Szabowski A. Function of AP-1 target genes in mesenchymal-epithelial crosstalk in skin. Biochem Pharmacol 2002; 64(5–6):949–956.
93.Rawlings AV, Canestrari DA, Dobkowski B. Moisturizer technology versus clinical performance. Dermatol Ther 2004; 17:49–56.
94.Mattai J, Froebe CL, Rhein LD, et al. Prevention of model stratum corneum lipid phase transitions in vitro by cosmetic additives. J Soc Cosmet Chem 1993; 44:89–100.
95.Rawlings AV, Watkinson A, Hope J, et al. The effect of glycerol and humidity on desmosome degradation in stratum corneum. Arch Dermatol Res 1995; 287:457–464.
96.Hirao T, Takahashi M, Kikuchi K, et al. A novel non-invasive evaluation method of cornified envelope maturation in the stratum corneum provides new insight for skincare cosmetics. IFSCC Congress, Edinburgh 2002, 51.
97.Fluhr JW, Gloor M, Lehmann L, et al. Glycerol accelerates recovery of barrier function in vivo. Acta Derm Venereol 1999; 79:418–421.
98.Rattner H. Dermatologic uses of urea. Acta Derm Venereol 1943; 37:155–165.
99.Fredrikkson T, Gip L. Urea creams in the treatment of dry skin and hand dermatitis. Int J Dermatol 1990; 14:442–444.
100.McCallion R, Po AL. Modelling TEWL under steady state conditions and relative humidities. Int J Pharmaceut 1994; 105:103–112.
101.Loden M. Urea containing moisturisers influence barrier properties of normal skin. Arch Dermatol Res 1996; 288:103–107.
102. Pigatto PD, Bigardi AS, Cannistraci C, et al. 10% urea cream for atopic dermatitis J Dermatol Treat. 1996; 7:171–175.
103.Scott IR, Harding CR. A filaggrin analogue to increase natural moisturising factor synthesis in skin. Dermatology 2000, 1993:773.
104.Kwoyo Hakko Kogyo. Pyrrolidone carboxylic acid esters compositions to prevent loss of moisture from the skin. Patent JA 4882046, 1982.
105.Org Santerre. Pyrrolidone carboxylic acid sugar compounds as rehydrating ingredients in cosmetics. Patent FR 2277823, 1977.
106.Clar EJ, Foutanier A. L’acide pyrrolidone carboxylique et la peau. Int J Cosmet Sci 1981; 3:101–113.
107.Middelton JD, Roberts ME. Effects of a skin cream containing the sodium salts of pyrroli- done carboxylic acid on dry and flaky skin. J Soc Cosmet Chem 1978; 29:201–205.
108.Ghadially R, Halkiersorenson L, Elias PM. Effects of petrolatum on stratum corneum structure and function. J Am Acad Dermatol 1992; 26:387–396.

370 |
Rawlings and Matts |
109.Barany E, Lindberg M, Loden M. Unexpected skin barrier influence from non-ionic emulsifiers. Int J Pharmaceut 2000; 195:189–195.
110.Kucharekova M, Schalkwijk J,Van De Kerkhof PC, et al. Effect of a lipid-rich emollient. Contact Dermatitis 2002; 46:331–338.
111.De Paepe K, Roseeuw D, Rogiers V. Repair of acetoneand sodium lauryl sulphate– damaged human skin barrier function using topically applied emulsions containing barrier lipids. JEADV 2002; 16:587–594.
112.Berardesca E, Barbareschi M, Veraldi S, et al. Evaluation of efficacy of a skin lipid mixture in patients with irritant contact dermatitis, allergic contact dermatitis or atopic dermatitis: a multicenter study. Contact Dermatitis 2001; 45:280–285.
113.Chamlin SL, Kao J, Frieden IJ, et al. Ceramide-dominant barrier repair lipids alleviate childhood atopic dermatitis: changes in barrier function provide a sensitive indicator of disease activity. J Am Acad Dermatol 2002; 47:198–4208.
114.Wollenweber U, Korevaar K, Rawlings AV, et al. Application of a skin-identical lipid concentrate for enhanced skin moisturization and protection. SOFW J 2004; 130:9.
115.Summers RS, Summers B, Chandar P, et al. The effect of lipids with and without humectant on skin xerosis. J Soc Cosmet Chem 1996; 47:27–39.
116.Leveque JL, Saint-Leger D. Salicylic acid and derivatives. In: Leyden JJ, Rawlings AV, eds. Skin Moisturization. New York: Marcel Dekker, 2002:353–364.
117.Fartasch M, Teal J, Menon GK. Mode of action of glycolic acid on human stratum corneum: ultrastructural and functional evaluation of the epidermal barrier. Arch Dermatol Res 1997; 289:404–409.
118.Bowser P, Evenson A, Rawlings AV. Cosmetic composition containing a lipid and a hydroxyl or ketocarboxylic acid. EP0587288B1.
119.Rawlings AV, Davies A, Carlomusto M, et al. Effect of lactic acid isomers on keratinocyte ceramide synthesis, stratum corneum lipid levels and stratum corneum barrier function. Arch Dermatol Res 1996; 288:383–390.
120.Rawlings AV, Hope J, Ackerman C, et al. Hydroxycaprylic acid improves stratum corneum extensibility at low relative humidity and protects desmosomes against mechanical damage. IFSCC Congress, Yokohama, 1992:1.
121.Wehr R, Krochmal L, Bagatell F, Ragsdale WA. Controlled two center study of lactate 12% lotion and a petrolatum-based cream in patients with xerosis. Cutis 1986; 23:205.
122.Johnson AW. Hydroxyacids. In: Leyden JJ, Rawlings AV, eds. Skin Moisturization. New York: Marcel Dekker, 2002:323–352.
123.Berardesca E, Distante F, Vignoli GP, et al. Alpha hydroxy acids modulate stratum corneum barrier function. Br J Dermatol 1997; 137:934–938.
124.Hanley K, Jiang Y, He SS, et al. Keratinocyte differentiation is stimulated by activators of the nuclear receptor PPAR alpha. J Invest Dermatol 1998; 110:368–375.
125.Westergaard M, Henningsen J, Svendsen ML, et al. Modulators of keratinocyte gene expression and differentiation by PPAR selective ligand tetradecylthioacetic acid. J Invest Dermatol 2001; 116:702–712.
126.River M, Castiel I, Safonova I, et al. Peroxisome proliferator-activated receptor-alpha enhances lipid metabolism in a skin equivalent model. J Invest Dermatol 2000; 114:691– 687.
127.Alaluf S, Barrett KE, Green MR, et al. A cosmetic composition for treating aged wrinkled skin through topical application of a composition containing petroselenic acid. US6042841.
128.Alaluf S, Rawlings AV. A topical composition comprising from petroselenic acid and conjugated linoleic acid. US6423325.
129.Lee R, Paterson S, Marti V, et al. Peroxisome proliferator activated receptor alpha activators: petroselenic acid as a novel skin benefit agent for antiperspirants. IFSCC Congress, Edinburgh, 2002:11.
130.Wiechers JW, Rawlings AV, Garcia C, et al. A new mechanism of action for skin whitening agents: binding to the peroxisome proliferator activated receptor. Int J Cosmet Sci 2005; 27:123–132.
131.Harding CR, Rawlings AV. Effects of NMF and lactic acid isomers on skin function. In: Loden M, Maibach HI, eds. Dry skin and moisturizers, 2006: 187–210.

Dry Skin and Moisturizers |
371 |
132.Mao-Qiang M, Feingold KR, Elias PM. Exogenous lipids influence permeability barrier function. Arch Dermatol 1993; 129:729–738.
133.Chamlin SL, Frieden IJ, Fowler A, et al. Optimization of physiological lipid mixtures for barrier repair. J Invest Dermatol 1996; 106:1096–1101.
134.Haratake A, Ikenaga K, Katoh N, et al. Topical mevalonic acid stimulates de novo cholesterol biosynthesis and epidermal permeability barrier homeostasis in aged mice. J Invest Dermatol 2000; 114:247–252.
135.Rawlings AV, Davies A, Carlomusto M, et al. Effect of lactic acid isomers on keratinocyte ceramide synthesis, stratum corneum lipid levels and stratum corneum barrier function. Arch Dermatol Res 1996; 288:383–390.
136.Matts PJ, Oblong JE, Bissett DL. A review of the range of effects of niacinamide in human skin. IFSCC Mag 2002; 5:285–290.
137.Tanno O, Ota Y, Hikima R, et al. An increase in endogenous epidermal lipids improves skin barrier function. IFSCC International Congress 2000, 347–358.
138.Ertel KD, Berge CA, Mercurio MG, et al. New facial moistuizer technology increase exfoliation without compromising barrier function. 58th Annual Meeting of the American Academy of Dermatology, San Francisco 2000.
139.Draelos ZD, Ertel E, Berge C, et al. A facial moisturizing product as an adjunct in the treatment of rosacea. 59th Annual Meeting of the American Academy of Dermatology, San Francisco 2001.
140.Davies A, Verdejo P, Feinberg C, et al. Increased stratum corneum ceramide levels and improved barrier function following treatment with tetraacetylphytosphingosine. J Invest Dermatol 1996; 106:918.
141.Conti A, Rogers P, Verdejo P, et al. Seasonal influences on stratum corneum ceramide 1 fatty acids and the influence of topical essential fatty acids. Int J Cosmet Sci 1996; 18:1–12.
142.Msika P, Piccirilli A, Chesne C. Effects of two specific lipidic ingredients on the synthesis of epidermal lipids in human skin explants in culture. IFSCC Congress, Berlin, 2000:1–5.
143.Denda M. New stategies to improve skin barrier homeostasis. Adv Drug Del Rev 2002; 54:123–130.
144.Zhang K, Kosturko K, Rawlings AV. The effect of thiols on epidermal lipid biosynthesis. J Invest Dermatol 1995; 104:687.
145.Uchida Y, Behne M, Quice D, et al. Vitamin C stimulates sphingolipid production and markers of barrier formation in submerged human keratinocyte cultures. J Invest Dermatol 2001; 117:1307–1313.
146.Yarosh DB, Both D, Brown D. Liposomal ursolic acid (merotaine) increases ceramides and collagen in human skin. Horm Res 2000; 54:318–321.
147.Matts PJ, Gray J, Rawlings AV. The “dry skin cycle”—a new model of dry skin and mechanisms for intervention. The Royal Society of Medicine Press Ltd, International Congress and Symposium Series 2005; 256:1–38.
148.Sieg A, Crowther J, Blenkiron P, et el. Confocal Raman microspectroscopy: measuring the effects of topical moisturizers on stratum corneum water gradients in vivo. Proc SPIE. 2006; 6093:1–7.


Antioxidants in the Skin: Dermatological and Cosmeceutical Aspects |
375 |
Figure 2 Scheme of the experimental setup: (1): Ar+ multiline laser, (2), (5): optical fibers, (3): optical imaging system, (4): measuring object (skin), (6): spectrograph, (7): CCD camera, (8): personal computer, and (9): detector measuring back-reflected light from the skin.
absorbs at 425, 450, and 478 nm, whereas lycopene has 11 conjugated double bonds, is red, and absorbs at 446, 472, and 503 nm (8).
The majority of the detectable carotenoids in the human organism have nine conjugated carbon double bonds in their structure; thus, they have approximately the same absorption values in the blue range of spectra, with the exception of phy- toene and phytofluene, which absorb in the UV range of the spectra. Consequently, lycopene is distinguished from other carotenoids in the direction of absorption at the longer wavelengths. Beta-carotene and lycopene represent the largest group, making up approximately 70% of the carotenoids in the human skin (6). Absorp- tion spectra of carotenoid substances beta-carotene and lycopene are presented in Figure 1.
Carotenoids are active Raman molecules, which mean that a small amount of light is scattered with the change of wavelength (Raman shift) induced by a reso- nance laser excitation wavelength. The utilization of specially developed filters, an optical analysis system as well as a software, allows the measurement of the inten- sity of the Raman bands which originate from the carotenoids. The experimental arrangement for the Raman measurements of carotenoids is shown in Figure 2.
The irradiation of an Ar+ multiline laser is transferred, filtered, and focused onto the skin. The Raman signal from the skin is collected by a lens system and transferred into a fiber bundle to a spectrograph. The spectrum is recorded by a
CCD camera and visualized on a personal computer. The usage of the specially de- veloped software allows the intensity of the Raman signal to be measured without being influenced by the fluorescence background.
The three Raman bands can be detected on the large fluorescence background, which is caused by collagen, porphyrins, elastin, and other substances of the skin and not by carotenoids (Figs. 3A, B).
The Raman bands at 1523, 1156, and 1005 cm–1 originate, respectively, from the carbon–carbon double bond, from carbon–carbon single-bond stretching vibrations of the conjugated backbone, and from the rocking motions of the methyl groups of the carotenoid molecules. The strong 1523 cm–1 carbon–carbon double-bond stretching vibration Raman line is used for the determination of the concentration of carotenoids in the human skin.
At present, there are three different methods for the in vivo determination of carotenoids in the skin, based on the resonance Raman spectroscopy:
1.Measurement of a total concentration of carotenoids in the skin without sepa- ration. This method is based on the utilization of one excitation wavelength in the blue optical range of spectra (e.g., 488 nm of an Ar+ laser). This wavelength excites all carotenoids, whose absorption spectrum lies in the blue–green optical
376 |
Darvin and Lademann |
Figure 3 Typical Raman spectrum obtained from human skin under an excitation wavelength at 488 nm (A) and the skin Raman spectrum after subtraction of fluorescence background (B).
range of spectra (Fig. 1), simultaneously. As a result, the total level of carotenoids may be detected.
2.Separate measurements of beta-carotene and lycopene concentrations in the skin. This method is based on the utilization of two different excitation wavelengths in the blue and in the green optical range of spectra (e.g., 488 and 514.5 nm of an Ar+ laser). As shown in Figure 1, beta-carotene and lyco- pene have approximately the same absorption values at 488 nm but different absorption values at 514.5 nm. As a result, the scattered resonance Raman lines, originating from beta-carotene and lycopene, will reflect the same ten- dency. These differences are used for the separate detection of carotenoids beta-carotene and lycopene in the human skin using two different excitation wavelengths (12,16).
3.Measurement of the antioxidant lycopene in the human skin with the use of one excitation wavelength in the green optical range of spectra (preferably

Antioxidants in the Skin: Dermatological and Cosmeceutical Aspects |
377 |
around 514.5 nm). Using the green excitation wavelength at 514.5 nm, strong excitation of lycopene occurs. Other carotenoids are also excited, but they are in the dip of the absorption curve at 514.5 nm (Fig. 1) and, as a result, their contribution is small compared with lycopene. Moreover, the absence of re- absorption at 558 nm (the corresponding wavelength of the 1523 cm–1 Raman shift under excitation at 514.5 nm) makes Raman measurements independent from the influence of other carotenoids, which are present in the skin (13).
Distribution of carotenoids in the skin and their kinetics
Darvin et al. (12) investigated the distribution of the carotenoids at different body sites (inner palm, forehead, flexor forearm, and back) of healthy volunteers by Ra- man spectroscopy. They found that beta-carotene and lycopene distribution in the human skin strongly depended on the skin region and that there were drastic inter- individual differences, reflecting the lifestyle of the volunteers. The beta-carotene and lycopene concentrations in the skin were lower in smokers than in nonsmokers and higher in vegetarian groups (12).
The highest concentration of carotenoids was found on the forehead and the palm, which corresponded to the body sites with the highest density of sweat glands (18). Therefore, it seems that the lipophilic carotenoids are delivered with the sweat to the skin surface. This hypothesis is supported by the observation of
Ekanayake-Mudiyanselage (19) that lipophilic vitamin E is transported by the sweat to the skin surface.
The daily concentration of carotenoids in the skin of volunteers was investi- gated over several months using Raman spectroscopy (20). The results showed the individual variations in the level of carotenoids in the skin of the volunteers, which strongly correlated with the specific lifestyle conditions such as dietary supplemen- tation rich in carotenoids and the influence of possible stress factors. Carotenoid- rich diets, based on high amounts of fruits and vegetables that have high levels of carotenoids, apparently increase the measured carotenoid antioxidant level of the skin. On the other hand, the carotenoid level in the skin of the volunteers was decreased subsequent to stress factors, such as exhaustion, illness, smoking, and alcohol consumption. This decrease occurred relatively quickly, over 24 hours, whereas the corresponding increase lasted up to three days (20).
During the summer and autumn, an increase in the average level of carotenoids in the skin was measured in all volunteers. The seasonal variation can be explained by an increased consumption of fruits and vegetables, rich in carotenoids, during summer and autumn months. The average seasonal increase of the carot- enoid content in the skin was 1.3-fold (20).
Potential Methods of Increasing the Carotenoid Level in the Skin
The human organism can obtain most of the antioxidant substances including carotenoids only through fruits and vegetables, which naturally contain a high amount of different carotenoids. It was shown that a one-time supplementation with a high dosage of foodstuffs containing high amount of carotenoids increased the level of the carotenoids in the skin. The increase in the carotenoid level could usually be observed the next day after the supplementation (21,22). The studies demonstrated that the antioxidants that were taken up from food partly accumulated in the skin and were stored there, thereby increasing the antioxidative potential of the skin.

378 |
Darvin and Lademann |
Antioxidants protect the skin against aging
During the Raman spectroscopic investigation of carotenoids in the human skin, it was observed that volunteers with a higher concentration of antioxidants had a younger looking skin with regard to furrows and wrinkles (20). To quantify this observation, a study was performed whereby the skin surface structure (depth and density of furrows and wrinkles) was compared with the skin concentration of betacarotene and lycopene. The investigation was carried out on volunteers aged be- tween 40 and 50 years, who had not significantly changed their lifestyle during the last three decades. No correlation (R² = 0.009) was found between the skin surface structure (roughness) and the age of the volunteers, whereas a strong correlation (R² = 0.79) was obtained for the relation between the skin concentration of lycopene and the skin roughness (20). The results demonstrate that a correlation between the appearance of the skin, in particular with regard to furrows and wrinkles, and the level of carotenoids in the skin evidently exists.
Supplementation with fruits and vegetables reduced the formation and development of furrows and wrinkles on the skin with age. In this case, the skin looks younger. The results presented in the study were obtained from healthy volunteers. The lycopene concentration in the skin had originated from their habitual diet and not from special food additives or cosmetic products. It will be a topic of further research to investigate whether similar results can be obtained by food supplements or topically applied antioxidant substances.
Influence of irradiation on carotenoid concentrations in the skin
UV Irradiation
It is well known that high doses of UV irradiation are harmful to living skin (1). Under exposure to UV light, skin sensitizer molecules, such as melanin, flavin, por- phyrin, and others, are excited from their singlet ground state to an intermediate singlet excited state. From this state, the excess energy of these molecules is relaxed nonradioactively to an excited triplet state. The excited sensitizer molecule in the triplet state easily interacts with oxygen in the ground triplet state, which is contained in the skin. As a result of this reaction, excited singlet oxygen is produced, and the sensitizer molecule is returned to the ground state. More than 99% of the re- action between the triplet sensitizer and triplet oxygen gives rise to the production of singlet oxygen radicals (23). Singlet oxygen possesses a high oxidative activity and serves as a free radical.
If the number of radicals formed in the tissue is significantly increased, the defense mechanism of the body is not able to neutralize all the reactive molecules (24). In this case, chain reactions are initiated, which again high amounts of free radicals form and oxidative stress occurs. The free radicals that are produced sub- sequent to UV irradiation give rise to the inflammation processes and the formation of erythema. The systematic irradiation of the skin with UV irradiation can lead to the formation of skin cancer (25).
Free radicals immediately react with the surroundings, oxidizing the DNA, lipids, and proteins of living cells (2,3). This gives rise to irreversible changes and conformations on the cellular level and disorganization between the cells. The accumulation of such harmful changes results in preliminary aging that can be seen by the dryness and deepening and the expansion of furrows and wrinkles of the skin.

Antioxidants in the Skin: Dermatological and Cosmeceutical Aspects |
379 |
(A)
|
Figure 4 Kinetics of the skin’s |
|
beta-carotene (A) and lycopene |
|
(B) concentrations after UV irra- |
(B) |
diation of the skin. |
Using Raman spectroscopy, the kinetics of the concentration of carotenoids in the human skin subsequent to irradiation with UV light was investigated in vivo. The irradiation was carried out using an erythema tester (Dr. Höhle Meβtechnik GmbH, Germany) as a source of UVB irradiation. The skin of the forearm of healthy volunteers was irradiated with a UVB dose of 30 mJ/cm², which was sufficient for the formation of a light erythema. An example of the reaction of the beta-carotene
(A) and lycopene (B) concentrations to the UV irradiation dose is shown in Figure 4. Both carotenoids showed different kinetics. Lycopene degraded relatively quickly (<30 minutes) after UV irradiation, whereas the response time of the beta-carotene concentration varied from 30 to 90 minutes. The differences in the response time

380 |
Darvin and Lademann |
of beta-carotene and lycopene can be explained by the different quenching rates concerning the neutralization of free radicals. This quenching rate is higher for ly- copene than for beta-carotene (26). No differences were found between the response time and the individual level of the carotenoids in the skin. On the other hand, the experiments demonstrated that the magnitude of degradation was dependent on the individual antioxidant level of the volunteers.
The strong correlation can be explained by the production of the same amount of free radicals after UV exposure of the skin because volunteers had received the same dose of irradiation. As a result, the quantity of produced radicals will be approximately the same for all volunteers. It can be expected that the same amount of carotenoids will be destroyed. In this case, the volunteers with low levels of carotenoids showed a higher magnitude of destruction, which was observed in the experiments.
Infrared Irradiation
In an analogy to UV irradiation experiments, the influence of infrared (IR) irradia- tion on the skin was investigated (27). IR irradiation is widely used in medicine for accelerating wound healing processes (28) and for warming muscles, whereby blood and lymph flow is increased and the rate of metabolism and recovery increased.
IR irradiation of living skin leads to a decrease in the concentration of the carotenoids, beta-carotene and lycopene, in the irradiated area (27). The power den- sity of the IR irradiation on the skin was 190 mW/cm2. The time of irradiation was 30 minutes. The average magnitude of reduction was 27% for beta-carotene and 38% for lycopene.
The temperature of the skin surface increased to 41 ± 1°C after IR irradiation of the skin. Taking into consideration the relative temperature stability of carotenoids, at least up to 50°C, and the absence of absorption in the IR range of spectra, the most likely outcome of the reduced levels of carotenoids subsequent to IR irradiation is the reduction of neutralization of free radicals, which can be produced in the skin by IR irradiation. There was a strong correlation between the individual level of betacarotene and lycopene in the skin of volunteers and the magnitude of destruction of carotenoids (27).
Under the IR irradiation of the skin, carotenoids beta-carotene and lycopene start to decrease almost immediately, with a small time delay of about 10 minutes for beta-carotene. The differences in the response time for UV and IR can be ex- plained by the essential differences in the power densities of UV and IR irradiations (0.3 mW/cm2 for UV irradiation and 190 mW/cm2 for IR irradiation) as well as expo- sure times (100 seconds and 30 minutes correspondingly).
The recovery time of carotenoid levels in the skin after the influence of stress from factors such as irradiation depends on the carotenoid stock in the adipose tissue and on nutrition. There are three main pathways for the transport of carotenoids to the skin: by blood flow, from adipose tissue with the aid of diffusion, and via sweat.
APPLICATION STRATEGIES OF ANTIOXIDANT SUBSTANCES
The application of antioxidant substances systemically and topically for medical treatment and the prophylaxis of many diseases and the added protection of skin against the destructive action of free radicals and other reactive species have become very popular over the past few years. The available literature is very extensive, and the re-

Antioxidants in the Skin: Dermatological and Cosmeceutical Aspects |
381 |
sults published are often contradictory. Nevertheless, there are some clear tendencies concerning the systemic and topical application of antioxidant substances in medicine and cosmetics (29). Stimulated by the positive results of a fruits and vegetables diet in the support of medical treatment and cosmetology, synthetic and natural antioxidant substances have been broadly applied (15,30–32). Surprisingly, not only positive but also strongly negative results have been obtained by different authors (33–39).
According to study reports, synthetic and natural antioxidant substances sup- port various types of medical therapies if they are applied in mixtures of different compounds at low concentrations (35,36,40–42). In the case of application of a high concentration of some single compounds, side effects were often observed (36,42,43).
Following skin treatment with systemically delivered antioxidants, positive cosmetic effects were observed on photoprotection (44–46), stimulation of the syn- thesis of collagen, and cell proliferation (47). It has been also shown that supple- mentation of antioxidants prevents the formation of skin carcinoma (48). Almost no side effects were reported apart from a number of allergic reactions. One reason for this seems to be the lower concentration of systemically applied antioxidant substances when compared with a medical application. The topical application of antioxidants is mainly related to cosmetic treatment for skin protection and antiaging (49–52) where positive results were obtained.
All antioxidant substances act as a “protection chain,” which means that differ- ent antioxidants possess a synergic effect and protect each other from direct destruc- tion when neutralizing free radicals and other reactive species (53–55). Therefore, they act effectively only in combination with the other types of antioxidant sub- stances. This relation becomes disturbed if one component is artificially increased by supplementation. It can even happen that the antioxidants act not only as radical quenchers, but also as radical producers (56) if their concentration is higher than the critical level. In this case, antioxidants can manifest pro-oxidant activity on the organism. Furthermore, different antioxidants have different effectiveness on the neutralization of the free radicals that determine the rate and ability of individual antioxidants to interact with free radicals (57). These effects seem to depend on the concentration and on the mixture of the applied antioxidant substances.
CONCLUSIONS
Antioxidant substances protect our body from the action of highly reactive free radicals. Most of the antioxidants cannot be produced in sufficient amounts endog- enously. Therefore, they have to be provided by the diet. The content of antioxidants in the human skin can be increased by eating different fruits and vegetables. The use of food supplements also leads to an increase in skin antioxidants.
Noninvasive online Raman spectroscopic measurements of antioxidant con- centration in the human skin are an efficient means to analyze the influence of food supplementation and stress factors on the antioxidant potential of the skin. A com- parison between electron spin resonance spectroscopy (58,59) and Raman spectros- copy demonstrated that antioxidants can be used as markers for the analysis of the antioxidant defense system within the skin. The antioxidant substances in the organism form protection chains (53–55), in which they protect each other from the damage caused by the action of free radicals. Thus, the systemic application of mixtures of antioxidant substances by foods and vegetables or by mixtures of antioxidant extracts seems to be very efficient in protecting our body in comparison with the application of single compounds. There is a critical concentration where

382 |
Darvin and Lademann |
antioxidants can obtain pro-oxidative properties. It seems that this critical value depends on several factors such as the concentration and composition of the antioxidants in the mixture.
Because of the increased application of noninvasive optical and spectroscopic diagnostic methods for the analysis of antioxidants, an increase in knowledge concerning the action and optimal concentration of antioxidants in the skin can be expected.
REFERENCES
1.Biesalski HK, Hemmes C, Hopfenmuller W, et al. Effects of controlled exposure of sunlight on plasma and skin levels of beta-carotene. Free Radic Res 1996; 24: 215–224.
2.Dumay O, Karam A, Vian L, et al. Ultraviolet AI exposure of human skin results in Lang- erhans cell depletion and reduction of epidermal antigen-presenting cell function: partial protection by a broad-spectrum sunscreen. Br J Dermatol 2001; 144: 1161–1168.
3.Flora SJ. Role of free radicals and antioxidants in health and disease. Cell Mol Biol 2007;
53:1–2.
4.Young AR, Sheehan JM, Chadwick CA, Potten CS. Protection by ultraviolet A and B sun- screens against in situ dipyrimidine photolesions in human epidermis is comparable to protection against sunburn. J Invest Dermatol 2000; 115:37–41.
5.Taylor CR, Sober AJ. Sun exposure and skin disease. Annu Rev Med 1996, 47, 181–191.
6.Hata TR, Scholz TA, Ermakov IV, et al. Non-invasive Raman spectroscopic detection of carotenoids in human skin. J Invest Dermatol 2000; 115:441–448.
7.Darvin ME, Gersonde I, Ey S, et al. Non-invasive detection of beta-carotene and lycopene in human skin using Raman spectroscopy. Laser Phys 2004; 14:231–233.
8.Guggenbuhl N. Les antioxydants a la source. Bull Soc Belge Ophtalmol 2006; 301:41–5.
9.Shao A, Hathcock JN. Risk assessment for the carotenoids lutein and lycopene. Regul Toxicol Pharmacol 2006; 45:289–98.
10.Talwar D, Ha Tom KK, Cooney J, et al. A routine method for the simultaneous measure- ment of retinal, α-tocopherol and five carotenoids in human plasma by reverse phase HPLC. Clin Chim Acta 1998; 270:85–100.
11.Stahl W, Heinrich U, Jungmann H, et al. Increased dermal carotenoid level assessed by non-invasive reflection spectrophotometry correlate with serum levels in women ingest- ing betatene. J Nutr 1998; 128:903–907.
12.Darvin ME, Gersonde I, Meinke M, et al. Non-invasive in vivo determination of the carotenoids beta-carotene and lycopene concentrations in the human skin using the
Raman spectroscopic method. J Phys D Appl Phys 2005; 38:1–5.
13.Darvin ME, Gersonde I, Meinke M, et al. Non-invasive in vivo detection of the carotenoid antioxidant substance lycopene in the human skin using the resonance Raman spec troscopy. Laser Phys Lett 2006; 3:460–463.
14.Walfisch Y, Walfisch S, Agbaria R, et al. Lycopene in serum, skin and adipose tissues after tomato-oleoresin supplementation in patients undergoing haemorrhoidectomy or peri- anal fistulotomy. Br J Nutr 2003; 90:759–766.
15.Khachik F, Carvalho L, Bernstein PS, et al. Chemistry, distribution, and metabolism of tomato carotenoids and their impact on human health. Exp Biol Med 2002; 227:845–851.
16.Ermakov I, Ermakova M, Gellermann W, et al. Noninvasive selective detection of lycopene and beta-carotene in human skin using Raman spectroscopy. J Biomed Opt 2004; 9:332–338.
17.Stahl W, Sies H. Perspectives in biochemistry and biophysics. Lycopene: a biologically important carotenoid for humans? Arch Biochem Biophys 1996; 336:1–9.
18.Hadgraft J. Penetration routes through human skin. Proc 10-th EADV Congress. Skin and Environment; Perception and Protection, Munich, 2001; 463–468.
19.Ekanayake-Mudiyanselage S, Thiele JJ. Sebaceous glands as transporters of vitamin E.
Hautarzt 2006, 57, 291–296.
20.Darvin ME. Non-invasive measurements of the kinetics of the carotenoid antioxidant substances in the skin. PhD thesis, Universitätsmedizin Berlin-Charite, 2007.

Antioxidants in the Skin: Dermatological and Cosmeceutical Aspects |
383 |
21.Darvin ME, Gersonde I, Albrecht H, et al. Non-invasive in-vivo Raman spectroscopic measurement of the dynamics of the antioxidant substance lycopene in the human skin after a dietary supplementation. Proc SPIE (in press).
22.Darvin ME, Gersonde I, Albrecht H, et al. Resonance Raman spectroscopy for the detection of carotenoids in foodstuffs. Influence of the nutrition on the antioxidative potential of the skin. Laser Phys Lett 2007 (in press).
23.Min D, Boff JM. Chemistry and reaction of singlet oxygen in foods. Compr Rev Food Sci Food Safety 2002; 1:58–61.
24.Jackson MJ. An overview of methods for assessment of free radical activity in biology. Proc Nutr Soc 1999; 58:1001–1006.
25.Moon JS, Oh CH. Solar damage in skin tumors: quantification of elastotic material. Der- matology 2001; 202:289–292.
26.Darvin ME, Gersonde I, Albrecht H, et al. In-vivo Raman spectroscopic analysis of the influence of UV radiation on carotenoid antioxidant substance degradation of the human skin. Laser Phys 2006; 16:833–837.
27.Darvin ME, Gersonde I, Albrecht H, et al. In vivo Raman spectroscopic analysis of the influence of IR radiation on the carotenoid antioxidant substances beta-carotene and lycopene in the human skin. Formation of free radicals. Laser Phys Lett (in press).
28.Danno K, Mori N, Toda K, et al. Near-infrared irradiation stimulates cutaneous wound repair: laboratory experiments on possible mechanisms. Photodermatol Photoimmunol
Photomed 2001; 17:261–265.
29.Darvin M, Zastrow L, Sterry W, et al. Effect of supplemented and topically applied antioxidant substances on human tissue. Review. Skin Pharmacol Physiol 2006; 19:238–247.
30.Osganian SK, Stampfer MJ, Rimm E, et al. Dietary carotenoids and risk of coronary artery disease in women. Am J Clin Nutr 2003; 77:1390–1399.
31.Montonen J, Knekt P, Jarvinen R, et al. Dietary antioxidant intake and risk of type 2 dia- betes. Diabetes Care 2004; 27:362–366.
32.Franceschi S, Bidoli E, La Vecchia C, et al. Tomatoes and risk of digestive-tract cancers. Int J Cancer 1994; 59:181–184.
33.Biesalski HK, Obermueller-Jevic UC. UV light, beta-carotene and human skin—beneficial and potentially harmful effects. Arch Biochem Biophys 2001; 389:1–6.
34.Stahl W, Sies H. Perspectives in biochemistry and biophysics. Lycopene: a biologically important carotenoid for humans? Arch Biochem Biophys 1996; 336:1–9.
35.http://home.howstuffworks.com/ antioxidant4.htm (accessed 2002)
36.Lowe GM, Booth LA, Young AJ, et al. Lycopene and beta-carotene protect against oxidative damage in HT29 cells at low concentrations but rapidly lose this capacity at higher doses. Free Radic Res 1999; 30:141–151.
37.Pryor WA, Stahl W, Rock CL. Beta carotene: from biochemistry to clinical trials. Nutr Rev 2000; 58:39–53.
38.Lee BM, Park KK. Beneficial and adverse effects of chemopreventive agents. Mutat Res 2003; 523–524:265–278.
39.Bjelakovic G, Nikolova D, Simonetti R, et al. Antioxidant supplements for preventing gastrointestinal cancers. Cochrane Database Syst Rev 2004; 18:CD004183.
40.Cesarini JP, Michel L, Maurette JM, et al. Immediate effects of UV radiation on the skin: modification by an antioxidant complex containing carotenoids. Photodermatol Photoimmunol Photomed 2003; 19:182–189.
41.http://www.crnusa.org/benpdfs/CRN007benefits_can.pdf (accessed June 2002).
42.Eichler O, Sies H, Stahl W. Divergent optimum levels of lycopene, beta-carotene and lutein protecting against UVB irradiation in human fibroblastst. Photochem Photobiol 2002; 75:503–506.
43.Jenkins GJ, Stephens LA, Masnavi N, et al. Molecular analysis of the chemoprotective effects of topical sunscreen and vitamin C in preventing UV-induced and reactive oxy- gen species-induced DNA damage, respectively, using the PCR inhibition methodology.
Anticancer Res 2002; 22:3873–3877.
44.Heinrich U, Gärtner Ch, Wiebusch M, et al. Supplementation with β-carotene or a simi- lar amount of mixed carotenoids protects humans from UV-induced erythema. J Nutr 2003; 133:98–101.

384 |
Darvin and Lademann |
45.Greul AK, Grundmann JU, Heinrich F, et al. Photoprotection of UV-irrdiated human skin: an antioxidative combination of vitamins E and C, carotenoids, selenium and proanthocyanidins. Skin Pharmacol Appl Skin Physiol 2002; 15:307–315.
46.Stahl W, Heinrich U, Jungmann H, et al. Carotenoids and carotenoids plus vitamin E protect against ultraviolet light-induced erythema in humans. Am J Clin Nutr 2000; 71: 795–798.
47.Hata R, Senoo H. l-Ascorbic acid 2-phosphate stimulates collagen accumulation, cell proliferation, and formation of a three-dimensional tissue like substance by skin fibro blasts. J Cell Physiol 1989; 138:8–16.
48.Ponnamperuma RM, Shimizu Y, Kirchhof SM, et al. Beta-Carotene fails to act as a tumor promoter, induces RAR expression, and prevents carcinoma formation in a two-stage model of skin carcinogenesis in male Sencar mice. Nutr Cancer 2000; 37:82–88.
49.Mukhtar H, Katiyar SK, Agarwal R. Green tea and skin anticarcinogenic effects. J Invest Dermatol 1994; 102:3–7.
50.Lupo MP. Antioxidants and vitamins in cosmetics. Clin Dermatol 2001, 19:467–476.
51.Kligman AM, Grove GL, Hirose R, et al. Topical tretinoin for photoaged skin. J Am Acad Dermatol 1986; 15:836–859.
52.Darr D, Combs S, Dunston S, et al. Topical vitamin C protects porcine skin from ultraviolet radiation-induced damage. Br J Dermatol 1992; 127:247–253.
53.Katiyar SK, Ahmad N, Mukhtar H. Green tea and skin. Arch Dermatol 2000; 136:989–994.
54.Weiss JS, Ellis CN, Headington JT, et al. Topical tretinoin in the treatment of aging skin. J Am Acad Dermatol 1988; 19:169–175.
55.Evelson P, Ordonez CP, Llesuy S, et al. Oxidative stress and in vivo chemiluminescence in mouse skin exposed to UVA radiation. J Photochem Photobiol B 1997; 38:215–219.
56.Moon TE, Levine N, Cartmel B, et al. Effect of retinol in preventing squamous cell skin cancer in moderate-risk subjects: a randomized, double-blind, controlled trial. Southwest Skin Cancer Prevention Study Group. Cancer Epidemiol Biomarkers Prev 1997; 6:949–956.
57.Rao AV. Lycopene, tomatoes and the prevention of coronary heart disease. Nutr Res 2002; 19:305–323.
58.Fuchs J, Groth N, Herrling T. In vivo measurement of oxidative stress status in human skin. Methods Enzymol 2002; 352:333–339.
59.Herrling T, Fuchs J, Rehberg J, et al. UV-induced free radicals in the skin detected by ESR spectroscopy and imaging using nitroxides. Free Radic Biol Med 2003; 35:59–67.


Absorption and Evaporation of Volatile Compounds Applied to Skin |
387 |
|||||
TAblE 1 Required Permeant Physical Properties for Skin Transport |
|
|||||
Calculations |
|
|
|
|||
|
|
|
|
|||
Parameter |
Units |
Definition |
|
|||
|
|
|
|
|||
MW |
Da |
Molecular weight |
|
|||
log Koct |
– |
Log of octanol/Water partition coefficient |
|
|||
S |
w |
|
g/cm3 |
Water solubility of unionized form |
|
|
Pvp |
Torr |
Vapor pressure |
|
|||
pK |
a |
– |
Ionization constant(s)a |
|
||
f |
|
|
– |
Fraction unbound in a 2% albumin solutionb |
|
|
u |
|
|
|
|||
ρ |
|
|
g/cm3 |
Density |
|
|
All properties were determined at skin temperature, normally taken to be 32°C. For a discussion, see Ref. 7.
aThe fraction nonionized (fnon) in the stratum corneum (pH 5) and viable skin tissues (pH 7.4) must be estimated. All pKa values relevant to this calculation should be included.
bIn the absence of experimental data, the method of Yamazaki and Kanaoka (28) may be employed to obtain this value (14).
be justified so long as the timescale of the phenomenon of interest is long compared with those of the relevant microscopic transport processes contributing to the ob- served effect. Long-standing belief that transport through the stratum corneum is describable as Fick’s law diffusion through an effective homogeneous membrane (18,19) has been confirmed recently in, for example, an experimental study by Ka- lia et al. (20) and theoretical studies by Frasch and Barbero (21–23). Using a twodimensional brick-and-mortar microstructural representation of stratum corneum, the latter investigators derived an effective diffusivity and partition coefficient for the system and showed how to more accurately predict the diffusive lag time from these parameters.
Our combined research groups have further developed the effective medium approach for modeling transport in the stratum corneum (7,8,24–26) and the dermis (13,27). Substantial predictive power is evident in both cases. In the following section, formulas for the transport properties resulting from these investigations are presented. They are all derivable from the simple set of physical properties shown in Table 1.
EFFECTIVE TRANSPORT PARAMETERS FOR SKIN Stratum Corneum
Model-based calculation
The microstructural model from which the stratum corneum parameters are de- rived is shown schematically in Figure 2. The model is described in considerable detail in Refs. 24–26. The features that distinguish this model from earlier entries in the field are the following: (1) a more realistic geometry with lipid pathways calibrated from microscopic examination of human stratum corneum (29), (2) aniso- tropic lamellar lipids (30) with six bilayers separating opposing corneocytes, and (3) permeable corneocytes that swell when the skin is hydrated (31,32) and also bind permeants (26). To describe this system in the slab form shown in Figure 1, three pa-
rameters are needed: hsc, Dsc, and Ksc. Here, Ksc is short for Ksc/pH, where Ksc/pH reflects the partition coefficient of the permeant between stratum corneum and buffer at a
pH at which it is 100% unionized. Derivations of the formulas reported here may be found in Refs. 25 and 26.


392 |
Kasting et al |
Table 3 Formulas for Dermis Transport Parameters (14)
Parameter |
Units |
Formula or Value |
Eq. # |
||||
|
|
|
|
|
|
||
Defining |
– |
∂C |
= D |
∂2C k C |
(23) |
||
|
relationship |
|
∂t |
|
de ∂z 2 |
de |
|
hde |
cm |
|
|
0.20 |
|
(24) |
|
Kfree |
– |
|
|
0.6 |
|
(25) |
|
Kdea |
– |
K free (0.68 + 0.32 / fu + 0.001fnonK oct ) |
(26) |
||||
Dfree |
– |
10 ^ (−4.15 − 0.655 logMW) |
(27) |
||||
Dde |
cm2/sec |
Dfree /(0.68 + 0.32 / fu + 0.001fnonK oct ) |
(28) |
||||
k |
free |
sec−1 |
|
0.0022b |
|
(29) |
|
k |
de |
sec−1 |
K free /(0.68 + 0.32 / fu + 0.001fnonK oct ) |
(30) |
|||
a Eq. 26 expresses Kde with respect to a pH 7.4 aqueous solution (i.e., Kde/pH 7.4). To express Kde relative to a solution in which it is completely nonionized, the corresponding formula is (14)
b Value assumes blood-flow limited clearance and is derived from data for rat (14)
K |
de/non |
= K |
é(0.68 + 0.32 / f |
)/ f |
+ 0.001K |
ù |
(31) |
|
|
|
free ê |
u |
non |
|
oct ú |
||
|
|
|
ë |
|
|
|
û |
|
7.4) and to 1/fu, where fu is the fraction unbound in a 2% albumin solution as shown in Equations (24) to (27) (Table 3). Steric and charge exclusion are also factors, lead- ing to partition coefficients less than unity for small hydrophilic permeants (e.g., glucose (38)) and considerably smaller values for macromolecules such as albumin (15). For low MW moderately lipophilic compounds, the relationships in Table 3 serve as a working model for transport in dermis. The defining transport relation- ship for the distributed clearance model is given in this table as Equation (23).
The unique part of this relationship is the parameter kde representing capillary
clearance. The value of kde is comprised of an intrinsic clearance kfree , which applies to freely diffusing permeant, and a binding factor identical to that for diffusivity
[Equation (28)]. For small lipophilic compounds the intrinsic clearance kfree is ap- proximately constant as it is limited by blood flow.
Viable Epidermis
The viable epidermis is the thin cellular epithelial layer sandwiched between the dermis and the stratum corneum. Its thickness in humans varies from about 50 to 100 m due to the articulated nature of the dermis. Less is known about the trans- port properties of this layer than either stratum corneum or dermis because it is difficult to isolate. Due to its cellular structure, it presents a set of obstacles to solute transport different from those of dermis. In particular, hydrophilic solutes that do not easily cross cell membranes are confined to the tortuous extracellular space and experience longer diffusion pathways than do lipophilic solutes. This problem may be modeled using an extracellular fluid diffusivity modified by a tortuosity factor and void fraction (39) or, alternatively, with an effective medium approach. The latter is more easily generalized to cover both hydrophilic and lipophilic solutes as tortuosity and void fraction are functions of membrane permeability.
There is not yet a microscopic model for epidermal transport on which to base an effective medium model. There are, however, experimental diffusivity and permeability values for hydrophilic solutes in other cellular tissues (39,40) and an experimental value for glucose diffusivity in epidermis from our laboratory (38). Schultz and Armstrong (39) found the permeabilities of extracellular solutes in a rat


398 |
Kasting et al |
REFERENCES
1.Kasting GB, Saiyasombati P. A physico-chemical properties based model for estimating evaporation and absorption rates of perfumes from skin. Int J Cosmet Sci 2001; 23:49–58.
2.Saiyasombati P, Kasting GB. Disposition of benzyl alcohol following topical application to human skin in vitro. J Pharm Sci 2003; 92(10):2128–2139.
3.Saiyasombati P, Kasting GB. Two-stage kinetic analysis of fragrance evaporation and absorption from skin. Int J Cosmet Sci 2003; 25:235–243.
4.Saiyasombati P, Kasting GB. Evaporation of benzyl alcohol from human skin in vivo. J Pharm Sci 2004; 93(2):515–520.
5.Saiyasombati P, Kasting GB. Prediction of fragrance headspace concentrations from physicochemical properties. Perfum Flavor 2004; 29(5):38–47.
6.Kasting GB. Estimating the absorption of volatile compounds applied to skin. In: Riviere JE, ed. Dermal Absorption Models in Toxicology and Pharmacology. New York: Taylor and Francis, 2005:175–188.
7.Kasting GB, Miller MA. Kinetics of finite dose absorption through skin 2. Volatile compounds. J Pharm Sci 2006; 95(2):268–280.
8.Miller MA, Bhatt V, Kasting GB. Absorption and evaporation of benzyl alcohol from skin. J Pharm Sci 2006; 95(2):281–291.
9.Cleek RL, Bunge AL. A new method for estimating dermal absorption from chemical exposure. 1. General approach. Pharm Res 1993; 10(4):497–506.
10.Anissimov YG, Roberts MS. Diffusion modeling of percutaneous absorption kinetics: 2. Finite vehicle volume and solvent deposited solids. J Pharm Sci 2001; 90:504–520.
11.Kasting GB. Kinetics of finite dose absorption 1. Vanillylnonanamide. J Pharm Sci 2001; 90(2):202–212.
12.Cross S, Magnusson BM, Winckle G, Anissimov YG, Roberts MS. Determination of the effect of lipophilicity on the in vitro permeability and tissue reservoir characteristics of topically applied solutes in human skin layers. J Invest Dermatol 2003; 120:759–764.
13.Kretsos K, Kasting GB, Nitsche JM. Distributed diffusion-clearance model for transient drug distribution within the skin. J Pharm Sci 2004; 93(11):2820–2835.
14.Kretsos K, Miller MA, Zamora-Estrada G, Kasting GB 2007. Partitioning, diffusivity and clearance of skin permeants in mammalian dermis. Int J Pharm in press, doi:10.1016/ j.ijpharm.2007.06.020.
15.Maxwell JC. A Treatise on Electricity and Magnetism. Vol. I. Oxford: Clarendon Press, 1892:440–441.
16.Rayleigh L. On the influence of obstacles arranged in rectangular order upon properties of a medium. Phil Mag (Fifth Ser) 1892; 34:481–502.
17.Brenner H, Edwards DA. Macrotransport Processes. Boston: Butterworth-Heinemann, 1993.
18.Scheuplein RJ. Mechanism of percutaneous absorption: II. Transient diffusion and the relative importance of various routes of skin penetration. J Invest Dermatol 1967; 48(1):79–88.
19.Pirot F, Kalia YN, Stinchcomb AL, Keating G, Bunge A, Guy RH. Characterization of the permeability barrier of human skin in vivo. Proc Nat Acad Sci USA 1997; 94: 1562–1567.
20.Kalia YN, Pirot F, Guy RH. Homogeneous transport in a heterogeneous membrane: water diffusion across human stratum corneum in vivo. Biophys J 1996; 71:2692–2700.
21.Frasch HF, Barbaro AM. Steady-state flux and lag time in the stratum corneum lipid pathway: results from finite element models. J Pharm Sci 2003; 92(11):2196–2207.
22.Barbero AM, Frasch HF. Modeling of diffusion with partitioning in stratum corneum using a finite element model. Ann Biomed Eng 2005; 33:1281–1292.
23.Barbero AM, Frasch HF. Transcellular route of diffusion through stratum corneum: results from finite element models. J Pharm Sci 2006; 95(10):2186–2194.
24.Wang T-F, Kasting GB, Nitsche JM. A multiphase microscopic model for stratum corneum permeability: I. Formulation, solution and illustrative results for representative compounds. J Pharm Sci 2006; 95(3):620–648.
25.Wang T-F, Kasting GB, Nitsche JM. Amultiphase microscopic model for stratum corneum permeability: II. Estimation of physicochemical parameters and application to a large permeability database. J Pharm Sci 2007; 96(11):3024–3051.

Absorption and Evaporation of Volatile Compounds Applied to Skin |
399 |
26.Nitsche JM, Wang T-F, Kasting GB. A two-phase analysis of solute partitioning into the stratum corneum. J Pharm Sci 2006; 95(3):649–666.
27.Kretsos K, Kasting GB. A geometrical model of dermal capillary clearance. Math Biosci 2007; 208(2):430–453.
28.Yamazaki K, Kanaoka M. Computational prediction of the plasma protein-binding percent of diverse pharmaceutical compounds. J Pharm Sci 2004; 93(6):1480–1494.
29.Talreja PS, Kleene NK, Pickens W, Wang T-F, Kasting GB. Visualization of lipid barrier and measurement of lipid path length in human stratum corneum. AAPS PharmSci 2001; 3(2):Article 13.
30.Johnson ME, Berk DA, Blankschtein D, Golan DE, Jain RK, Langer RS. Lateral diffusion of small compounds in human stratum corneum and model lipid bilayer systems. Biophys J 1996; 71(November):2656–2668.
31.Kasting GB, Barai ND. Equilibrium water sorption in human stratum corneum. J Pharm Sci 2003; 92(8):1624–1631.
32.Kasting GB, Barai ND, Wang T-F, Nitsche JM. Mobility of water in human stratum corneum. J Pharm Sci 2003; 92(11):2326–2340.
33.Santhanam A, Miller MA, Kasting GB. Absorption and evaporation of N,N-diethyl- m-toluamide (DEET) from human skin in vitro. Toxicol Appl Pharmacol 2005; 204:81–90.
34.Ray Chaudhuri S. Mathematical modeling of percutaneous absorption of volatile compounds following transient liquid-phase exposures. PhD thesis, University of Cincin nati, Cincinnati, 2007.
35.Berner B, Juang R-H, Mazzenga GC. Ethanol and water sorption into stratum corneum and model systems. J Pharm Sci 1989; 78(6):472–476.
36.Braverman IM. The cutaneous microcirculation: ultrastructure and microanatomical organization. Microcirculation 1997; 4(3):329–340.
37.Kretsos K. Transport phenomena in the human skin. PhD thesis, State University of New York, Buffalo, 2003.
38.Khalil E, Kretsos K, Kasting GB. Glucose partition coefficient and diffusivity in the lower skin layers. Pharm Res 2006; 23(6):1227–1234.
39.Schultz JS, Armstrong W. Permeability of interstitial space of muscle (rat diaphragm) to solutes of different molecular weights. J Pharm Sci 1978; 67(5):696–700.
40.Jain RK. Interstitial Transport in Tumors: Barriers and Strategies for Improvement. American Association for Cancer Research 96th Annual Meeting, 2005.
41.Peress J. Estimate evaporative losses from spills. Chem Eng Prog 2003; (April):32–34.
42.N-Dri-Stempfer B, Bunge AL. How Much Can Evaporation of Dermally Absorbed Chemical Reduce the Systemically Absorbed Dose? Occupational and Environmental Exposure of Skin to Chemicals, Stockholm, Sweden, 2005.
43.Lyman WJ, Reehl WF, Rosenblatt DH. Handbook of Chemical Property Estimation. New York: McGraw-Hill, 1982.
44.Potts RO, Guy RH. Predicting skin permeability. Pharm Res 1992; 9(5):663–669.
45.Frasch HF, Barbaro AM. The Transient Dermal Dose Problem, Occupational and Environmental Exposures of Skin to Chemicals, Stockholm, Sweden, 2005.
46.Basketter DA, Casati S, Cronin MTD, et al. Skin sensitisation and epidermal disposition. The relevance of epidermal bioavailability for sensitisation hazard identification/risk assessment. Altern Lab Anim 2007; 35:137–154.


Efficacy, Absorption, and Safety of Essential Oils |
403 |
is commonly accepted that essential oils and some of their components act mainly on microbial cytoplasmic membranes.
For example, TTO not only increased the leakage of K+ ions from cells of
Staphylococcus aureus and E. coli, but also inhibited cell respiration of both strains of bacteria. Furthermore, it is known that oxidized monoterpenes, such as alcohols, aldehydes, and phenols, will increase cytoplasmic membrane fluidity and perme- ability, disturb the order of membrane-embedded proteins, inhibit cell respiration, and alter ion transport processes. Sites of action other than the cytoplasmic mem- brane also exist (Table 2).
Antiviral Activity
There is considerable evidence, from both in vitro studies and controlled clinical trials, of the potential of plant-derived phytoantiviral agents for the treatment of viral infections (25). Many essential oils have been evaluated for antiviral activity. Most were tested against enveloped RNA and DNA viruses, such as Herpes simplex virus type 1 and type 2 (DNA viruses), Dengue virus (RNA virus), human immu- nodeficiency virus type 1 (RNA virus), influenza virus (H1N1; RNA virus), Junin virus (RNA virus), and Newcastle disease virus (RNA virus (26–33), whereas only few essential oils (e.g., oregano oil and clove oil) were tested against nonenveloped RNA and DNA viruses, such as Adenovirus type 3 (DNA virus), Poliovirus (RNA virus), and Coxsackie virus B-1 (RNA virus) (26,27). The antiviral activity of the es- sential oils tested was clearly demonstrated for enveloped viruses of both the DNA and RNA type. On the contrary, the nonenveloped viruses were not susceptible to essential oils.
Mode and Mechanism of Antiviral Action
To learn more about the effect of essential oils on enveloped viruses, we investi- gated the antiviral activity of anise oil, hyssop oil, thyme oil, dwarfpine oil, citrus oil, manuka oil, ginger oil, camomile oil, and sandalwood oil against HSV-1 and HSV-2 in vitro (34). The replication cycle of Herpes simplex virus is characterized by a complex sequence of different steps that offer opportunities for antiviral agents to intervene. To determine the mode of action, essential oils were added to host cells and viruses at different stages during viral infection.
1. Host cells (African green monkey kidney cells) were pretreated for 1 hour with essential oils prior to inoculation with herpes viruses (pretreatment of cells).
2. Herpes viruses were incubated with essential oils for 1 hour prior to infection of host cells (pretreatment of virus).
3. Herpes viruses were mixed with essential oils and added to the host cells im- mediately (adsorption).
4. Host cells were incubated with essential oils after penetration of herpes viruses into the cells (intracellular replication).
Inhibition of HSV replication was measured by a plaque reduction assay. In this assay, the number of plaques of drug-treated cells and viruses [plaque-forming unit (pfu)] was expressed as percent (% v/v) of the untreated control (number of plaques formed by viruses in the absence of essential oil). In all assays, the maxi- mum noncytotoxic concentrations of the essential oils tested (0.0006–0.01%) were used.

404 |
|
|
Schäfer et al. |
|
TAbLE 2 Targets and Physiological Effects of Selected Essential Oils and Individual |
||||
Oil Components |
|
|
|
|
|
|
|
|
|
Targets |
Bacteria |
Substances |
References |
|
|
|
|
|
|
Cell morphology |
|
|
|
|
Forming elongated filamentous |
E. coli |
Palmrose oil; |
(11) |
|
forms after treatment with |
|
peppermint oil |
|
|
essential oil; normal cells: |
|
|
|
|
3–5 µm in length; elongated |
|
|
|
|
cells: 10–25 µm in length |
|
|
|
|
Alteration of cell shape: |
M. pneumoniae |
TTO |
(12) |
|
cells of wild type exhibit a |
|
|
|
|
flask-shaped morphology, |
|
|
|
|
whereas TTO-treated strains |
|
|
|
|
form ovoid or round cells |
|
|
|
|
Cytoplasmic membrane (alteration of integrity and permeability) |
|
|
||
Inhibition of cell respiration |
E. coli; S. aureus |
TTO |
(13,14) |
|
Inhibition of oxygen uptake, |
R. sphaeroides |
Thymol, carvacrol, other |
(15) |
|
respiratory electron flow, and |
|
monoterpene alcohols |
|
|
oxidative phosphorylation |
|
|
|
|
K+ leakage |
E. coli; S. aureus |
TTO; TTO, farnesol, |
(13,14,16) |
|
|
|
nerolidol |
|
|
Depletion of intracellular ATP |
E. coli, L. monocy |
Oregano oil, cinnamon |
(17,18) |
|
concentration |
togenes; E. coli |
oil, savory oil; carva- |
|
|
|
|
crol, thymol |
|
|
Formation of multilamellar |
S. aureus |
TTO; terpinen-4-ol |
(19,20) |
|
mesosome-like structures |
|
|
|
|
Cell wall |
|
|
|
|
Formation of extracellular blebs |
E. coli |
TTO; lemongrass oil |
(21,22) |
|
Disintegration of outer |
E. coli |
Thymol, carvacrol |
(17) |
|
membrane and outer- |
|
|
|
|
membrane-associated |
|
|
|
|
LPS release |
|
|
|
|
Cell lysis |
S. pneumoniae; |
Oregano oil, thyme oil; |
(23,24) |
|
|
E. coli, B. subtilis |
oregano oil, glove oil |
|
|
Cell division |
|
|
|
|
Total inhibition of cell division |
S. aureus |
TTO |
(20) |
|
Cell cytoplasm/cytosol |
|
|
|
|
Formation of condensed |
S. aureus |
TTO |
(20) |
|
filamentous electron-dense |
|
|
|
|
material in the |
|
|
|
|
cytoplasm/cytosol |
|
|
|
|
Abbreviations: TTO, tea tree oil; Bacillus subtilis, B. subtilis; Escherichia coli, E. coli; S. aureus, Staphylococcus aureus; S. pneumoniae, Streptococcus pneumoniae; R. sphaeroides, Rhodopseudomonas sphaeroides; L. monocytogenes, Listeria monocytogenes; and M. pneumoniae, Mycoplasma pneumoniae.
Pretreatment of cells with essential oils 1 hour prior to virus infection did not reduce the virus plaque formation. This suggests that essential oils did not affect the adsorption of viruses to cell surface, indicating that essential oils did not interfere with virus binding by blocking cellular receptors. On the other hand, pretreatment of viruses with essential oils 1 hour prior to cell infection caused a significant reduc-
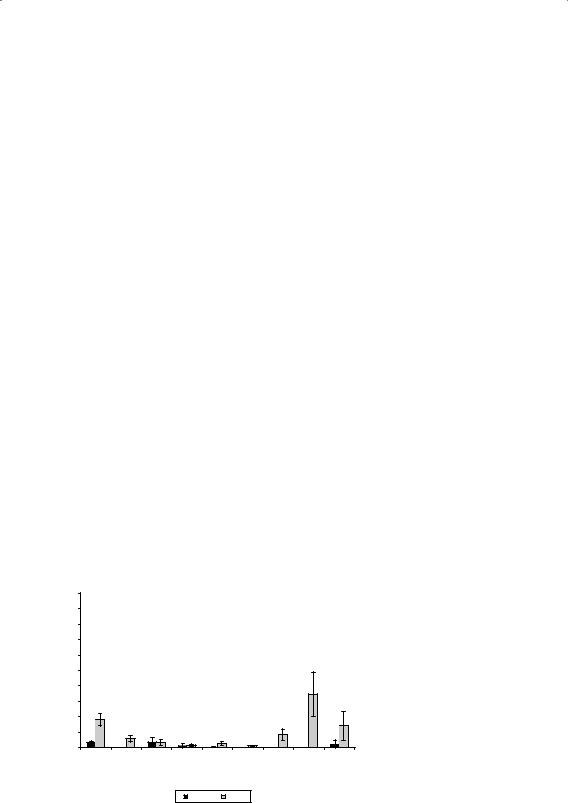
406 |
|
|
|
Schäfer et al. |
|
Table 3 Antiviral Activity of Selected Essential Oils Against Herpes Viruses |
|
||||
|
|
|
|
|
|
Essential oil |
Plant |
Virus |
TC50 [%] |
IC50 [%] |
SI |
Anise oil |
Illicium verum |
HSV-1 |
0.016 |
0.004 |
4.0 |
|
|
HSV-2 |
0.016 |
0.003 |
5.0 |
Camomile oil |
Matricaria recutita |
HSV-1 |
0.003 |
0.00003 |
100.0 |
|
|
HSV-2 |
0.003 |
0.00015 |
20.0 |
Citrus oil |
Citrus limon |
HSV-1 |
0.0045 |
0.0015 |
3.0 |
|
|
HSV-2 |
0.0045 |
0.0015 |
3.0 |
Ginger oil |
Zingiber officinale |
HSV-1 |
0.004 |
0.0002 |
20.0 |
|
|
HSV-2 |
0.004 |
0.0001 |
40.0 |
Hyssop oil |
Hyssopus officinalis |
HSV-1 |
0.0075 |
0.0001 |
75.0 |
|
|
HSV-2 |
0.0075 |
0.0006 |
13.0 |
Manuka oil |
Leptospermum |
HSV-1 |
0.0035 |
0.0001 |
35.0 |
|
scoparium |
HSV-2 |
0.0035 |
0.00009 |
39.0 |
Sandalwood oil |
Santalum album |
HSV-1 |
0.0015 |
0.0002 |
7.5 |
|
|
HSV-2 |
0.0015 |
0.0005 |
3.0 |
Thyme oil |
Thymus vulgaris |
HSV-1 |
0.007 |
0.001 |
7.0 |
|
|
HSV-2 |
0.007 |
0.0007 |
10.0 |
Dwarf pine oil |
Pinus mugo |
HSV-1 |
0.004 |
0.0007 |
5.7 |
|
|
HSV-2 |
0.004 |
0.0007 |
5.7 |
Abbreviations: IC50, 50% inhibitory concentration; TC50, 50% cytotoxic concentration; SI, selectivity index = TC50 / IC50.
DERMAL ABSORPTION
One of the main routes of human exposure to essential oils in cosmetics and thera- peutics is via the dermal route. It is well known that the rate of absorption is de- pendent on the integrity of the skin. Shaving with a razor blade, for example, may damage skin resulting in a higher absorption than through intact skin (36). It is also well known that absorption rates can be affected by occlusion. Occlusion of the skin usually results in a higher rate and extent of absorption when compared to nonoccluded skin (37). The reasons for this could be the increased hydration of the stratum corneum (SC), increased surface skin temperature, or reduced evapora- tion of the test permeant. This factor should always be considered when evaluating the skin permeability of essential oil components because it is not unusual to cover treated skin with clothes after the application of such products.
The ingredients of essential oils have lipophilic properties, and they are solu- ble in lipophilic media. Therefore essential oils are not only well absorbed through the mucosal membranes of the oral cavity, the nose, the pharynx, and the gastro- intestinal tract but also through the skin. In 1940, Strähli et al. (38) demonstrated that, following dermal application of essential oils, the components of these oils appeared in respired air after a certain time. Despite the significant importance of understanding the behavior of essential oil-containing products applied to the skin, there are only a few current reports on skin absorption. The majority of the information reviewed suggests that lipophilic ingredients of essential oils are well absorbed.
There are different methods available to investigate the permeation of sub- stances through skin. A common technique is to use excised skin from laboratory animals whose skin has a similar behavior to human skin. Another possibility is to examine permeation through human skin. In the latter case, the experiments may be performed either in vivo with subsequent examination of blood levels or using

Efficacy, Absorption, and Safety of Essential Oils |
407 |
excised human skin from patients who undergo abdominal plastic surgery. This chapter summarizes some of the existing literature regarding the percutaneous ab- sorption of essential oils and their ingredients with the main focus on different ex- perimental systems.
Human Studies
The first investigations to obtain information on the permeation behavior of vola- tile substances were carried out in humans. In this case, an essential oil-containing formulation was applied to a defined area and the amount of substance penetrated was determined in blood samples.
A very common formulation for essential oils is massage oil because its in- gredients are able to increase blood circulation and, moreover, essential oils often have sedative effects. A group from Austria investigated the systemic absorption of topically applied carvone (39). (-)-R-carvone is found in various plants, of which the oil of spearmint leaves has the highest concentration. Although some data on the absorption of carvone from animal models exist, there were no data on human skin. Massage oil containing 20% (-)-R-carvone in peanut oil was applied on a defined skin area of the lower abdomen. A normal massage, a massage with an occlusion wrap and an irradiation massage with orange light, were employed. Blood samples were taken from the left cubital vein at selected time intervals, and the amount of carvone was determined using gas chromatography.
Carvone rapidly permeated the skin and could be detected in the blood sam- ples 10 minutes after application and starting the massage. However, the mechani- cal treatment of the skin could also be a reason for the fast permeation of carvone. Dependent on the massage technique, the time to reach the peak (normal massage: tmax = 25.81 min; occlusion wrap: 36.65 min; irradiation: 23.49 min) and the blood lev- els (23.92, 32.56, and 28.31 ng/ml) for massage with an occlusion wrap were signifi- cantly longer than those for normal massage and the irradiation technique. In this study a plastic film was used to wrap the body tightly to cover the massaged skin area. Usually the treated area is covered with clothes, rather than a plastic film, and the absorption rate would not be as high; however, a higher absorption rate should be assumed for every day life. Similar effects were found using nanoparticles (40).
Because of their effects on microorganisms and their expectorant and anti- tussive qualities, essential oils are often used in cold rubs such as Pinimenthol®- S-Salbe. This ointment contains monoterpenes and is used in the treatment of diseases of the respiratory tract, especially chronic bronchitis and colds. After der- mal application of the ointment, the monoterpenes are absorbed through the skin as well as via inhalation.
To investigate the extent of dermal absorption, test subjects were separated into two groups. In both groups Pinimenthol-S-Salbe was applied to the thorax. In the first group, the treated skin area was covered airtight, but in the other group the treated area was uncovered and the subjects were able to breathe in the essential oils (41). At set time intervals, blood samples were taken from the left cubital vein, and the amounts of the individual components were determined. The four mono- terpenes measured (α-pinene, camphor, β-pinene, and 3-carene) could be detected in the blood five minutes after application (Fig. 2).
Most of the monoterpenes reached their highest blood concentration within five minutes following application with a lag time of around 0.6 minutes. These results suggest that the skin does not represent a major diffusion barrier for these


Efficacy, Absorption, and Safety of Essential Oils |
409 |
Human Skin (In Vitro)
The preferred choice of membrane for in vitro permeation studies is excised human skin. Usually, excised skin from Caucasian patients undergoing abdominal or breast reduction surgery is used. Immediately after excision, the subcutaneous fatty tissue is removed using a scalpel, and the skin is stored in polyethylene bags in a freezer at -26°C until use. Previous experiments have shown that neither the penetration characteristics nor the thickness of the SC are affected after a freezing period of up to six months (46). For permeation experiments, full thickness, dermatomed, or heat-separated human epidermis (HSE) may be used. HSE, prepared according to the method of Kligman et al. (47), is preferred when determining the skin perme- ation of the lipophilic constituents of essential oils.
Essential oils have a wide range of use both in cosmeceutical and pharmaceu- tical preparations. With regard to pharmaceutical preparations, the absorption of the essential oil and its various ingredients is very important. Most substances only have a therapeutic effect after reaching a certain concentration at the target site.
Reichling et al. (48) investigated the capability of terpinen-4-ol to permeate human skin. Terpinen-4-ol is the main component (30–40%) of Australian TTO, an essential oil derived by steam distillation of the leaves of the Australian native tea tree Melaleuca alternifolia (Myrtaceae). TTO is a component of skin care products where it is used for cleaning, healing, and relieving itch, hotspots, abrasions, and other minor rashes and irritations. In the last few years, TTO has become more im- portant as topical antimicrobial (49,50) or antiviral preparations (51,52) such as a 5% semisolid oil-in-water (O/W) emulsion and cream or as a 6% gel formulation (51).
We have investigated the effect of formulation on the human skin permeation of terpinen-4-ol from TTO preparations (48). Before starting the skin permeation experiments, the influence of the formulation on the liberation of terpinen-4-ol was investigated using an ointment, a cream, and a semisolid O/W emulsion, all con- taining 5% TTO. The cream had the lowest release rate, and the ointment had the highest. Because of the two phases in the cream system and the consequential com- plex diffusion pathway, the absorption route for terpinen-4-ol may be longer. Addi- tionally, the incorporation of the lipophilic terpinen-4-ol into the lipoidal phase may play a role. However, the main purpose of this experiment was the investigation of the influence of different formulations on the skin permeation of terpinen-4-ol. Per- meation of the TTO-containing formulations was tested and compared with pure TTO. The application formulation had a distinct influence on the permeation of terpinen-4-ol through HSE, as shown in Figure 3. The highest permeation was found for pure TTO followed by the semisolid O/W emulsion preparation, the ointment, and the cream.
Table 4 gives the flux values and the apparent permeation coefficients (accord- ing to Fick’s first law of diffusion) of terpinen-4-ol. The flux value is in accordance with the slope of the linear portion of the graph of the cumulative amount pen- etrated as a function of time.
The apparent permeation coefficient is described by the quotient of the flux value and the content of terpinen-4-ol in the formulation or in pure TTO. Pure TTO exhibits the highest flux value but the lowest apparent permeation coefficient (Papp),
which is due to the high content of terpinen-4-ol. The Papp is used to compare the formulations with pure TTO because this value is independent of the concentration
of terpinen-4-ol. The Papp value of the cream is very similar to that of the native oil.
The reason for this result may be the reduced release from the formulations due to their lipophilic properties. The semisolid O/W emulsion shows the highest Papp

 Tea-tree-oil
 Semisolid O/W emulsion 5%
 Ointment 5%
Efficacy, Absorption, and Safety of Essential Oils |
411 |
[µg/cm²] |
50 |
|
|
|
|
|
|
|
|
Creme 1% |
|
|
|
|
|
|
|
|
40 |
Creme 3% |
|
|
|
|
|
|
permeated |
|
Creme 5% |
|
|
|
|
|
|
30 |
|
|
|
|
|
|
|
|
|
|
|
|
|
|
|
|
|
Methyleugenole |
20 |
|
|
|
|
|
|
|
10 |
|
|
|
|
|
|
|
|
|
|
|
|
|
|
|
|
|
|
0 |
|
|
|
|
|
|
|
|
0 |
5 |
10 |
15 |
20 |
25 |
30 |
FIgURE 4 Permeation of methyl |
|
eugenol through heat-separated |
|||||||
|
|
|
|
time [h] |
|
|
|
human epidermis (mean ± SD). |
iments, the cream preparations were applied at doses of between 5 and 10 mg/cm2. In this way, the extent of skin permeation of methyl eugenol from rose-oil-containing preparations under in-use conditions can be estimated. Furthermore, the amount of methyl eugenol in and on the surface of the SC was determined at the end of the experiment to determine mass balance.
Table 5 shows the percentage permeation of methyl eugenol over the course of the experiment. After 12 hours, about 80% of the applied dose of methyl eugenol had permeated the skin, which suggests that the skin is not a significant permeation barrier for this substance. The recovery of methyl eugenol averaged between 85% and 98% of the applied dose. These values are acceptable given that methyl eugenol is a volatile substance and, despite covering the donor compartment, evaporation cannot be completely avoided.
Penetration Enhancement and Distribution of Essential Oils in Skin Strata
In general, essential oils or their native compounds are often used for cosmetic and pharmaceutical purposes. They may act as fragrances, as therapeutic drugs, or solely as skin penetration enhancers. There are many reports on the penetration enhancement of both lipophilic and hydrophilic drugs by various terpenes, e.g., for
5-fluorouracil (55) and estradiol (56). As a result, it was clearly shown that, for the
TAbLE 5 Methyl Eugenol Permeated
Through Heat-Separated Epidermis After
Various Time Intervals From Cream
|
Methyl eugenol |
|
|
permeated (%) |
|
Time (hours) |
mean ± SD |
|
|
|
|
3 |
32.30 |
± 10.27 |
6 |
61.06 |
± 13.16 |
9 |
72.98 |
± 9.51 |
12 |
82.05 |
± 11.21 |
24 |
77.49 |
± 6.71 |
27 |
83.41 |
± 9.32 |
|
|
|

412 |
Schäfer et al. |
hydrophilic drug, 5-fluorouracil hydrocarbon terpenes (e.g., d-limonene) were less potent than alcohol or ketone structures containing terpenes (e.g., 1,8-cineole), and the greatest enhancement activity was shown by the oxide terpenes and terpenoids. In contrast, hydrocarbon terpenes were the most effective enhancers for the steroi- dal drug estradiol. However, the data could not be generalized, and it appears that the action of terpenes as penetration enhancers may be specifically related to the drug in use. A summary of the use of different terpenes as penetration enhancers for various drugs is provided by Medi et al. (57). There are only a few reports on the use of the whole native essential oil for penetration enhancement. For example, Monti et al. (58) present data on the effects of melissa, cajupt, cardamon, myrtle, niaouli, and orange essential oil, dissolved at 10% in propylene glycol, on the penetration of estradiol through hairless mouse skin. Niaouli oil showed the largest enhance- ment factor, whereas melissa and cardamon oil failed to improve the penetration rate. Comparing the four main terpene components of niaouli oil, 1,8-cineole, α- pinene, α-terpineol, and d-limonene (10% in propylene glycol) on skin permeation, separately, 1,8-cineole gave the largest enhancement factor (EF 33), but this was sig- nificantly lower than for the native niaouli oil (EF 52.1). Moreover, they found that a ternary mixture of 1,8-cineole (69.2%), α-pinene (22.5%), and d-limonene (8.3%) gave the same increase of permeation as the native niaouli oil. These results clearly demonstrate that the use of the whole essential oil may be superior to a single com- ponent of that oil. However, it cannot be concluded that other minor components of the oils do not significantly influence enhancing activity. Considering the enhance- ment capability of essential oils, one should be aware of potential enhanced deliv- ery of other substances if essential oils or their components are incorporated into formulations for dermal applications. This may increase the risk of toxic effects and reduce the safety of such preparations.
Interesting effects for the essential oils, lavender oil (32% linalool and 35% lin- alyl acetate), TTO (30% terpinen-4-ol), juniper oil (41% α-pinene), and geranium oil (28% citronellol), incorporated in formulations or applied pure, on the distribution of the main component between SC and epidermis/dermis (ED) have been reported recently (59). When the essential oils were applied as pure oils, higher amounts of the constituent terpenes were found in the skin when compared to their application as part of dermal formulations (oil content 0.75%). There was no proportionality to the penetrant concentration, and the author reasoned that this was due to a limited capacity of the SC for the components. Comparing the SC/ED ratio for linalyl ac- etate and linalool from lavender oil to that of the pure substances, the partitioning was shifted to the SC, resulting in a fourfold larger accumulation in the SC. Formu- lation differences were observed. For example, when lavender oil was incorporated in an O/W emulsion or grape seed oil, similar concentrations for linalool and linalyl acetate in the SC and ED were observed. In contrast using the same formulations with TTO, terpinen-4-ol penetrated more rapidly when delivered as an oily solu- tion. These findings demonstrated that the influence of formulation depends on the type of terpene or essential oil and their physicochemical characteristics.
In conclusion, components of essential oils penetrate the SC, the viable epi- dermis, and the dermis. The magnitude depends on the lipophilicity and hydro- philicity of the terpene itself and the formulation in which the substance is applied. Furthermore, there are differences in the penetration behavior between pure essen- tial oils and their neat components. Therefore, conclusions from experiments with neat components of essential oils and the complex mixture of the essential oil itself should be treated with caution.

Efficacy, Absorption, and Safety of Essential Oils |
413 |
SAFETY
Topical Side Effects of Essential Oils
The most common application of essential oils is topical application to the skin or mucous membranes. Direct skin contact occurs from perfumes, cosmetic fra- grances, and pharmaceuticals, whereas mucous membranes are exposed when using toothpastes, mouth fresheners, and feminine hygiene products or inhaling essential oils. Known clinical side effects occurring following topical application of essential oils are allergic contact dermatitis, skin and mucous membrane irritation, hyperpigmentation, and cytotoxic effects (1,60–62). To learn more about the side effects of essential oils when used topically, we investigated the potential irritation effects of essential oils on eyes and mucous membranes. Different in vivo and in vi- tro methods are available for testing eye and mucous membrane irritation potency of essential oils.
The Draize test
The Draize rabbit eye irritation test (Draize test) is the classical in vivo experiment to detect potential eye or mucous membrane irritation of substances (63).This test method is required by legislature worldwide to obtain data for the risk assessment of consumer products. To detect potential eye irritation, a test substance is applied directly into the conjunctival sac of the rabbit’s eye. The irritation responses of the cornea (the area of corneal opacity), the iris (swelling, reaction to light, and hemor- rhage), and the conjunctivae (redness and swelling with closing of lids) are scored depending on their severity. Ethical as well as scientific concerns have been raised on this test system because it is reported to be not only very painful for the ani- mals, but also poorly reproducible (64). Against this background, in 1987, the OECD stated that there is no need for animal experiments if data are available from a gen- erally accepted and validated alternative method (65).
The HET-CAM test
The hen egg test-chorioallantoic membrane (HET-CAM) test, described for the first time by Lüpke (66), is a non-animal test system that is accepted by the German regulatory authorities (67) to identify severe irritants. In this test system, the highly vascularized CAM of hen eggs is exposed to suspected irritants. Depending on the onset times of the different endpoints (hyperemia, hemorrhage, lysis, and coagula- tion), a scoring system was developed to classify different degrees of potential mu- cous membrane/eye irritation ranging from severe to not irritant (68).
Modified HET-CAM test
The HET-CAM test protocol (67) is not useful for detecting mucous membrane ir- ritation potential of essential oils because they are known to be nonsevere irritants. According to our findings, pure essential oils cause only hemorrhage on the CAM. Therefore, we developed a modified test protocol in which hemorrhage is the ulti- mate endpoint. Furthermore, varying from the normal test protocol, we determine the irritation threshold concentration (ITC) of an essential oil. The ITC is defined as the lowest concentration of an irritant leading to clearly visible hemorrhage within five minutes of application, compared with the reaction of the CAM after exposure to 0.5% sodium dodecyl sulfate solution (69,70).

414 |
Schäfer et al. |
Using the modified HET-CAM test protocol, we analyzed the irritation poten- tial of selected essential oils and compared their ITC to those of their corresponding major constituents. The results are summarized in Figure 5. According to our find- ings, the essential oils tested revealed clear differences in their irritation potential to the CAM. Based on the ITC values, the test oils can be ranked in three groups: ITC < 30%, rose oil, clove oil, cinnamon oil, melissa oil, and eucalyptus oil; ITC ≤ 50%, lemon grass oil, peppermint oil, sage oil, and caraway oil; and ITC ≤ 100%, anise oil, orange carp oil, and lemon oil. Camomile oil did not irritate the CAM at any concentration tested.
Because essential oils are known to be complex mixtures of different volatile substances, the question arises as to whether the irritation potential of an essential oil can be linked to one or more of its components. Therefore, we first determined the ITC values of the main components of each essential oil. The results demonstrate clearly that the irritation potential of an essential oil is based on its chemical compo- nents. In some cases, the ITC values of the main constituents fitted those of the corre- sponding essential oil (e.g., rose oil, clove oil, cinnamon oil, eucalyptus oil, and sage oil). On the other hand, it was also shown that the minor components contributed to the overall irritation potential and that synergistic and antagonistic effects were possible (e.g., lemon grass oil, caraway oil, orange carp oil, and lemon oil).
In summary, our investigation has shown that essential oils that differ in their irritation potential can be significantly discriminated by our modified HET-CAM test. We believe that, based on the ITC values, essential oils can be ranked in three categories: ITC ≤ 25% essential oil (strongly irritative to the CAM), ITC 30% to 70%
|
100 |
??’ |
|
|
|
|
|
|
|
|
|
Essential Oil |
|
|
a-Bisabolol |
|
|
80-95% |
|
|
|
|
|
|
Main Compound |
||
|
|
|
|
|
|
|
|
|
|
||||
|
90 |
|
|
|
|
|
|
|
|
|
|
||
Concentration % |
|
|
|
Anethol |
|
|
|
|
|
|
|
|
|
80 |
|
|
|
|
|
|
|
|
|
|
|
||
70 |
|
|
|
|
|
|
|
|
|
|
|
||
60 |
|
|
|
|
|
|
|
|
|
|
|
||
Irritation Threshold |
|
Limonen 90% |
Limonen 90% |
|
|
|
|
|
|
|
|
|
|
50 |
|
|
|
|
|
|
|
|
|
|
|||
40 |
|
|
Thujone 35-60% |
|
|
|
|
|
|
|
|||
30 |
|
|
Menthol 45-60% |
|
1,8-Cineol >70% |
Citronellal 70% |
|
|
|
||||
20 |
|
Carvone 45-65% |
|
Cinnamaldehyde 70% |
|
|
|||||||
10 |
|
Geraniol 47% |
Eugenol 85% |
Geraniol/Nerol |
|||||||||
0 |
|
||||||||||||
|
|
|
|
|
|
|
|
|
|
|
|
|
|
Oil |
Oil |
Oil |
Oil |
Oil |
Oil |
Oil |
Oil |
Oil |
Oil |
Oil |
Oil |
Oil |
Camomile Lemon |
Carp |
Anise Caraway |
Sage Peppermint |
Grass |
|
|
|
|
|
|||
|
Eucalyptus Melissa Cinnamon |
Clove |
Rose |
|||||||||
|
Orange |
|
|
|
|
Lemmon |
|
|
|
|
|
|
Figure 5 ITC of essential oils and their corresponding main constituents. Results are given in % (v/v) or % (m/m). Black bars represent the ITC values of the test oils, whereas the white bars depict the ITC values of the corresponding main compounds. The main individual compounds are named in the white bars. Abbreviation: ITC, irritation threshold concentrations.

Efficacy, Absorption, and Safety of Essential Oils |
415 |
essential oil (moderately irritative to the CAM), and ITC 75% to ≤ 100% (slightly to nonirritative to the CAM). Although the extrapolation of in vitro data to the in vivo situation should always be treated with caution, the ITC values derived from the modified HET-CAM test confirm the experience of practitioners that essential oils should never be used undiluted on the skin and mucous membranes. Furthermore, our modified HET-CAM test may be helpful in discriminating between strongly ir- ritative and slightly to nonirritative essential oils. In this context, it is of interest that clove oil is reported to be an irritant to eyes and skin (1,71) whereas camomile oil is known for its anti-inflammatory and nonirritative effect (1). As shown in Figure 5, the irritation potential of both of these essential oils can be discriminated clearly us- ing the ITC values from our modified HET-CAM test.
REFERENCES
1.Lis-Balchin M. Aromatherapy Science. London: Pharmaceutical Press, 2006; Vol. 1.
2.Buchbauer G, Jirovetz L. Aromatherapy—use of fragrances and essential oils as medicaments. Flav Fragr J 1994; 9:217–222.
3.Reichling J. Plant-microbe interaction and secondary metabolites with antiviral, antibacterial and antifungal properties. In: Wink M, ed. Functions of Plant Secondary Metabolite and their Exploitation in Biotechnology. Annual Plant Review. Sheffield: Sheffield Acad. Press, 1999:187–273.
4.Weseler A, Geiss HK, Saller R, et al. A novel colorimetric broth microdilution method to determine the minimum inhibitory concentration (MIC) of antibiotics and essential oils against Helicobacter pylori. Pharmazie 2005; 60:498–502.
5.Reichling J, Harkenthal M, Saller R. In-vitro-Untersuchungen zur antimikrobiellen Wir- kung ausgewählter ätherischer Öle. Erfahrungsheilkunde 1999; 48:357–366.
6.Yousef R, Tawil G. Antimicrobial activity of volatile oils. Pharmazie 1980; 35:698–701.
7.Dorman H-J, Deans SG. Antimicrobial agents from plants: antibacterial activity of plant volatile oils. J Appl Microbiol 2000; 88:308–316.
8.Takarada K, Kimizuka R, Takahashi N, et al. A comparison of the antibacterial efficacies of essential oils against oral pathogens. Oral Microbiol Immunol 2004; 19:61–64.
9.Hammer K, Carson CF, Riley TV. In-vitro activity of essential oils, in particular Melaleuca alternifolia (tea tree) oil and tea tree oil products against Candida ssp. Antimicrob Agents Chemother 1998; 42:591–595.
10.Longbottom C, Carson CF, Hammer KA, et al. Tolerance of Pseudomonas aeruginosa to Melaleuca alternifolia (tea tree) oil is associated with the outer membrane and energy dependent cellular processes. Antimicrob Agents Chemother 2004; 54:386–392.
11.Pattnaik S, Subramanyam VR, Rath CC. Effect of essential oil on the viability and morphology of Escherichia coli (SP-11). Microbios 1995; 84:195–199.
12.Harkenthal M, Lay-Schmitt G, Reichling J. Effect of Australian tea tree oil on the viability of the wall-less bacterium Mycoplasma pneumoniae. Pharmazie 2000; 55:380–384.
13.Cox S, Gustafson JE, Mann CM, et al. Tea tree oil causes K+ leakage and inhibits respiration in Escherichia coli. Lett Appl Microbiol 1998; 26:355–358.
14.Cox S, Mann CM, Bell HC, et al. The mode of antiviral action of the essential oil of Melaleuca alternifolia (tea tree oil). J Appl Microbiol 2000; 88:170–175.
15.Knobloch K, Weigand H, Weis N, et al. Action of terpenoids on energy metabolism. In: Brunke E, ed. Progress in Essential Oil Research. Berlin: Walter de Gruyter, 1986: 429–445.
16.Inoue Y, Shiraishi A, Hada T, et al. The antibacterial effects of terpene alcohols on Staphylococcus aureus and their mode of action. FEMS Microbiol Lett 2004; 237:25–331.
17.Helander I, Alakomi H-L, Lavata-Kala K, et al. Characterization of the action of selected essential oil components on gram-negative bacteria. J Agric Food Chem 1998; 46: 3590–3595.
18.Oussalah M, Caillet S, Lacroix M. Mechanism of action of Spanish oregano, Chinese cinnamon, and savory essential oils against cell membranes and walls of Escherichia coli O157:H7 and Listeria monocytogenes. Can J Food Prot 2006; 69:1046–1055.
416 |
Schäfer et al. |
19.Carson C, Mee BJ, Riley TV. Mechanism of action of Melaleuca alternifolia (tea tree) oil on Staphylococcus aureus determined by time-kill, lysis, leakage, and salt tolerance assays and electron microscopy. Antimicrob Agents Chemother 2002; 46:1914–1920.
20.Reichling J, Harkenthal M, Geiss HK, et al. Electron microscopic investigation on the antibacterial effects of Australian tea tree oil against Staphylococcus aureus. Curr Top Phytochem 2002; 5:77–84.
21.Gustafson J, Liew YC, Chew S, et al. Effects of tea tree oil on Escherichia coli. Lett Appl Microbiol 1998; 26:194–198.
22.Ogunlana E, Höglund G, Onawunmi G, et al. Effects of lemongrass oil on the mor phological characteristics and peptidoglycan synthesis of Escherichia coli. Microbios 1987; 50:43–49.
23.Horne D., Holm M, Oberg DG, Antimicrobial effects of essential oils on Streptococcus pneumoniae. J Essential Oil Res 2001; 13:387–392.
24.Rhayour K, Bouchikhi T, Tantaoui-Elaraki A, et al. The mechanism of bactericidal action of oregano and clove essential oils and their phenolic major components on Escherichia coli and Bacillus subtilis. J Essential Oil Res 2003; 15:356–362.
25.Jassim S, Naji MA. Novel antiviral agents: a medicinal plant perspective. J Appl Micro- biol 2003; 95:412–435.
26.Siddiqui Y, Ettayebi M, Hadlab AM, et al. Effect of essential oils on the enveloped viruses: antiviral activity of oregano and clove oils on herpes simplex virus type 1 and Newcastle disease virus. Med Sci Res 1996; 24:187–188.
27.Hayashi K, Kamiya M, Hayashi T. Virucidal effects of the steam distillate from Houttuynia cordata and its components on HSV-1, influenza virus, and HIV. Planta Med 1994; 61:237– 241.
28.Schumacher A, Reichling J, Schnitzler P. Virucidal effect of peppermint oil on the en veloped viruses herpes simplex virus type 1 and type 2 in vitro. Phytomedicine 2003; 10:504–510.
29.Reichling J, Koch C, Stahl-Biskup E, et al. Virucidal activity of a beta-triketone-rich es sential oil of Leptospermum scoparium (manuka oil) against HSV-1 and HSV-2 in cell culture. Planta Med 2005; 71:1123–1127.
30.Minami M, Kita M, Nakaya T, et al. The inhibitor effect of essential oils on Herpes simplex virus type-1 replication in vitro. Microbiol Immunol 2003; 47: 681–684.
31.Benencia F, Courreges MC. Antiviral activity of sandalwood oil against Herpes simplex viruses-1 and -2. Phytomedicine 1999; 6:119–123.
32.Garcia C, Talarico L, Almeida N, et al. Virucidal activity of essential oils from aromatic plants of San Luis, Argentina. Phytother Res 2003; 17:1073–1075.
33.De logu A, Loy G, Pellerano ML, et al. Inactivation of HSV-1 and HSV-2 and prevention of cell-to-cell virus spread by Santolina insularis essential oil. Antiviral Res 2000; 48:177–
185.
34.Koch C. Antivirale Effekte ausgewählter ätherischer Öle auf behüllte Viren unter beson- derer Berücksichtigung des Herpes simplex Virus Type 1 und 2. Thesis, University of Heidelberg, 2005.
35.Benencia F, Courreges MC. In vitro and in vivo activity of eugenol on human herpesvirus. Phytother Res 2000; 14:495–500.
36.Edman B. The influence of shaving method on perfume allergy. Contact Dermatitis 1994; 31(5):291–292.
37.Bronaugh RL, Stewart RF, Wester RC, et al. Comparison of percutaneous absorption of fragrances by humans and monkeys. Fd Chem Toxicol 1985; 23(1):111–114.
38.Strähli, W., Dissertation Bern 1940, ref. in Gildemeister, E., Hoffmann, Fr. - “Die Ätheri- schen Öle”, Berlin: Akademie-Verlag 1956, Bd. I, 114.
39.Fuchs N, Jaeger W, Lenhardt A, et al. Systemic absorption of topically applied carvone: influence of massage technique. J Cosmet Sci 1997; 48(6):277–282.
40.Lademann J, Richter H, Schaefer UF, et al., Hair follicles—A long-term reservoir for drug delivery. Skin PharmPhys 2006; 19:232–236.
41.Schuster O, Haag F, Priester H. Transdermal absorption of terpenes from essential oils of Pinimenthol-S ointment. Med Welt 1986; 37(4):100–102.
42.Kovar KA, Gropper B, Friess D, et al. Blood levels of 1,8-cineole and locomotor activity of mice after inhalation and oral administration of rosemary oil. Planta Med, 1987; 53(4):315–318.

Efficacy, Absorption, and Safety of Essential Oils |
417 |
43.Buchbauer G, Jirovetz L, Jaeger W, et al. Aromatherapy: evidence for sedative effects of the essential oil of lavender after inhalation. Z Naturforsch. C, 1991; 46(11–12): 1067–1072.
44.Buchbauer G, Jaeger W, Jirovetz L, et al., Effects of valerian root oil, borneol, isoborneol, bornyl acetate and isobornyl acetate on the motility of laboratory animals (mice) after inhalation. Pharmazie 1992; 47(8):620–622.
45.Ceschel GC, Maffei P, Moretti MDL, et al. In vitro permeation through porcine buccal mucosa of Salvia sclarea L. essential oil from topical formulations. STP Pharma Sci 1998; 8(2): 103–106.
46.Schaefer U, Loth H. An ex-vivo model for the study of drug penetration into human skin. Pharm Res 1996; 13(9 Suppl.):S-366.
47.Kligman AM, Christophers E. Preparation of isolated sheets of stratum corneum. Arch Dermatol 1963; 88:702–705.
48.Reichling J, Landvatter U, Wagner H, et al. In vitro studies on release and human skin permeation of Australian tea tree oil (TTO) from topical formulations. Eur J Pharm Bio- pharm 2006; 64:222–228.
49.Syed TA, Qureshi ZA, Ali SM, et al., Treatment of toenail onychomycosis with 2% butenafine and 5% Melaleuca alternifolia (tea tree) oil in cream. Trop Med Int Health 1999; 4(4):284–287.
50.Bassett IB, Pannowitz DL, Barnetson RSC. A comparative study of tea-tree oil versus benzoylperoxide in the treatment of acne. Med J Aust 1990; 153(8):455–456.
51.Carson CF, Ashton L, Dry L, et al. Melaleuca alternifolia (tea tree) oil gel (6%) for the treatment of recurrent herpes labialis (5). J Antimicrob Chemother 2001; 48(3):450–451.
52.Schnitzler P, Schön, K, Reichling, J. Antiviral activity of Australian tea tree oil and eucalyptus oil against herpes simplex virus in cell culture. Pharmazie 2001; 56:343–347.
53.Wagner H, Kostka KH, Adelhardt W, et al. Effects of various vehicles on the penetration of flufenamic acid into human skin. Eur J Pharm Biopharm 2004; 58(1):121–129.
54.Iten F, Saller R, Reichling J. Sind Naturprodukte mit Methyleugenol kanzerogen? Dtsch Apoth Ztg 2004; 144:3192–3199.
55.Williams A, Barry BW. Terpenes and the lipid-protein-partitioning theory of skin pene tration enhancers. Pharm Res 1991; 8:17–24.
56.Williams A, Barry BW. The enhancement index concept applied to terpene penetration enhancers for human skin and model lipophilic (oestradiol) and hydrophilic (5-fluoruracil) drugs. Int J Pharm 1991; 74:157–168.
57.Medi B, Singh S, Singh J. Assessing efficacy of penetration enhancers. In: Riviere J, ed. Dermal Absorption Models in Toxicology and Pharmacology. Boca Raton: Taylor & Francis, 2006:213–249.
58.Monti D, Chetoni P, Burgalassi S, et al. Effect of different terpene-containing essential oils on permeation of estradiol through hairless mouse skin. Int J Pharm 2002; 237:209–214.
59.Cal K. Skin penetration of terpenes from essential oils and topical vehicles. Planta Med 2006; 72:311–316.
60.de Groot AC, Frosch PJ. Adverse reactions to fragrances. A clinical review. Contact Dermatitis 1997; 36(2):57–86.
61.Monajemi R, Oryan S, Haeri-Roohani A, et al. Cytotoxic effects of essential oils of some Iranian citrus peels. Iranian J Pharm Res 2005; 4:183–187.
62.Ahmed A. Cytotoxic potentialities of essential oils. Mansoura J Pharm Sci 2001; 17:38–50.
63.OECD. Detailed Review on Classification Systems for Eye Irritation/Corrosion in OECD Member Countries. Paris, France: OECD Publication Office, 1999.
64.Weil CS, Scala RA. Study of intraand interlaboratory variability in the results of rabbit eye and skin irritation tests. Toxicol Appl Pharmacol 1971; 19(2):276–360.
65.OECD. Guideline for Testing Chemicals No 405: “Acute Eye Irritation/Corrosion.” Paris, France: OECD Publication Office, 1987.
66.Luepke NP. Hen’s egg chorioallantoic membrane test for irritation potential. Food Chem Toxicol 1985; 23(2):287–91.
67.ECVAM. INVITTOX Protocol No 47 HET-CAM-Test. 1992.
68.NICEAM. Draft Background Review Document—Current status of in vitro test methods for identifying ocular corrosives and severe irritants: The HET-CAM-Test-Chorioallantoic Membrane (HET-CAM-Test Method). 2004.

418 |
Schäfer et al. |
69.Reichling J, Harkenthal M, Landvatter U, et al. Ätherische Öle im HET-CAM-Test. Dtsch Apoth Ztg 2000; 41:42–48.
70.Möller M, Suschke U, Nolkemper S, et al. Antibacterial, antiviral, antiproliferative and apoptosis-inducing properties of Brackenridgea zanguebarica (Ochnaceae). J Pharm Pharmacol 2006; 58:1131–1138.
71.Safety (MSDS) data for clove oil. (Accessed October 11, 2005, at www.sciencelab.com/ xMSDS-Clove_oil-9927498), (2006).


Sunscreens: Efficacy, Skin Penetration, and Toxicological Aspects |
423 |
SPF = MEDprotected/MEDunprotected.
That is, the UVR energy required to produce a minimal erythemal dose (MED) on protected skin (with 2 mg/cm2 of the sunscreen) divided by the UVR energy required to produce a MED on unprotected skin (7). The MED is the smallest dose of UVR (J m2) that produces redness with clearly defined borders at the exposure site: often measured as the exposure time required to cause erythema. As erythema is caused primarily by UVB, the SPF value provides an indication of the sunscreen products’ effectiveness to prevent UVB-induced sunburn, but there is no assess- ment of its UVA protection. A number of methods to assess UVA effectiveness have been suggested, including the “Boots Star System” invented by Diffy (8). The Eu- ropean Commission has recently launched an initiative to improve the labeling of sunscreen products from 2007, including standardized labeling of UVA protection (9,10).
In the United States, the Food and Drug Administration (FDA) has approved
17 sunscreen agents as over-the-counter medications (7). European Union regulators permit the use of 28 sunscreens (11), and in Australia the Therapeutic Goods Ad- ministration has approved 28 sunscreen agents with a further 4 under review (12).
The sunscreen actives available in each of these jurisdictions are listed in Table 1, and the major sunscreen manufacturers are listed in Table 2. All but two of the ap- proved sunscreens are organic or chemical filters, with only titanium dioxide (TiO2) and zinc oxide (ZnO) inorganic or physical filters. Organic sunscreens act through chemical excitation by UVR, whereby incident UVR is absorbed and then dissipated as longer wavelength energy, thereby protecting the skin from a potentially dam- aging dose of UVR. They are classified into either UVA or UVB filters, with some absorbing in both ranges (Table 1). Inorganic sunscreens block UVA/UVB sunlight through reflection and scattering but have also been shown to absorb considerable
UVR. Sunscreen products are generally formulated with a combination of organic sunscreens and may also include an inorganic filter (13). In this way, the sunscreen product is effective in reducing skin exposure to a broad spectrum of UVR.
Organic UV Filters
UVB filters include the para-aminobenzoic acid (PABA) derivatives, cinnamates, salicylates, and camphor derivatives. PABA is a water-soluble UVB filter that has been in extensive use since the 1940s. It is now less frequently used as it stains clothing and is the most commonly reported contact and photoallergen in sunscreens
Table 2 Sunscreen Active Manufacturers and Common
Trade Names
Trade name |
Manufacturer |
|
|
Mexoryl |
L’Oreal |
Eusolex |
Merck |
Neo Heliopan |
Symrise (formerly Haarmann & Reimer) |
Uvinul |
BASF |
Escalol |
ISP |
Tinosorb |
Ciba |
Parsol |
Roche |
Uvasorb |
3V-Sigma |
Unisol |
Induchem |
|
|

424 |
Benson |
(14–17). Octyl dimethyl PABA (padimate O) is a UVB filter with a better safety re- cord than PABA and is the most commonly used derivative.
Octyl methoxycinnamate is the most widely used UVB filter. It is a less effec- tive UVB absorber than PABA and requires formulation with additional UVB filters to achieve a high SPF. Octyl methoxycinnamate is reported to degrade following ex- posure to sunlight, leading to a decrease in efficacy (18) and potential photocontact sensitization (19,20). It is generally formulated with other UV filters to enhance its photostability. Cinoxate is an infrequently used cinnamate derivative.
The salicylate sunscreens, octyl salicylate, homosalate, and trolamine salicy- late are weak UVB absorbers, generally used in combination to augment the effect of other UVB filters. They may also be included to minimize the photodegradation of other sunscreen agents in the product. In addition, trolamine salicylate is water soluble and therefore can be easily washed off the skin.
Octocrylene is a UVB absorber with good photostability and is generally used in combination with other organic and inorganic filters to enhance the pho- tostability of the final product. Most camphor derivatives are moderately effective
UVB sunscreens, with the exception of tetraphthalylidene dicamphor sulfonic acid, which is a broad UVA filter.
Dimethicodiethylbenzal malonate (Parsol SLX) is a UVB filter recently in- troduced globally (except the United States) by DSM Nutritional Products, Swit- zerland. It is larger than conventional organic sunscreens, consisting of organic chromophores attached to a polysiloxane chain. The silicone chain has an affinity to the skin, thereby retaining the UV filter at the skin surface to reduce skin pen- etration while optimizing substantivity. It also photostabilizes avobenzone and is particularly useful in sun protectant hair products.
UVA filters include benzophenones, anthranilates, and dibenzoylmethanes. Oxybenzone is the most commonly used benzophenone, absorbing both UVA and
UVB (although it has two λmax: 288 and 325 nm, absorption is more efficient in the
UVB region). It has the disadvantage that it is photolabile and can be rapidly oxidized leading to inactivation of antioxidant systems (21). It has also been shown to be absorbed systemically following topical application (22).
Butyl methoxydibenzoylmethane (avobenzone) provides broad spectrum
UVA filtration (up to λ 380 nm) but quickly loses potency on the skin. Photopro- tective capacity decreases by 50–60% after one hour of exposure to sunlight (23). Consequently oxybenzone and avobenzone are formulated with other filters to en- hance their photostability (24). However, avobenzone was reported to enhance the degradation of octyl methoxycinnamate (25), therefore careful selection of UV filter combinations is required. Menthyl anthranilate is a weak UVA filter (26).
Some effective UVA filters, used in Europe, Australia and elsewhere, are not included in the 1999 FDA monograph. Of these, terephthalydene dicamphor sul- fonic acid (ecamsule; Mexoryl SX) has recently been approved by the FDA (Jul 2006) and is the first new organic sunscreen in the United States for 18 years. It is
aphotostable, broad-spectrum UVA filter which has been shown to prevent UVAinduced histological changes associated with photoaging in the skin (27,28). It also provides more effective suppression of UVR-induced carcinogenesis in mice than
aUVB filter alone (29). Drometriazole trisiloxane (Mexoryl XL) is a photostable UVA/UVB filter consisting of two chemical groups: 12-hydroxyphenylbenzotri- azole, which is a UVR filter active, and a liposoluble silicone chain. It has been sug- gested that sunscreen products incorporating these Mexoryl filters may be more effective in preventing the induction of lesions in patients with photosensitive lu-

Sunscreens: Efficacy, Skin Penetration, and Toxicological Aspects |
425 |
pus erythematosus than products containing avobenzone and TiO2 as the UVA filters (30).
Methylene-bis-benzotriazolyl tetramethylbutylphenol and bis-ethylhexyloxy- phenol methoxyphenol triazine are broad-spectrum UVA/UVB filters developed by Ciba Specialty Chemicals (Switzerland) under the trade names Tinosorb M and Tinosorb S, respectively. Tinosorb M combines the benefits of organic and inorganic filters and is reported to be more effective than other UVA filters (31). It is a large, photostable, organic molecule that is formulated as microfine particles in the aque- ous phase of the sunscreen emulsion. It absorbs UVR and dissipates the energy in a similar mechanism to other organic filters, but also scatters and reflects UVR. Tino- sorb S is an oil-soluble equivalent with similar photostability and broad spectrum
UVR absorbing activity. Both are effective filters and can enhance the stability of other UV filters such as octyl methoxycinnimate and avobenzone (25). Due to their particle size, skin penetration of these organometallic sunscreens is unlikely. In addition, they do not possess intrinsic estrogenic/antiestrogenic or androgenic/antiandrogenic activity in vitro (32).
Inorganic UV Filters
Inorganic UV filters, zinc oxide and titanium dioxide act by scattering, reflecting and/or absorbing UVR (33,34) dependent on their refractive index, the size of the particles, dispersion in the emulsion and film thickness (35). The drawback of inor- ganic mineral sunscreens is that they are opaque on the skin. To improve cosmetic acceptability, particle size can be reduced to 20-50 nm, rendering them transparent to visible radiation (36), but this also reduces their ability to scatter and reflect UVR. The availability of microfine ZnO (for example Z-cote from BASF and Zin-Clear from Advanced Nanotechnology Ltd, Australia) and TiO2 has increased the formu- lation of these inorganic filters in sunscreen products, thus permitting high SPF val- ues and broad spectrum absorption, with reduced amounts of organic filters.
Formulation Approaches to Improve Photostability of UV Filters
Although the recently developed organic filters are photostable, many of the older organic filters, particularly avobenzone, octyl methoxycinnamate and padimate O, are photolabile. A number of approaches have been developed to improve pho- tostability. This has involved judicious combinations with ZnO, TiO2, octocrylene, the salicylates, methylbenzylidene camphor and Tinosorb. In order to protect these filters, novel formulation methods have been investigated including complexation with cyclodextrins (37,38), encapsulation in lipospheres (39), nanoparticles (40,41) and microspheres (42). Oxonica (Oxfordshire, U.K.) has recently introduced Optisol, an ultrafine TiO2 with 0.7% manganese in the crystal, which eliminates the potential of the TiO2 to generate free radicals (43).
SKIN PERMEATION OF SUNSCREENS
Sunscreen products are applied to large areas of the skin repeatedly, in the case of beach application, or on a daily basis to the face and other areas of the skin in personal care and cosmetic products. To provide effective sun protection to the skin, sunscreens need to reside on or near the skin surface. There is no therapeutic requirement for systemic absorption of UV filters; therefore, determination of the skin absorption of sunscreens is essential in their risk assessment. Various factors,
426 |
Benson |
such as the nature of the formulation, can influence the skin absorption of topically applied chemicals, so it is essential that sunscreen skin absorption is measured in well-designed in vitro or in vivo studies (a summary of reported studies can be found in Table 3).
In Vivo Dermal Absorption Studies
Urinary excretion of oxybenzone and its metabolites was monitored for 48 hours following the administration of a commercial sunscreen product containing 6% oxybenzone to the forearms of healthy human volunteers for a 10-hour period (22). Approximately 1–2% of the applied dose was excreted in the urine, and there was considerable intersubject variability in skin absorption (Fig. 1). In this study, the product application rate was 12.4 mg/cm2, which is considerably greater than the application rate recommended for SPF assessment (2 mg/cm2). Benson et al. (44) demonstrated that oxybenzone absorption was up to four times greater through face skin than through back skin. Gustavsson Gonzalez et al. reported that about 10 mg (0.5% of the applied dose) of oxybenzone was recovered in the urine of healthy volunteers over 48 hours following the whole body application of an SPF 14 sun- screen lotion containing 4% oxybenzone (45). On repeated application of the sun- screen, morning and night, for five days, 1.2–8.7% (mean 3.7%) of the total amount of applied oxybenzone was excreted in urine over 10 days from the initial application (46). The authors concluded that absorption and accumulation in the body were substantial as the volunteers excreted oxybenzone up to five days after the last application. Oxybenzone has also been detected in human breast milk following topical application (47).
Feldman and Maibach (48) reported that 28% of the dose (4 µg/cm2) of PABA applied to human skin was excreted in the urine over five days. The sunscreen was dissolved in acetone that evaporated to deposit the PABA on the skin surface, a method of application that is likely to overestimate absorption relative to applica- tion in a more conventional sunscreen product. Lower skin absorption rates were reported by Arancibia et al. (49), who applied 5% PABA in three different formu- lations to large body surface areas of six human male volunteers and monitored urinary excretion. They reported no difference in skin absorption from the three formulations (hydroalcoholic gel and oil-in-water emulsions at pH 4.2 and 6.5), but there was considerable variation between subjects, with 1.6% to 9.6% of the applied dose absorbed.
Dupuis et al. reported that a linear relationship exists between drug concentration in the stratum corneum, determined by tape stripping, and in vivo percutaneous absorption, determined by urinary excretion (50). Treffel and Gabard used the tape- stripping technique to assess the skin absorption of oxybenzone, octyl methoxycinnimate, and octyl salicylate from an emulsion gel and petroleum jelly (51). There were significantly greater amounts of all sunscreen actives in the stratum corneum at 0.5 hours post-application of the emulsion gel than the petroleum jelly (Fig. 2). These epidermal retention data were confirmed in a parallel in vitro study. Only oxyben- zone was detected in appreciable quantities in the dermis and receptor fluid.
The systemic absorption of the new sunscreen terephthalylidine dicamphor sulfonic acid (Mexoryl SX) was determined following application to human skin in an emulsion formulation for four hours (52). Urinary recovery of 0.014% was obtained. In vitro absorption, following a similar four-hour application period, was 0.16% of the applied dose over 24 hours.


430 |
|
|
|
|
|
|
|
|
Benson |
|
|
|
Flux |
Infinite Dosing |
Retention |
|
|
|
|||
FluxEpidermalHumanEstimated |
)(µg/hr/cm2 |
4.5 |
RetentionEpidermalHumanRelative |
(µg) |
35 |
|
|
|
||
4.0 |
|
|
|
|
|
|
||||
|
|
|
|
|
|
|
|
|
|
|
|
|
|
|
|
|
|
30 |
|
|
|
|
|
3.5 |
|
|
|
|
|
|
|
|
|
|
3.0 |
Finite Dosing |
|
|
25 |
|
|
|
|
|
|
|
|
|
|
|
|
|
|
|
|
|
2.5 |
|
|
|
|
20 |
|
|
|
|
|
2.0 |
|
|
|
|
15 |
|
|
|
|
|
|
|
|
|
|
|
|
|
|
|
|
1.5 |
|
|
|
|
10 |
|
|
|
|
|
|
|
|
|
|
|
|
|
|
|
|
1.0 |
|
|
|
|
|
|
|
|
|
|
0.5 |
|
|
|
|
5 |
|
|
|
|
|
|
|
|
|
|
|
|
|
|
|
|
0.0 |
|
|
|
|
0 |
|
|
|
|
|
68000 |
180000 |
430000 |
1600000 |
|
68000 |
180000 |
430000 |
1600000 |
Formulation Viscosity (cps)
(A)
INFINITE DOSE (THICK FORMULATION)
Initially |
At end of study |
low viscosity |
high viscosity |
Even |
Solute |
diffusing |
|
throughout |
within |
|
formulation |
Epidermis |
High gradient with much Light gradient which only lower levels near skin slightly changes near skin
FINITE DOSE (THIN “IN USE” FORMULATION)
Initially |
At end of study |
|
|
low viscosity Evaporation |
higher viscosity |
|
Index |
emulsions |
|
|
Epidermis |
|
|
High evaporation index |
Hydration |
|
|
Low evaporation index |
|
Lower epidermal hydration |
Higher epidermal hydration |
|
(B)
Figure 4 (A) Effect of formulation viscosity on epidermal flux and retention of oxybenzone. (B) Diagrammatic representation of possible processes involved. Source: From Ref. 62.
48 hours was higher for a hydroalcoholic solution than for an oil-in-water emulsion (32.77% and 17.18% of applied dose, respectively).
Gupta et al. (60) reported that the penetration of oxybenzone and octyl me- thoxycinnimate into and across micro-Yucatan pig skin was higher when the sunscreens were applied in combination than when each was applied alone. It has also been reported that the flux and permeability coefficient of oxybenzone is related to vehicle solubility parameter and that alcohol appears to enhance skin and membrane diffusivity (44,61). Increasing the viscosity of a vehicle decreased penetration flux under infinite dosing conditions but had the opposite effect on flux following in-use

Sunscreens: Efficacy, Skin Penetration, and Toxicological Aspects |
431 |
(or finite) doses (Fig. 4A) (62). The authors suggested that the reduced penetration in the infinite dosing case reflected a diminished diffusivity of sunscreen in the ve- hicle. In contrast, a high-viscosity product under in-use conditions was postulated to have promoted penetration via increased stratum corneum hydration (Fig. 4B). The results confirm that skin permeation studies should be conducted under in-use conditions to more closely represent the application conditions in practice. Risk as- sessment for a UV filter in the European Union is based on the application of 2 mg/ cm2 of a sunscreen product to the skin (63).
Microfine ZnO and TiO2 were applied to porcine skin in vitro and penetration assessed by the analysis of receptor fluid, tape strips, and surface washes. Virtually all applied ZnO was recovered in the first five tape strips, and almost all applied TiO2 was recovered in the washes (64). Cross et al. (65) recently reported that less than 0.03% of applied Zn penetrated the human epidermis, following in vitro ap- plication of ZnO as Zin-Clear (26–30 nm particles). No particles were detected in the lower stratum corneum or viable epidermis by electron microscopy.
Of concern is the potential of some sunscreen actives to act as penetration enhancers. Pont et al. reported that a number of sunscreen actives and the insect-re- pellent DEET enhanced the penetration of the herbicide 2,4-dichlorophenoxyacetic acid across hairless mouse skin in vitro (66,67). In a further study, incorporation of inorganic filters and change of vehicle were shown to counteract the penetra- tion enhancement ability of organic UV filters (66). Although hairless mouse skin is known to be more sensitive to penetration enhancers, the authors suggested that similar effects were seen in human skin. Morgan et al. (68) reported that octyl sa- licylate increased testosterone skin permeation 6.3-fold and padimate O increased permeation of testosterone, estradiol, and progesterone by 2.4-, 3.5-, and 9.3-fold, respectively. Indeed, this has been used as the basis for a new transdermal delivery technology being developed by Acrux Pty. Ltd., Australia
BENEFITS AND RISKS OF TOPICAL SUNSCREENS
Acute toxic side effects of specific sunscreen agents include contact irritation, al- lergic contact dermatitis, phototoxicity, photoallergy, and staining of the skin (69). However, considering the widespread use of sunscreens, the incidence of side effects is small. Based on the in vitro and in vivo data, the amount of sunscreen that permeates the skin is minimal, even for oxybenzone, and negligible for the more lipophilic sunscreens and inorganic filters. Modern sunscreens must meet rigorous testing for photostability, acute, subchronic, and chronic toxicity, irritation, sensitization, phototoxicity, photosensitization, reproductive toxicity, genotoxicity, pho- togenotoxicity, and carcinogenicity prior to approval (6,63). Modern sunscreens are designed for skin retention and water resistance so that skin permeation is minimal.
This is exemplified by the recently introduced Mexoryl and Tinosorb UV filters.
There have been some controversies regarding sunscreen use. Concerns regarding reduced vitamin D synthesis in long-term sunscreen use have been shown to be insignificant (70). Considerable media coverage followed the suggestion that UV filters, in particular octyl methoxycinnamate and 4-methylbenzylidene cam- phor, may have estrogenic activity (71). However the Scientific Committee of Cos- metic Products and Non-food Products, a European Commission advisory body, questioned the experimental protocols and concluded that the relative estrogenic potencies of the UV filters were about 1 million times less than that of the positive control substance estradiol (72).

432 |
Benson |
Sunscreen products have been used extensively for many years with little clin- ical evidence of toxicity. They play a valuable role in reducing the risks associated with exposure to solar radiation such as sunburn, photoaging, and skin cancer. The most recently introduced UV filters have been specifically designed to improve ef- ficacy and safety through broad UVR absorption, photostability, and skin binding. The risk/benefit assessment clearly favors the use of topical sunscreen products as part of our defense against UVR-induced skin damage.
CONCLUSIONS
Modern sunscreen products are designed to provide long-lasting protection from the absorption of UVA and UVB radiation to viable skin tissues. Whereas assessment of their ability to absorb UVB has been available for some time in the form of the SPF value, a rating for UVA efficacy has only recently been introduced. It has been suggested that an immune protection factor should also be included in the assessment of sunscreens. Hamilton Laboratories, an Australian sunscreen manu- facturer, has recently introduced a product with enhanced protection from UV- induced immunosuppression, denoted the “Hamilton Optimal Enhanced Protection
Sunscreen” (73). There is evidence that oxybenzone permeates the skin following administration in sunscreen products, but there is no evidence that this is related to toxic consequences. Permeation to viable tissues of the more lipophilic sunscreens and inorganic filters is negligible. All common sunscreens penetrate into the stra- tum corneum, but the extent to which permeation to deeper tissues occurs over time has not been established. The affinity of highly lipophilic sunscreens for the stratum corneum confers an ability to resist removal by water, which is important to ensure that a sunscreen product remains effective after swimming or sweating. One of the most significant health concerns is obesity, particularly the rapid increase in childhood obesity rates. Regular exercise in the outdoors is essential for a healthy lifestyle, yet there is clear evidence that exposure to UVR can cause acute and long- term skin damage. Topical sunscreen products are an effective part of the overall sun protection regimen. The continued development of UV filters with improved efficacy and safety is essential.
REFERENCES
1.Schaefer H, Moyal D, Fourtanier A. Recent advances in sun protection. Semin Cutan Med Surg 1998; 17:266–275.
2.Gil EM, Kim TH. UV-induced immune suppression and sunscreen. Photodermatol Pho toimmunol Photomed 2000; 16:101–110.
3.Pearse AD, Gaskell SA, Marks R. Epidermal changes in human skin following irradiation with either UVB or UVA. J Invest Dermatol 1987; 88:83–87.
4.Moyal D, Fourtanier A. Acute and chronic effects of UV on skin. In: Rigel DS, Weiss RA, Lim HW, et al., eds. Photoaging. New York: Marcel Dekker Inc; 2004:15–32.
5.Phan TA, Halliday GM, Barnetson RS, et al. Spectral and dose dependence of ultraviolet radiation-induced immunosuppression. Front Biosci 2006; 11:394–411.
6.Kullavanijaya P, Lim HW. Photoprotection. J Am Acad Dermatol 2005; 52:937–958.
7.FDA. Part 352—Sunscreen drug products for over-the-counter-human use: final mono graph. Fed Regist 1999; 64:27687–27693.
8.Lowe NJ. An overview of ultraviolet radiation, sunscreens, and photo-induced derma toses. Dermatol Clin 2006; 24:9–17.
9.European Commission. Sunscreen products: what matters? MEMO/06/185 May 2006.

Sunscreens: Efficacy, Skin Penetration, and Toxicological Aspects |
433 |
10.European Commission. Sunscreens: commission moves to improve labeling. IP/06/571 May 2006.
11.EU. List of UV filters which cosmetic products may contain, Council Directive 76/768 EEC, Annex VII. European Union 1976; and amendments inclusive to 2005/80/EC.
12.TGA. Sunscreening agents permitted as active ingredients in listed products. Therapeutic Goods Administration, Australia 2006 (Accessed September 26, 2007, at http://www.tga
.gov.au/docs/pdf/argom_10.pdf).
13.Lademann J, Schanzer S, Jacobi U, et al. Synergy effects between organic and inorganic UV filters in sunscreens. J Biomed Opt 2005; 10:14008.
14.Horio T, Higuchi T. Photocontact dermatitis from p-aminobenzoic acid. Dermatologica 1978; 156:124–128.
15.Thune P, Jansen C, Wennersten G, et al. The Scandinavian multicenter photopatch study 1980–1985: final report. Photodermatology 1988; 5:261–269.
16.van Ketel WG. Allergic contact dermatitis from an aminobenzoic acid compound used in sunscreens. Contact Dermatitis 1977; 3:283.
17.Marmelzat J, Rapaport MJ. Photodermatitis with PABA. Contact Dermatitis 1980; 6:230–
231.
18.Tarras-Wahlberg N, Stenhagen G, Larko O, et al. Changes in ultraviolet absorption of sunscreens after ultraviolet irradiation. J Invest Dermatol 1999; 113:547–553.
19.Kimura K, Katoh T. Photoallergic contact dermatitis from the sunscreen ethylhexyl-p- methoxycinnamate (Parsol MCX). Contact Dermatitis 1995; 32:304–305.
20.Schmidt T, Ring J, Abeck D. Photoallergic contact dermatitis due to combined UVB (4- methylbenzylidene camphor/octyl methoxycinnamate) and UVA(benzophenone-3/butyl methoxydibenzoylmethane) absorber sensitization. Dermatology 1998; 196:354–357.
21.Schallreuter KU, Wood JM, Farwell DW, et al. Oxybenzone oxidation following solar irradiation of skin: photoprotection versus antioxidant inactivation. J Invest Dermatol 1996; 106:583–586.
22.Hayden CG, Roberts MS, Benson HAE. Systemic absorption of sunscreen after topical application. Lancet 1997; 350:863–864.
23.Bouillon C. Recent advances in sun protection. J Derm Sci 2000; 23(Suppl. 1):S57–S61.
24.Pathak MA. Sunscreens: progress and perspectives on photoprotection of human skin against UVB and UVA radiation. J Dermatol 1996; 23:783–800.
25.Chatelain E, Gabard B. Photostabilization of butyl methoxydibenzoylmethane (Avo benzone) and ethylhexyl methoxycinnamate by bis-ethylhexyloxyphenol methoxyphenyl triazine (Tinosorb S), a new UV broadband filter. Photochem Photobiol 2001; 74:401–406.
26.Beeby A, Jones AE. The photophysical properties of menthyl anthranilate: a UV-A sunscreen. Photochem Photobiol 2000; 72:10–15.
27.Seite S, Moyal D, Richard S, et al. Mexoryl SX: a broad absorption UVA filter protects human skin from the effects of repeated suberythemal doses of UVA. J Photochem Photobiol B 1998; 44:69–76.
28.Seite S, Colige A, Piquemal-Vivenot P, et al. Afull-UV spectrum absorbing daily use cream protects human skin against biological changes occurring in photoaging. Photodermatol Photoimmunol Photomed 2000; 16:147–155.
29.Fourtanier A. Mexoryl SX protects against solar-simulated UVR-induced photocarcino genesis in mice. Photochem Photobiol 1996; 64:688–693.
30.Stege H, Budde MA, Grether-Beck S, et al. Evaluation of the capacity of sunscreens to photoprotect lupus erythematosus patients by employing the photoprovocation test.
Photodermatol Photoimmunol Photomed 2000; 16:256–259.
31.Gelis C, Girard S, Mavon A, et al. Assessment of the skin photoprotective capacities of an organo-mineral broad-spectrum sunblock on two ex vivo skin models. Photodermatol Photoimmunol Photomed 2003; 19:242–253.
32.Ashby J, Tinwell H, Plautz J, et al. Lack of binding to isolated estrogen or androgen receptors, and inactivity in the immature rat uterotrophic assay, of the ultraviolet sunscreen filters Tinosorb M-active and Tinosorb S. Regul Toxicol Pharmacol 2001; 34:287–291.
33.Serpone N, Salinaro A. Terminology, relative photonic efficiencies and quantum yields in heterogeneous photocatalysis: Part I. Suggested protocol. Pure Appl Chem 1999; 71:
303–320.

434 |
Benson |
34.Salinaro A, Emeline A, Zhao J, et al. Terminology, relative photonic efficiencies and quantum yields in heterogeneous photocatalysis: Part II. Experimental determination of quantum yields. Pure Appl Chem 1999; 71:321–335.
35.Murphy GM. Sunblocks: mechanisms of action. Photodermatol Photoimmunol Photomed 1999; 15:34–36.
36.Serpone N, Dondi D, Albini A. Inorganic and organic UV filters: their role and efficacy in sunscreens and suncare products. Inorg Chim Acta 2007; 360(3):794–802.
37.Sarveiya V, Templeton JF, Benson HAE. Inclusion complexation of the sunscreen 2- hydroxy-4methoxy benzophenone (oxybenzone) with hydroxypropyl-b-cyclodextrin: effect on membrane diffusion. J Incl Phenomen Macrocyclic Chem 2004; 49:275–281.
38.Simeoni S, Scalia S, Benson HA. Influence of cyclodextrins on in vitro human skin ab sorption of the sunscreen, butyl-methoxydibenzoylmethane. Int J Pharm 2004; 280:163–
171.
39.Scalia S, Tursilli R, Sala N, et al. Encapsulation in lipospheres of the complex between butyl methoxydibenzoylmethane and hydroxypropyl-[beta]-cyclodextrin. Int J Pharm 2006; 320:79–85.
40.Wissing SA, Muller RH. Solid lipid nanoparticles as carrier for sunscreens: in vitro release and in vivo skin penetration. J Control Release 2002; 81:225–233.
41.Perugini P, Simeoni S, Scalia S, et al. Effect of nanoparticle encapsulation on the photo- stability of the sunscreen agent, 2-ethylhexyl-p-methoxycinnamate. Int J Pharm 2002; 246:37–45.
42.Yener G, Incegul T, Yener N. Importance of using solid lipid microspheres as carriers for UV filters on the example octyl methoxy cinnamate. Int J Pharm 2003; 258:203–207.
43.http://www.oxonica.com/materials/materials_optisol.php
44.Benson HAE, Sarveiya V, Risk S, et al. Influence of anatomical site and topical formulation on skin penetration of sunscreens. Ther Clin Risk Manag 2005; 1:209–218.
45.Gustavsson Gonzalez H, Farbrot A, Larko O. Percutaneous absorption of benzophenone- 3, a common component of topical sunscreens. Clin Exp Dermatol 2002; 27:691–694.
46.Gonzalez H, Farbrot A, Larko O, et al. Percutaneous absorption of the sunscreen benzophenone-3 after repeated whole-body applications, with and without ultraviolet irradiation. Br J Dermatol 2006; 154:337–340.
47.Hany J, Nagel R. Detection of sunscreen agents in human breast milk. Dtsch Lebensmitt Rundsch 1995; 91:341–345.
48.Feldman R, Maibach HI. Absorption of some organic compounds through the skin in man. J Invest Dermatol 1970; 54:399–404.
49.Arancibia A, Borie G, Cornwell E, et al. Pharmacokinetic study on the percutaneous absorption of p-aminobenzoic acid from 3 sunscreen preparations. Farmaco 1981; 36:357–365.
50.Dupuis D, RougierA, Lotte C, et al.An original predictive method for in vivo percutaneous absorption studies. Acta Derm Venereol Suppl 1987; 134:9–21.
51.Treffel P, Gabard B. Skin penetration and sun protection factor of ultra-violet filters from two vehicles. Pharm Res 1996; 13:770–774.
52.Benech-Kieffer F, Meuling WJ, Leclerc C, et al. Percutaneous absorption of Mexoryl SX in human volunteers: comparison with in vitro data. Skin Pharmacol Appl Skin Physiol 2003; 16:343–355.
53.Lademann J, Weigmann H, Rickmeyer C, et al. Penetration of titanium dioxide micro particles in a sunscreen formulation into the horny layer and the follicular orifice. Skin Pharmacol Appl Skin Physiol 1999; 12:247–256.
54.Bennat C, Müller-Goymann CC. Skin penetration and stabilization of formulations containing microfine titanium dioxide as physical UV filter. Int J Cosmet Sci 2000; 22: 271–283.
55.Schulz J, Hohenberg H, Pflucker F, et al. Distribution of sunscreens on skin. Adv Drug Deliv Rev 2002; 54(Suppl. 1):S157–S163.
56.Pflucker F, Wendel V, Hohenberg H, et al. The human stratum corneum layer: an effective barrier against dermal uptake of different forms of topically applied micronised titanium dioxide. Skin Pharmacol Appl Skin Physiol 2001; 14(Suppl. 1):92–97.
57.Watkinson AC, Brain KR, Walters KA, et al. Prediction of the percutaneous penetration of ultra-violet filters used in sunscreen formulations. Int J Cosmet Sci 1992; 14:265–275.

Sunscreens: Efficacy, Skin Penetration, and Toxicological Aspects |
435 |
58.Jiang R, Roberts MS, Collins DM, et al. Absorption of sunscreens across human skin: an evaluation of commercial products for children and adults. Br J Clin Pharm 1999; 48:635–637.
59.Walters KA, Brain KR, Howes D, et al. Percutaneous penetration of octyl salicylate from representative sunscreen formulations through human skin in vitro. Food Chem Toxicol 1997; 35:1219–1225.
60.Gupta VK, Zatz JL, Rerek M. Percutaneous absorption of sunscreens through microyucatan pig skin in vitro. Pharm Res 1999; 16:1602–1607.
61.Jiang R, Benson HAE, Cross SE, et al. In vitro human epidermal and polyethylene membrane penetration and retention of the sunscreen benzophenone-3 from a range of solvents. Pharm Res 1998; 15:1863–1868.
62.Cross SE, Jiang R, Benson HAE, et al. Can increasing the viscosity of formulations be used to reduce the human skin penetration of the sunscreen oxybenzone? J Invest Dermatol 2001; 117:147–150.
63.Nohynek GJ, Schaefer H. Benefit and risk of organic ultraviolet filters. Regul Toxicol Pharmacol 2001; 33:285–299.
64.Gamer AO, Leibold E, van Ravenzwaay B. The in vitro absorption of microfine zinc oxide and titanium dioxide through porcine skin. Toxicol In Vitro 2006; 20:301–307.
65.Cross SE, Innes B, Roberts MS, et al. Human skin penetration of sunscreen nanoparticles: in-vitro assessment of a novel micronised zinc oxide formulation. Skin Pharmacol Physiol 2007; 20:148–154.
66.Pont AR, Charron AR, Brand RM. Active ingredients in sunscreens act as topical penetration enhancers for the herbicide 2,4-dichlorophenoxyacetic acid. Toxicol Appl
Pharmacol 2004; 195:348–354.
67.Pont AR, Charron AR, Wilson RM, et al. Effects of active sunscreen ingredient com binations on the topical penetration of the herbicide 2,4-dichlorophenoxyacetic acid.
Toxicol Ind Health 2003; 19:1–8.
68.Morgan TM, Reed BL, Finnin BC. Enhanced skin permeation of sex hormones with novel topical spray vehicles. J Pharm Sci 1998; 87:1213–1218.
69.Schauder S, Ippen H. Contact and photocontact sensitivity to sunscreens. Review of a
15-year experience and of the literature. Contact Dermatitis 1997; 37:221–232.
70.Farrerons J, Barnadas M, Rodriguez J, et al. Clinically prescribed sunscreen (sun protection factor 15) does not decrease serum vitamin D concentration sufficiently either to induce changes in parathyroid function or in metabolic markers. Br J Dermatol 1998; 139:422–427.
71.Schlumpf M, Cotton B, Conscience M, et al. In vitro and in vivo estrogenicity of UV screens. Environ Health Perspect 2001; 109:239–244.
72.Opinion on the Evaluation of Potentially Estrogenic Effects of UV-filters adopted by the SCCNFP during the 17th Plenary meeting of 12 June 2001.
73.http://www.hamiltonlabs.com.au.
74.Hagedorn-Leweke U, Lippold BC. Absorption of sunscreens and other compounds through human skin in vivo: derivation of a method to predict maximum fluxes. Pharm Res 1995; 12:354–1360.
75.Benech-Kieffer F, Wegrich P, Schwarzenbach R, et al. Percutaneous absorption of sun screens in vitro: interspecies comparison, skin models and reproducibility aspects. Skin Pharmacol Appl Skin Physiol 2000; 13:324–335.