

4 курс / Акушерство и гинекология / Клинико_морфологические_особенности_злокачественной
.pdf54
Descriptive statistics of quantitative indicators such as age, body mass index, number of pregnancies, births, abortions, proliferative activity index Ki-67, β-catenin and PDL1 were calculated using standard concepts: averages, deviations, percentage composition, medians and quarters.
The analysis of linear variables was carried out using the ANOVA dispersion method. Since all linear variables had an abnormal distribution, their analysis was carried out using the Univariate General Linear Model (UnANOVA) after the variables were ranked (on ranks). The nonparametric Kruskal-Wallis (KW) and Pairwise test was used to compare linear variables between histological groups. The analysis of nominal variables when comparing their frequency distribution according to histological conclusions is presented according to the results of the chi-square/χ2 or Fisher's Exact test response tests.
The criterion of statistical reliability of the obtained conclusions was considered to be the generally accepted value in medicine p<0.05. In cases where the test (ChiSq or Fisher) showed significant differences (p<0.05) between groups, calculations of odds ratio, relative risk, sensitivity and specificity (Odd ration – OR, Relative Risk – RR, Sensitivity, Specificity) were added for IHC indicators. Binomial logistic regressions were constructed using the Forward Stepwise (Conditional) method.

55
Chapter 3
RESULTS
3.1Structure of endometrial diseases in the study group 818 women
During the analysis of the histological conclusions of 818 patients, the following results were obtained: endometrial pathology was detected in 84% of women, of which 246 women (30%) had endometrial hyperplasia without atypia, 34 patients (4%) were diagnosed with atypical endometrial hyperplasia, 78 (10%) – endometrial adenocarcinoma, the majority of patients 328 (40%) were diagnosed with an endometrial polyp (Figure 3).
4% 10% 16%
30%
40%
 Without pathology
 Endometrial polyp
 Endometrial hyperplasia without atypia
 EIN
EIN
 Endometrial adenocarcinoma
Figure 3 – The structure of endometrial diseases in the study group 818 patients
The average age of patients with EH without atypia was 46±7 years, with AEH
– 52±10 years, with EC – 60±12 years (Figure 4).
Рекомендовано к изучению сайтом МедУнивер - https://meduniver.com/

56
A g e
Benign |
Endometrioid |
Endometrioid |
endometrial hyperplasia |
intraepithelial neoplasia |
endometrial |
|
|
adenocarcinoma |
Figure 4 – Age distribution of patients
with hyperplastic processes and endometrial adenocarcinoma
The age of patients with benign EH is less than that of patients with AEH (p<0.001) and EC (p<0.001), while the age of patients in the AEH group is less than the EC group (p=0.002).
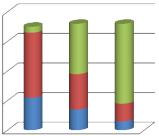
The incidence of various pathologies of the endometrium differed between the periods of aging of the female reproductive system (p<0.001): EH was more common in women in the reproductive period compared to AEH and EC, which were more common in postmenopausal women. AEH was more common in the reproductive and transitional periods compared to EC, which was more common in postmenopausal women (Figure 5).

|
|
|
|
57 |
|
|
|
|
|||||
Benign endometrial |
Endometrial atypical |
|||||
hyperplasia |
|
|
|
hyperplasia |
||
|
|
Reproductive |
|
|
|
Reproductive |
|
|
|
|
|
||
|
|
Transitional |
|
|
|
|
|
|
|
|
|
Transitional |
|
|
|
|
|
|
||
|
|
|
|
|
||
|
|
Postmenopausal |
|
|
Postmenopausal |
|
|
|
|
|
|||
|
|
|
|
|||
20% |
43% |
47% |
24% |
|||
|
|
|
|
|||
37% |
|
|
|
29% |
||
Endometrial endometrioid adenocarcinoma
|
|
Reproductive |
|
|
|
|
|
|
|
|
|
|
|
Transitional |
|
|
|
|
|
|
|
|
|
|
|
Postmenopausal |
10% |
|
|
||
|
|
||
|
|
|
|
13% |
|
||
77% |
|
||
Figure 5 – The frequency of occurrence of endometrial hyperplasia
and adenocarcinomas depending on the stage of aging female reproductive system
3.2 Clinical and morphological features of benign endometrial hyperplasia,
endometrioid intraepithelial neoplasia and endometrioid endometrial cancer
After morphological revision of the material and preparation of multiblocks for IHC study, the final sample included 107 women: 35 with a diagnosis of endometrial hyperplasia without atypia, 36 with EIN, and 36 with a diagnosis of endometrioid adenocarcinoma of the endometrium. 251 patients were not included in the study for
Рекомендовано к изучению сайтом МедУнивер - https://meduniver.com/
58
a number of reasons: unavailability of histological material, insufficiency or inadequacy of the material after the manufacture of multiblocks, other histological types of endometrial cancer (serous adenocarcinoma, clear cell adenocarcinoma) and other changes in the endometrium (impaired proliferation of the endometrium, secretory endometrium, mucinous proliferation), which were not the aim of this study.
Clinical and anamnestic characteristics of the groups.
Group 1: patients diagnosed with endometrial hyperplasia without atypia
(EH without atypia)
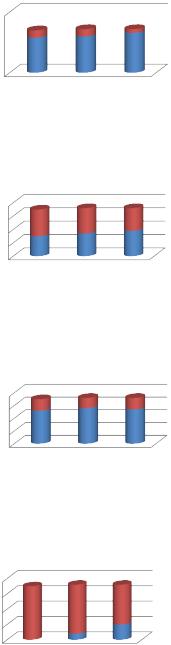
The group of patients with endometrial hyperplasia without atypia was 35 women. The average age of this group was 46±6 years. 11 (31%) women were reproductive age, 22 (63%) were in transition period, and 2 (6%) were postmenopausal. Most of them had complaints about AUB – 83% (of which 39% were with laboratory-confirmed anemia (hemoglobin below 120 g/l)), the rest did not complain (Table 5). The indication for morphological examination in this case was the data of ultrasonography: the mismatch of the thickness and structure of the endometrium with the phase of the cycle.
Among the risk factors for the development of endometrial hyperplasia and neoplasia in this group, obesity was the most common in 60% of cases and overweight in 26% of cases, and both factors were respectively present in almost all women in 86% of cases. The average BMI was 29±7 kg/m2. The average number of pregnancies is 3±2, of which, on average, 1±1 childbirth and 2±2 abortions. None of the studied women had diabetes. Hypertension occurred in 31% of women, AIT – in 11% (table 5).
Among the reproductive risk factors in 11% of cases (in 4 patients), early onset of menstruation (before 11 years) was noted, in 14% (in 5 patients) infertility was observed (table 5).
59
Table 5 – Clinical parameters in patients with EH without atypia, EIN and EC
|
|
|
|
|
|
|
|
|
|
|
|
|
|
EH |
|
|
|
|
|
|
|
|
Parameter |
|
Indicator |
without |
EIN |
EC |
|||||
|
|
|
|
|
|
|
|
|
|
|
|
|
|
atypia |
|
|
|
|
|
|
|
|
|
|
|
|
|
|
|
|
|
|
|
|
|
|
|
|
|
|
|
|
|
|
|
|
Average value |
46 |
53 |
61 |
|
|
|
|
|
|
|
|
|
|
|
|
|
|
|
|
|
Age |
|
|
|
|
|
|
|
Standard deviation |
6 |
10 |
13 |
|||||
|
|
|
|
|
|
|
|
|
|
|
||||||
|
|
|
|
|
|
|
Quartile 25 |
44 |
47 |
53 |
||||||
|
|
|
|
|
|
|
|
|
|
|
|
|
||||
|
|
|
|
|
|
|
|
|
|
|
|
|
|
|
|
|
|
|
|
|
|
|
|
|
|
|
|
|
|
Quartile 75 |
50 |
60 |
68 |
|
|
|
|
|
|
|
|
|
|
|
|
|
|
|
|
|
|
|
|
|
|
|
|
|
|
|
|
|
|
Average value |
29 |
30 |
31 |
|
|
|
|
|
|
|
|
|
|
|
|
|
|
|
|
|
BMI |
|
|
|
|
|
|
|
Standard deviation |
7 |
7 |
8 |
|||||
|
|
|
|
|
|
|
|
|
|
|
||||||
|
|
|
|
|
|
|
Quartile 25 |
25 |
25 |
25 |
||||||
|
|
|
|
|
|
|
|
|
|
|
|
|
||||
|
|
|
|
|
|
|
|
|
|
|
|
|
|
|
|
|
|
|
|
|
|
|
|
|
|
|
|
|
|
Quartile 75 |
32 |
35 |
35 |
|
|
|
|
|
|
|
|
|
|
|
|
|
|
|
|
|
|
|
|
|
|
|
|
|
|
|
|
|
|
Average value |
3 |
3 |
2 |
|
|
|
|
|
|
|
|
|
|
|
|
|
|
|
|
|
Pregnancy |
|
|
|
|
|
|
|
Standard deviation |
2 |
2 |
2 |
|||||
|
|
|
|
|
|
|
|
|
|
|
||||||
|
|
|
|
|
|
|
Quartile 25 |
1 |
2 |
1 |
||||||
|
|
|
|
|
|
|
|
|
|
|
|
|
||||
|
|
|
|
|
|
|
|
|
|
|
|
|
|
|
|
|
|
|
|
|
|
|
|
|
|
|
|
|
|
Quartile 75 |
4 |
3 |
4 |
|
|
|
|
|
|
|
|
|
|
|
|
|
|
|
|
|
|
|
|
|
|
|
|
|
|
|
|
|
|
Average value |
1 |
1 |
1 |
|
|
|
|
|
|
|
|
|
|
|
|
|
|
|
|
|
Childbirth |
|
|
|
|
|
|
|
Standard deviation |
1 |
1 |
1 |
|||||
|
|
|
|
|
|
|
|
|
|
|
||||||
|
|
|
|
|
|
|
Quartile 25 |
1 |
1 |
1 |
||||||
|
|
|
|
|
|
|
|
|
|
|
|
|
||||
|
|
|
|
|
|
|
|
|
|
|
|
|
|
|
|
|
|
|
|
|
|
|
|
|
|
|
|
|
|
Quartile 75 |
1 |
1 |
2 |
|
|
|
|
|
|
|
|
|
|
|
|
|
|
|
|
|
|
|
|
|
|
|
|
|
|
|
|
|
|
Average value |
2 |
1 |
1 |
|
|
|
|
|
|
|
|
|
|
|
|
|
|
|
|
|
Abortion |
|
|
|
|
|
|
|
Standard deviation |
2 |
2 |
1 |
|||||
|
|
|
|
|
|
|
|
|
|
|
||||||
|
|
|
|
|
|
|
Quartile 25 |
0 |
0 |
0 |
||||||
|
|
|
|
|
|
|
|
|
|
|
|
|
||||
|
|
|
|
|
|
|
|
|
|
|
|
|
|
|
|
|
|
|
|
|
|
|
|
|
|
|
|
|
|
Quartile 75 |
2 |
2 |
2 |
|
|
|
|
|
|
|
|
|
|
|
|
|
|
|
|
|
Reproductive aging period |
|
Reproductive |
11 |
7 |
3 |
|||||||||||
|
|
|
|
|
|
|
|
|
|
|
|
|
(31%) |
(20%) |
(8%) |
|
|
|
|
|
|
|
|
|
|
|
|
|
|
|
|||
|
|
|
|
|
|
|
|
|
|
|
|
|
|
|
|
|
40 |
|
|
|
|
|
|
|
|
|
|
|
Postmenopausal |
Transitional |
22 |
12 |
6 |
|
|
|
|
|
|
|
|
|
|
|
||||||
|
|
|
|
|
|
|
|
|
|
|
||||||
|
|
|
|
|
|
|
|
|
|
|
|
|
(63%) |
(33%) |
(17%) |
|
30 |
|
|
|
|
|
|
|
|
|
|
|
Transitional |
|
|||
|
|
|
|
|
|
|
|
|
|
|
|
|||||
20 |
|
|
|
|
|
|
|
|
|
|
|
|
|
|
|
|
|
|
|
|
|
|
|
|
|
|
|
|
2 |
17 |
27 |
||
|
|
|
|
|
|
|
|
|
|
|
|
|||||
|
|
|
|
|
|
|
|
|
|
|
|
|
||||
10 |
|
|
|
|
|
|
|
|
|
|
|
Reproductive |
Postmenopausal |
|||
|
|
|
|
|
|
|
|
|
|
|
||||||
0 |
|
|
|
|
|
|
|
|
|
|
|
(6%) |
(47%) |
(75%) |
||
|
|
|
|
|
|
|
|
|
|
|
||||||
|
|
|
|
|
|
|
|
|
|
|
|
|||||
|
|
|
|
|
|
|
|
|
|
|
|
|
||||
EH without atypiaEIN |
|
|
EC |
|
|
|
|
|
||||||||
|
|
|
|
|
|
|
|
|
|
|
|
|
|
|
|
|
Рекомендовано к изучению сайтом МедУнивер - https://meduniver.com/
60
Table 5 continued
|
|
|
|
|
|
|
|
|
|
|
|
|
|
|
|
|
|
|
|
|
|
|
|
|
|
|
|
|
|
|
EH |
|
|
|
|
|
|
|
|
|
|
|
|
|
|
|
|
|
|
Parameter |
|
|
|
|
|
Indicator |
without |
EIN |
EC |
||||||||
|
|
|
|
|
|
|
|
|
|
|
|
|
|
|
|
|
|
|
|
|
|
|
|
|
|
|
|
|
|
|
atypia |
|
|
|
|
|
|
|
|
|
|
|
|
|
|
|
|
|
|
|
|
|
|
|
|
|
|
|
|
|
|
|
|
|
|
|
|
Complaints |
|
|
|
|
|
|
|
|
|
|
|
|
|
|
|
|
|
29 |
30 |
33 |
|||||||||||||
|
|
|
|
|
|
|
|
|
|
|
|
|
|
|
|
|
|
|
|
|
|
|
|
|
|
|
|
|
|
AUB |
|||
|
|
|
|
|
|
|
|
|
|
|
|
|
|
|
|
|
|
|
|
|
|
|
|
|
|
|
|
|
|
(83%) |
(83%) |
(92%) |
|
50 |
|
|
|
|
|
|
|
|
|
|
|
|
|
|
|
|
|
|
|
|
|
|
|
|
|
No symptoms |
|
||||||
|
|
|
|
|
|
|
|
|
|
|
|
|
|
|
|
|
|
|
|
|
|
|
|
|
|||||||||
|
|
|
|
|
|
|
|
|
|
|
|
|
|
|
|
|
|
|
|
|
|
|
|
|
|
|
|
|
|
||||
|
|
|
|
|
|
|
|
|
|
|
|
|
|
|
|
|
|
|
|
|
|
|
|
|
|
|
|
|
|
||||
|
|
|
|
|
|
|
|
|
|
|
|
|
|
|
|
|
|
|
|
|
|
|
|
|
|
|
|
|
|
||||
|
|
|
|
|
|
|
|
|
|
|
|
|
|
|
|
|
|
|
|
|
|
|
|
|
|
|
|
|
|
|
|
|
|
0 |
|
|
|
|
|
|
|
|
|
|
|
|
|
|
|
|
|
|
|
|
|
|
|
|
|
AUB |
No complaints |
6 |
6 |
3 |
|||
|
|
|
|
|
|
|
|
|
|
|
|
|
|
|
|
|
|
|
|
|
|
|
|
||||||||||
|
|
|
|
|
EH |
EIN |
|
|
|
|
EC |
||||||||||||||||||||||
|
|
|
|
|
|
|
|
|
|
||||||||||||||||||||||||
|
|
|
|
|
|
|
|
|
|
|
|
|
|
|
|
||||||||||||||||||
|
|
|
|
|
|
|
|
|
|
|
|
|
|
|
|
(17%) |
(17%) |
(8%) |
|||||||||||||||
|
|
|
|
|
without |
|
|
|
|
|
|
|
|
|
|
|
|
|
|
|
|
|
|||||||||||
|
|
|
|
|
|
|
atypia |
|
|
|
|
|
|
|
|
|
|
|
|
|
|
|
|
|
|
|
|
||||||
|
|
|
|
|
|
|
|
|
|
|
|
|
|
|
|
|
|
|
|
|
|
|
|
|
|
|
|
|
|
|
|
|
|
Obesity |
|
|
|
|
|
|
|
|
|
|
|
|
|
|
|
|
|
|
|
|
|||||||||||||
|
|
|
|
|
|
|
|
|
|
|
|
|
|
|
|
|
|
|
|
|
|
|
|
|
|
|
|
|
|
Yes |
15 |
17 |
19 |
40 |
|
|
|
|
|
|
|
|
|
|
|
|
|
|
|
|
|
|
|
|
|
|
|
|
|
|
|
|
|
(43%) |
(47%) |
(53%) |
|
|
|
|
|
|
|
|
|
|
|
|
|
|
|
|
|
|
|
|
|
|
|
|
|
|
|
|
|
|
|
||||
30 |
|
|
|
|
|
|
|
|
|
|
|
|
|
|
|
|
|
|
|
|
|
|
|
|
|
|
|
|
|
|
|
|
|
|
|
|
|
|
|
|
|
|
|
|
|
|
|
|
|
|
|
|
|
|
|
|
|
|
|
|
|
|
|
|
|
||
20 |
|
|
|
|
|
|
|
|
|
|
|
|
|
|
|
|
|
|
|
|
|
|
|
|
|
|
|
|
BMI < 35 |
|
|
|
|
|
|
|
|
|
|
|
|
|
|
|
|
|
|
|
|
|
|
|
|
|
|
|
|
|
|
|
|
|
|
|
|||
|
|
|
|
|
|
|
|
|
|
|
|
|
|
|
|
|
|
|
|
|
|
|
|
|
|
|
|
|
|
|
|||
10 |
|
|
|
|
|
|
|
|
|
|
|
|
|
|
|
|
|
|
|
|
|
|
|
|
|
|
|
|
|
|
|
|
|
|
|
|
|
|
|
|
|
|
|
|
|
|
|
|
|
|
|
|
|
|
|
|
|
|
|
|
|
|
|
|
|
|
|
|
|
|
|
|
|
|
|
|
|
|
|
|
|
|
|
|
|
|
|
||||||||||||||
0 |
|
|
|
|
|
|
|
|
|
|
|
|
|
|
|
|
|
|
|
|
|
|
|
|
|
|
|
|
BMI >35 |
|
20 |
19 |
17 |
|
|
|
|
|
|
|
EH |
EIN |
|
|
|
|
EC |
|
|
|
|
No |
|||||||||||||||
|
|
|
|
|
|
|
|
|
|
|
|
|
|
|
|
||||||||||||||||||
|
|
|
|
|
|
|
without |
|
|
|
|
|
|
|
|
|
|
|
|
|
|
|
|
(57%) |
(53%) |
(47%) |
|||||||
|
|
|
|
|
|
|
atypia |
|
|
|
|
|
|
|
|
|
|
|
|
|
|
|
|
|
|||||||||
|
|
|
|
|
|
|
|
|
|
|
|
|
|
|
|
|
|
|
|
|
|
|
|
|
|
|
|||||||
|
|
|
|
|
|
|
|
|
|
|
|
|
|
|
|
|
|
|
|
|
|
|
|
|
|
|
|
|
|
|
|
|
|
Overweight |
|
|
|
|
|
|
|
|
|
|
|
|
|
|
|
|
|
|
|
|
|||||||||||||
|
|
|
|
|
|
|
|
|
|
|
|
|
|
|
|
|
|
|
|
|
|
|
|
|
|
|
|
|
|
Yes |
26 |
28 |
27 |
40 |
|
|
|
|
|
|
|
|
|
|
|
|
|
|
|
|
|
|
|
|
|
|
|
|
|
|
|
|
|
(74%) |
(78%) |
(75%) |
|
|
|
|
|
|
|
|
|
|
|
|
|
|
|
|
|
|
|
|
|
|
|
|
|
|
|
|
|
|
|
||||
|
|
|
|
|
|
|
|
|
|
|
|
|
|
|
|
|
|
|
|
|
|
|
|
|
|
|
|
|
|||||
30 |
|
|
|
|
|
|
|
|
|
|
|
|
|
|
|
|
|
|
|
|
|
|
|
|
|
|
|
|
|
|
|
|
|
|
|
|
|
|
|
|
|
|
|
|
|
|
|
|
|
|
|
|
|
|
|
|
|
|
|
|
|
|
|
|
|
||
20 |
|
|
|
|
|
|
|
|
|
|
|
|
|
|
|
|
|
|
|
|
|
|
|
|
|
|
|
|
BMI<25 |
|
|
|
|
|
|
|
|
|
|
|
|
|
|
|
|
|
|
|
|
|
|
|
|
|
|
|
|
|
|
|
|
|
|
|
|||
|
|
|
|
|
|
|
|
|
|
|
|
|
|
|
|
|
|
|
|
|
|
|
|
|
|
|
|
|
|
|
|||
10 |
|
|
|
|
|
|
|
|
|
|
|
|
|
|
|
|
|
|
|
|
|
|
|
|
|
|
|
|
|
|
|
|
|
|
|
|
|
|
|
|
|
|
|
|
|
|
|
|
|
|
|
|
|
|
|
|
|
|
|
|
|
|
|
|
|
|
|
0 |
|
|
|
|
|
|
|
|
|
|
|
|
|
|
|
|
|
|
|
|
|
|
|
|
|
|
|
|
BMI >25 |
|
9 |
8 |
9 |
|
|
|
|
|
EH |
EIN |
|
|
|
|
EC |
|
|
|
|
No |
|||||||||||||||||
|
|
|
|
|
|
|
|
|
|
|
|
|
|
|
|||||||||||||||||||
|
|
|
|
|
|
|
|
|
|
|
|
|
|
|
|
||||||||||||||||||
|
|
|
|
|
|
|
without |
|
|
|
|
|
|
|
|
|
|
|
|
|
|
|
|
(26%) |
(22%) |
(25%) |
|||||||
|
|
|
|
|
|
|
atypia |
|
|
|
|
|
|
|
|
|
|
|
|
|
|
|
|
|
|||||||||
|
|
|
|
|
|
|
|
|
|
|
|
|
|
|
|
|
|
|
|
|
|
|
|
|
|
|
|||||||
|
|
|
|
|
|
|
|
|
|
|
|
|
|
|
|
|
|
|
|
|
|
|
|
|
|
|
|
|
|
|
|
|
|
Type 2 diabetes |
|
|
|
|
|
|
|
|
|
|
|
|
|
|
|
|
|
|
4 |
10 |
|||||||||||||
|
|
|
|
|
|
|
|
|
|
|
|
|
|
|
|
|
|
|
|
|
|
|
|
|
|
|
|
|
|
Yes |
0 |
||
40 |
|
|
|
|
|
|
|
|
|
|
|
|
|
|
|
|
|
|
|
|
|
|
|
|
|
|
|
|
|
(11%) |
(28%) |
||
|
|
|
|
|
|
|
|
|
|
|
|
|
|
|
|
|
|
|
|
|
|
|
|
|
|
|
|
|
|
|
|||
|
|
|
|
|
|
|
|
|
|
|
|
|
|
|
|
|
|
|
|
|
|
|
|
|
|
|
|
|
|
|
|||
30 |
|
|
|
|
|
|
|
|
|
|
|
|
|
|
|
|
|
|
|
|
|
|
|
|
|
|
|
|
|
|
|
|
|
|
|
|
|
|
|
|
|
|
|
|
|
|
|
|
|
|
|
|
|
|
|
|
|
|
|
|
|
|
|
|
|
|
|
20 |
|
|
|
|
|
|
|
|
|
|
|
|
|
|
|
|
|
|
|
|
|
|
|
|
|
|
|
No diabetes |
|
|
|
|
|
|
|
|
|
|
|
|
|
|
|
|
|
|
|
|
|
|
|
|
|
|
|
|
|
|
|
|
|
|
|
|
|||
|
|
|
|
|
|
|
|
|
|
|
|
|
|
|
|
|
|
|
|
|
|
|
|
|
|
|
|
|
|
|
|||
10 |
|
|
|
|
|
|
|
|
|
|
|
|
|
|
|
|
|
|
|
|
|
|
|
|
|
|
|
|
|
|
|
||
|
|
|
|
|
|
|
|
|
|
|
|
|
|
|
|
|
|
|
|
|
|
|
|
|
|
|
|
|
|
|
|
|
|
0 |
|
|
|
|
|
|
|
|
|
|
|
|
|
|
|
|
|
|
|
|
|
|
|
|
|
|
|
Diabetes |
|
|
32 |
26 |
|
|
|
|
|
|
|
|
|
|
|
|
|
|
|
|
|
|
|
|
|
|
|
|
|
|
|
|
|
|
|||||
|
|
|
|
|
|
EH |
EIN |
|
|
|
|
EC |
|
No |
35 |
||||||||||||||||||
|
|
|
|
|
|
|
|
|
|
|
|
|
|||||||||||||||||||||
|
|
|
|
|
|
|
|
|
|
|
|
|
|
|
|
||||||||||||||||||
|
|
|
|
|
|
|
|
|
|
|
|
|
|
|
|
|
|
||||||||||||||||
|
|
|
without |
|
|
|
|
|
|
|
|
|
|
|
|
|
|
|
|
(89%) |
(72%) |
||||||||||||
|
|
|
|
|
|
|
|
|
|
|
|
|
|
|
|
|
|
|
|
|
|||||||||||||
|
|
|
|
|
|
atypia |
|
|
|
|
|
|
|
|
|
|
|
|
|
|
|
|
|
|
|
|
|||||||
|
|
|
|
|
|
|
|
|
|
|
|
|
|
|
|
|
|
|
|
|
|
|
|
|
|
|
|
|
|
|
|
|
|

61
Table 5 continued
|
|
|
|
|
|
|
|
|
|
|
|
|
|
|
|
|
|
|
|
|
|
EH |
|
|
|
|
|
|
|
|
|
|
|
|
|
|
Parameter |
Indicator |
without |
EIN |
EC |
||||||||
|
|
|
|
|
|
|
|
|
|
|
|
|
|
|
|
|
|
|
|
|
|
atypia |
|
|
|
|
|
|
|
|
|
|
|
|
|
|
|
|
|
|
|
|
|
|
|
|
|
|
|
Hypertonic disease |
|
|
|
|
|
|
|
|
|
|
|
11 |
19 |
22 |
||||||||||
|
|
|
|
|
|
|
|
|
|
|
|
|
|
|
|
|
|
|
|
|
Yes |
|||
|
|
|
|
|
|
|
|
|
|
|
|
|
|
|
|
|
|
|
|
|
(54%) |
(53%) |
(61%) |
|
40 |
|
|
|
|
|
|
|
|
|
|
|
|
|
|
|
|
|
|
|
No hypertonic |
|
|||
|
|
|
|
|
|
|
|
|
|
|
|
|
|
|
|
|
|
|
|
|
|
|
||
|
|
|
|
|
|
|
|
|
|
|
|
|
|
|
|
|
|
|
|
|
||||
20 |
|
|
|
|
|
|
|
|
|
|
|
|
|
|
|
|
|
|
|
disease |
|
|
|
|
|
|
|
|
|
|
|
|
|
|
|
|
|
|
|
|
|
|
|
Hypertonic |
|
24 |
17 |
14 |
|
0 |
|
|
|
|
|
|
|
|
|
|
|
|
|
|
|
|
|
|
|
No |
||||
|
|
|
|
|
|
|
|
|
|
|
|
|
|
|
|
|
|
|
||||||
|
|
|
|
|
|
|
|
|
|
|
|
|
|
|
|
|
|
|
|
disease |
(46%) |
(47%) |
(39%) |
|
|
|
|
|
|
|
|
|
|
|
|
|
|
|
|
|
|
|
|
|
|
|
|||
|
|
|
|
|
|
|
|
|
|
|
|
|
|
|
|
|
|
|
|
|
|
|
||
Early menarche (before age 11) |
|
4 |
3 |
|
||||||||||||||||||||
|
|
|
|
|
|
|
|
|
|
|
|
|
|
|
|
|
|
|
|
|
Yes |
2 |
||
|
|
|
|
|
|
|
|
|
|
|
|
|
|
|
|
|
Menarche older |
(11%) |
(8%) |
|||||
40 |
|
|
|
|
|
|
|
|
|
|
|
|
|
|
|
|
|
|
||||||
|
|
|
|
|
|
|
|
|
|
|
|
|
|
|
|
|
||||||||
|
|
|
|
|
|
|
|
|
|
|
|
|
|
|
||||||||||
|
|
|
|
|
|
|
|
|
|
|
|
|
|
|
|
|
||||||||
20 |
|
|
|
|
|
|
|
|
|
|
|
|
|
|
|
|
11 years |
|
|
|
|
|||
|
|
|
|
|
|
|
|
|
|
|
|
|
|
|
|
|
|
|
|
|
|
|
|
|
0 |
|
|
|
|
|
|
|
|
|
|
|
|
|
|
|
|
Menarche before |
No |
31 |
33 |
34 |
|||
|
|
|
|
|
|
|
|
|
|
|
|
|
|
|
|
|||||||||
|
|
|
|
|
|
|
|
|
|
|
|
|
|
|
|
|
(89%) |
(92%) |
||||||
|
|
|
|
|
|
|
|
|
|
|
|
|
|
|
|
|
11 years |
|||||||
|
|
|
|
|
|
|
|
|
|
|
|
|
|
|
|
|
|
|
||||||
|
|
|
|
|
|
|
|
|
|
|
|
|
|
|
|
|
|
|
|
|
|
|
||
|
|
|
|
|
|
|
|
|
|
|
|
|
|
|
|
|
|
|
|
|
|
|
||
Late menopause (55 years and older) |
|
|
|
|
||||||||||||||||||||
|
|
|
|
|
|
|
|
|
|
|
|
|
|
|
|
|
|
|
|
|
Yes |
0 |
2 |
8 |
40 |
|
|
|
|
|
|
|
|
|
|
|
|
|
|
|
|
Normal |
|
|
|
|
|||
|
|
|
|
|
|
|
|
|
|
|
|
|
|
|
|
|
|
|
|
|||||
|
|
|
|
|
|
|
|
|
|
|
|
|
|
|
|
|
|
|
|
|||||
|
|
|
|
|
|
|
|
|
|
|
|
|
|
|
|
|
menopause |
|
|
|
|
|||
20 |
|
|
|
|
|
|
|
|
|
|
|
|
|
|
|
|
Late menopause |
|
|
|
|
|||
|
|
|
|
|
|
|
|
|
|
|
|
|
|
|
|
No |
2 |
11 |
19 |
|||||
0 |
|
|
|
|
|
|
|
|
|
|
|
|
|
|
|
|
||||||||
|
|
|
|
|
|
|
|
|
|
|
|
|
|
|
|
|||||||||
|
|
|
|
|
|
|
|
|
|
|
|
|
|
|
|
|
|
|
|
|||||
EH without atypiaEIN |
|
EC |
|
|
|
|
|
|
|
|
|
|
|
|
||||||||||
|
|
|
|
|
|
|
|
|
|
|
|
|
|
|
|
|
|
|
|
|
|
|
|
|
Infertility |
|
|
|
|
|
|
|
|
|
|
|
|
|
|
||||||||||
|
|
|
|
|
|
|
|
|
|
|
|
|
|
|
|
|
|
|
|
|
Yes |
5 |
4 |
6 |
50 |
|
|
|
|
|
|
|
|
|
|
|
|
|
|
|
|
|
|
Fertility |
|
|
|
|
|
|
|
|
|
|
|
|
|
|
|
|
|
|
|
|
|
|
|
|
|
|
|
|||
0 |
|
|
|
|
|
|
|
|
|
|
|
|
|
|
|
|
|
|
|
|
|
|
||
|
|
|
|
|
|
|
|
|
|
|
|
|
|
|
|
|
|
|
|
|
|
|||
|
|
|
|
|
|
|
|
|
|
|
|
|
|
|
|
|
|
|
|
|
|
|
|
|
|
|
|
|
|
|
|
|
|
|
|
|
|
|
|
|
|
|
Infertility |
No |
30 |
32 |
30 |
||
|
|
|
|
|
|
|
|
|
|
|
|
|
|
|
|
|
|
|||||||
EH withou atypiaEIN |
|
EC |
|
|
|
|
|
|
||||||||||||||||
|
|
|
|
|
|
|
||||||||||||||||||
|
|
|
|
|
|
|
|
|
|
|
||||||||||||||
|
|
|
|
|
|
|
|
|
|
|
|
|
|
|
|
|
|
|
|
|
|
|
|
|
Data on the use of COCs in this sample are limited, it is reliably known that only 2 women received COCs for more than 3 years. For the rest, there is no information on admission and duration of admission.
Рекомендовано к изучению сайтом МедУнивер - https://meduniver.com/

62
I would like to emphasize that in 10 women (29%), endometrial hyperplasia is recurrent in nature, and the anamnesis has already recorded cases of histologically confirmed HE without atypia 3-7 years ago.
Morphological analysis of the material revealed discrepancies in the diagnosis according to the conclusions of different pathologists in 3 women (9% of cases). In one of the patients, initially, according to the histological conclusion, no EH was detected, but only a proliferative endometrium. The other two were overdiagnosed: AEH was diagnosed, but a review confirmed EH without atypia (Figure 6).
Figure 6 – Preparation of endometrial hyperplasia without atypia, color hematoxylin eosin, ×200
However, one of the patients (with late menopause) has recurrent endometrial hyperplasia. Since 2016, the patient has had 5 hysteroscopies with separate diagnostic curettage of the uterine cavity and cervical canal. According to the histological conclusion, EH was confirmed without atypia, 2 times in combination with an endometrial polyp. The patient is under dynamic observation. At the time of the examination in 2021, the patient had no complaints about AUB; according to the ultrasound examination, the endometrium corresponds to postmenopause, its thickness does not exceed 4 mm. Since 2016, the second patient has noted the

63
absence of menstruation, has no complaints, according to the ultrasound examination of the small pelvis, no pathology of the endometrium was detected.
This group of patients was followed up by telephone survey (31 patients were interviewed 5 years after the initial endometrial assessment, 1 patient after 3 years, 2 patients could not be contacted, 1 patient was included in the study in 2021). In 6 cases, repeated morphological evaluation of the endometrium was performed in the interval from 2-5 years. None of the patients showed malignancy of EH.
Group 2: patients diagnosed with endometrioid
intraepithelial neoplasia/atypical endometrial
hyperplasia (EIN/AEH)
The second group of patients included 36 people with a morphologically confirmed diagnosis – endometrioid intraepithelial neoplasia\ atypical endometrial hyperplasia (Figure 7).
Figure 7 – Preparation of endometrioid intraepithelial neoplasia, hematoxylin eosin , 200
This group consisted of women with an average age of 53±10 years. 7 women
(19%) were in the reproductive period, 12 (33%) – in the transition period, 17 (48%)
– in postmenopause. In 83% of women complained about AUB (30% of them had signs of anemia hemoglobin below 120 g/l). The most common of all the risk factors
Рекомендовано к изучению сайтом МедУнивер - https://meduniver.com/