

Gruber
.pdfQualitative Research
Priorities
•Interview guide is only representing a tool in order to give reference to those aspects that have not been clarified or discussed before the qualitative stage of research
•elaborating a thoroughly thought out interview gui de that both contextual and structural meets standard for the principle of a standardized open-ended interview approach
•depending on the oral fluency of respondents, but not to forget the relevance of topics using the interview guide flexibly (always having in mind the pre-structured order of questions)
•pointing out relevant semantic contexts
•critical examination of the statements of responde nts
•not running into danger to trust in the absolutene ss of knowledge of respondents
•Pre-test of the guide
Quantitative and Qualitative Research
Modules of the questionnaire and interview guide
•Socio-demographic information of female headed hou seholds (household size, composition, and location, sex, age, education, health),
•Social network relations (family members, friends, n eighbors, acquaintances, etc.),
•Living conditions (employment status, working places, multiple job holding, compensation of income loss, looking for a job in the informal labor market, wages),
•Household incomes and expenditures (lease rental charg es, expenses for education, child care, etc., risk taking, credit lending and borrowing of money, savings and savings behavior),
•Estimations about satisfaction in life (life plans, personal situation, financial situation, motivations, etc.),
•Trust in and satisfaction with state services (education system, health system, security aspects, etc.)
•Perceptions about pension age (retirement planning, pension entitlements, etc.),
•Classes of insurances (life insurance, health insuranc e, other insurances)
Analysis of quantitative and qualitative data
•computer-assisted analysis of quantitative and qua litative data refers to those steps of data evaluation that is embedded between data collection and data interpretation
•Quantitative data was analyzed with SPSS and Excel
•Qualitative data was analyzed with MAXqda

|
Black |
Black |
Grey salary, |
Grey salary, |
white |
White |
|
salary, |
salary, |
officially paid |
officially paid |
salary, |
salary, |
|
50,000 |
600,000 |
10,000 Rubles |
120,000 |
50,000 |
600,000 |
|
Rubles |
Rubles |
and 40,000 in |
Rubles and |
Rubles |
Rubles |
|
monthly |
annual |
envelope, |
480,000 in |
monthly |
annual |
|
|
|
monthly |
envelope, |
|
|
|
|
|
|
annual |
|
|
|
|
|
|
|
|
|
brutto |
50 000 |
600 000 |
10 000 (plus |
120,000 (plus |
50000 |
600 000 |
|
|
|
40 000in |
480,000 in |
|
|
|
|
|
envelope) |
envelope) |
|
|
Tax (13 percent) |
0 |
0 |
1 300 |
15 600 |
6 500 |
7 8000 |
Unique Social |
0 |
0 |
2 600 |
31 200 |
13000 |
104 800 |
Tax (26 percent) |
|
|
|
|
|
|
From Unique |
0 |
0 |
1 400 |
16 800 |
7 000 |
56 800 |
Social Tax to |
|
|
|
|
|
|
State Pension |
|
|
|
|
|
|
Fund (14 percent |
|
|
|
|
|
|
of official salary) |
|
|
|
|
|
|
netto |
50 000 |
60 0000 |
48 700 |
584 400 |
43 500 |
522 000 |
Costs for |
50 000 |
600 000 |
52 600 |
631 200 |
63 000 |
704 800 |
employer for the |
|
|
|
|
|
|
salary of employee)

What color of |
|
|
|
salary do you get in |
|
|
|
your first job? |
|
|
|
answer |
number |
in „state jobs“ |
in „free economy“ |
|
|
. |
|
only white |
202 |
187 |
15 |
grey |
271 |
8 |
263 |
only black |
29 |
0 |
29 |
do not know |
3 |
0 |
3 |
refuse to answer |
17 |
4 |
13 |
|
522 |
199 |
323 |
„ Сейчас только белый вариант, оскольку это государственная структура. А когда работала в частной фирме, то в основном да, это были черные схемы. Если это коммерческие структуры, то велика вероятность, что там есть черные схемы. И это имеет под собой основания. То есть я их по большому счету не осуждаю, потому что cуществует масса препоной им для того, чтобы показывать белую зарплату.“ (Interview 2, Ivanovo)
„ Черный вариант очень удобно для меня, так как я получаю поддержку, т.е. за квартиру. Моя официальная зарплата, итак белую зарплату, очень низкая. Итак, в принципе, я еще получила также в данный момент эту поддержку, так как один из моих детей зарегистрирован теперь еще как иждевенец (имеющих право на получение материальной помощи членов семьи). Значит, мне без разницы, в каком варианте, но с другой стороны у меня получается, что у меня полностью все коммунальные услуги идут за счет субсидий. Поддержка относится к моей квартиры, для оплаты жилой площади. Это очень положительно, так как если бы у меня не было эту поддержку, я могла бы говорить: ложите зубы на полку и тут все. Я получаю 2.500 руб. в месяц. Это действительно много.“ (Interview 10, Novgorod)

Social Networks…
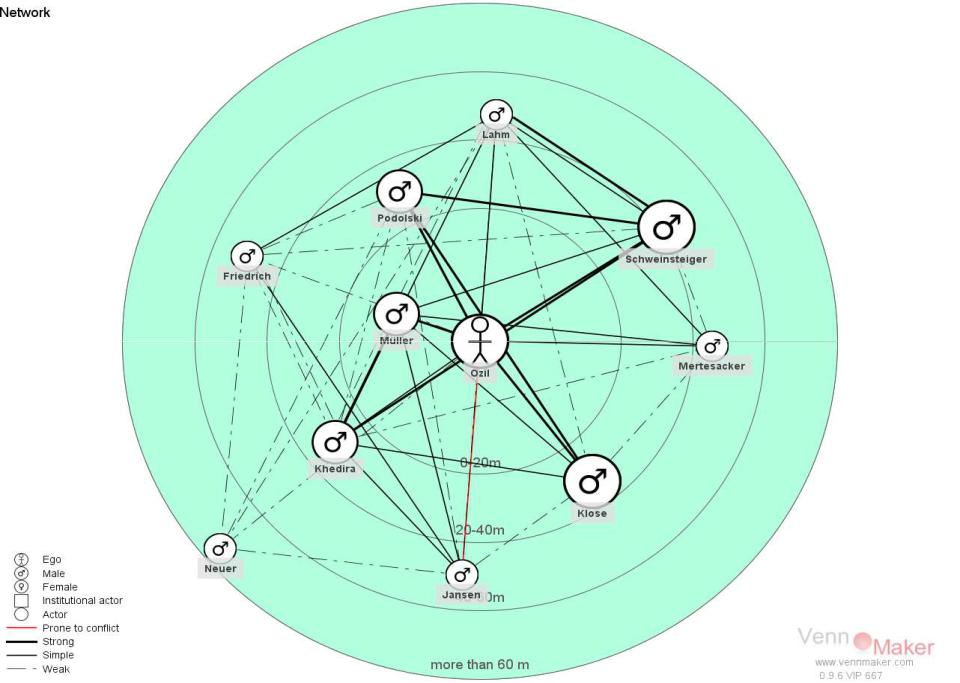
Which player initiated the most passes?
Who was on the receiving end of the most passes?
Who controlled Germany’s play? Which players did not play together?
Which players had a similar role?

…and how do we measure friendship?
friendship: a paradigmatic social relationship of modern times: voluntary, negotiable
based on mutual trust and emotional closeness between two people who may cancel it at any time
it has connotations of freedom, choice and individuality (Pahl 2000:166)
A friend is defined as “someone with whom one has a relationship unprompted by anything other than the rewards that that relationship provides” (Giddens 1993:90)
Graham Allan (1996:85): there is a lack of firmly agreed and socially acknowledged criteria for what makes a person a friend
7. VennMaker
An Actor-Centered Interactive Network Mapping Tool
design a software-based tool which is suitable for social network research
digitally displaying and analysing (egocentric) social networks (number, density, centrality of relationships)
data transfer to excel, Venn diagram; NetMap, UCINET)
VennMaker takes into account aspects of qualitative and quantitative network analyses
Networks can be elicited by interviewing informants with the software, or through the informants alone (guided through by wizards)
different network views or phases of a longitudinal network can be graphically and statistically compared