

MIT-Skoltech entrepreneurial ecosystems report 2014 _1
.pdfINTRODUCTION TO THE STUDY
1. Overview of the study
1.1. Context and aims
In 2011, Skolkovo Institute of Science and Technology (Skoltech) was established in partnership with MIT with a mission “to educate global leaders in innovation, advance scientific knowledge and foster new technologies to address critical issues facing Russia and the world”. A central component of this collaboration is the creation of an entrepreneurial infrastructure and culture within Skoltech that responds to and builds on its regional context.
Embedding entrepreneurship into the university mission and culture in distinctive – and often challenging – environments is an ambition not unique to the MIT Skoltech Initiative. Governments across the world are looking to technology innovation as a driver for national economic growth and to universities as the incubators of this national capacity. Many universities are therefore seeking to enhance their entrepreneurship and innovation (E&I) capabilities.
Universities operating within established technology hubs, such as Silicon Valley and Kendall Square in the US, clearly offer robust models for success within these environments. In addition, an increasing number of universities located within more challenging environments are establishing strong E&I profiles and reputations, some of which will undoubtedly become future national and international leaders. From here on, this group will be referred to as the ‘emerging leaders group’ (ELG).
The ELG offer insights for Skoltech and the wider academic community in two important domains:
•how to drive and manage a process of institutional transformation towards a more entrepreneurial model;
•how university-based ecosystems can be nurtured in cultural, economic and socio-political environments that may not be naturally conducive to E&I.
A phased benchmarking study was commissioned by the MIT Skoltech Initiative to draw on the experiences of the ELG and gain insight into the conditions and strategies associated with successful E&I transformations for universities operating in more challenging environments. In particular, it asked
“which are the world’s most highly-regarded university-based entrepreneurial ecosystems operating outside the established technology hubs?” and, “what can Skoltech and the international academic community learn from the experiences of these institutions?”. As well as supporting the on-going development of Skoltech, the study outputs have been designed to inform the development of future university-based ecosystems across the world.
1

leaders world emerging from evidence :ecosystems entrepreneurial based-university creating
1.2.The study approach
The primary data source for the study is one-to-one semi-structured interviews. This approach offered two particular advantages. Firstly, it directly tapped the expertise of the comparatively small group of individuals with direct experience of the world’s leading and emerging university-based entrepreneurial ecosystems. Secondly, unlike a larger-scale study, the process could be conducted quickly, enabling the findings to inform the on-going development of Skoltech.
The study was conducted between February 2012 and February 2014 and adopted a two-stage process:
•Phase 1: The first phase of the study sought to identify the world’s most highly-regarded universitybased technology driven ecosystems and characterise the approach taken by these top-ranked institutions. It focused both on universities with an established E&I capability, as well as on
those whose profile was seen to be emerging, often within more challenging environments. The evaluation drew on interviews with 61 experts from 20 countries, each with personal experience of building world-class entrepreneurial ecosystems and oversight of international best practice in university entrepreneurship. These interviews with thought leaders in the field provided insight into the international landscape for university-based E&I as well as the established and emerging leaders in the field. It also captured information on the range of metrics the experts used to underpin their recommendations and the critical success factors apparent for each top-ranked institution. Expert feedback was complemented by data gathered on each top-ranked university to characterise their E&I approach and performance.
•Phase 2: The second phase of the study focused specifically on the ELG, as identified by the expert interviewees in Phase 1. From this list, four highly-regarded universities were selected for detailed case study evaluation: Aalto University (Finland), Imperial College London (United Kingdom), Tomsk State University of Radioelectronics and Control Systems (Russia) and the University
of Auckland (New Zealand). Taken together, they represent entrepreneurial ecosystems that have developed within very different – and often challenging – cultural, economic and political environments over the last 25 years. Case study evaluations focused on the drivers, conditions,
change strategies and barriers associated with their E&I transformation. The major data-gathering tool for the case study evaluations was site visits to the selected institutions and one-to-one anonymised interviews with multiple ecosystem stakeholders, from both within and outside
the university. With between 30 and 35 interviews conducted for each case study, a total of 130 individuals were consulted for this phase of the study.
The two phases of the study are informed by almost 200 interviews with individuals with an in-depth knowledge of some of the world’s most highly-regarded university-based E&I ecosystems. As such, the study as a whole paints a rich picture of the opportunities and constraints facing emerging entrepreneurial universities across the world.
1.3.Structure of the Report
This document provides a summary of the study findings. It is structured around the two key phases of the benchmarking study, as outlined below.
The first section, Phase 1: the world’s leading entrepreneurial ecosystems, (Chapters 2-6) presents the results of Phase 1 of the study, summarising the outcomes of the expert interviews, including their recommendations on the world’s most successful university-based technology innovation ecosystems, including those operating in more challenging conditions, and the most appropriate metrics to evaluate
2

their performance. The section also provides a summary of the expert feedback on the success factors underpinning these leading university-based ecosystems as well as data summarising the E&I approach and performance of selected institutions.
The second section, Phase 2: case studies of well-regarded practice (Chapters 7-11) presents the outcomes of Phase 2 of the study, presenting case study evaluations of four highly-regarded universities whose international E&I profile was seen to be emerging. Each case study focuses on the context and process by which the university’s entrepreneurial capacity developed, the nature, impact and strengths of the E&I infrastructure established and the barriers to its growth.
The final section, Conclusions and recommendations (Chapters 12-13) provides a discussion of the study outcomes and draws broader recommendations for other universities wishing to strengthen their E&I capabilities. It considers in turn: (i) key features of the global landscape for university-based E&I, (ii) key features of the emerging leaders, (iii) models of E&I development amongst emerging leaders, and (iv) concluding comments and recommendations.
The report Appendices provide the full versions of each case study evaluation (Appendix A–D) as well as the background data and references for the cross-institutional E&I data presented.
3

phase 1 
THE WORLD’S LEADING ENTREPRENURIAL ECOSYSTEMS
4

2. Introduction to Phase 1
2.1. The Phase 1 approach
The initial phase of the benchmarking study was concerned with identifying the world’s most highlyregarded university-based ecosystems, including those operating in more challenging conditions, and characterising the approach taken by these top-ranked universities. It was conducted over a six-month period, between February and August 2012. The cross-institutional E&I data presented in Section 6 was subsequently updated during March–June 2014.
Phase 1 of the study started with a snapshot synthesis of current knowledge in the field to identify,
(i) frequently-referenced international experts to target during the interview process, (ii) available performance metrics relevant to university-based technology innovation ecosystems, and (iii) existing benchmarking studies in the field.
The major component, however, was the consultations with international experts. These focused on the experts’ views and recommendations in four areas: (i) the most appropriate metrics to evaluate the performance of a university-based technology innovation ecosystem, (ii) the world’s most successful university-based ecosystems, (iii) the world’s most effective university-based ecosystems operating in a challenging environment, and (iv) the critical factors seen to be underpinning the success of the topranked universities.
The interviews were complemented with performance and institutional data gathered for a selection of the top-ranked universities, collected via publicly-available sources or via direct requests to the institutions. The information collected was designed to characterise three aspects of each top-ranked university: (i) the institutional context (e.g. international ranking, student/staff numbers, research income etc.), (ii) their innovation and entrepreneurship approach (e.g. mechanisms offered to support faculty/student technology transfer, educational programmes in innovation and entrepreneurship, regional partnerships, etc.), and (iii) the research commercialisation output.
2.2. The experts
A total of 83 individuals, drawn from 23 countries, were invited for interview as part of this phase of the study. Invitations were sent out to an initial group of individuals recommended by the MIT/Skoltech team and identified through the literature. A ‘snowballing’ method was then used to identify further individuals for consultation, based on interviewee recommendation. Particular priority was given to individuals who were recommended by two or more experts.
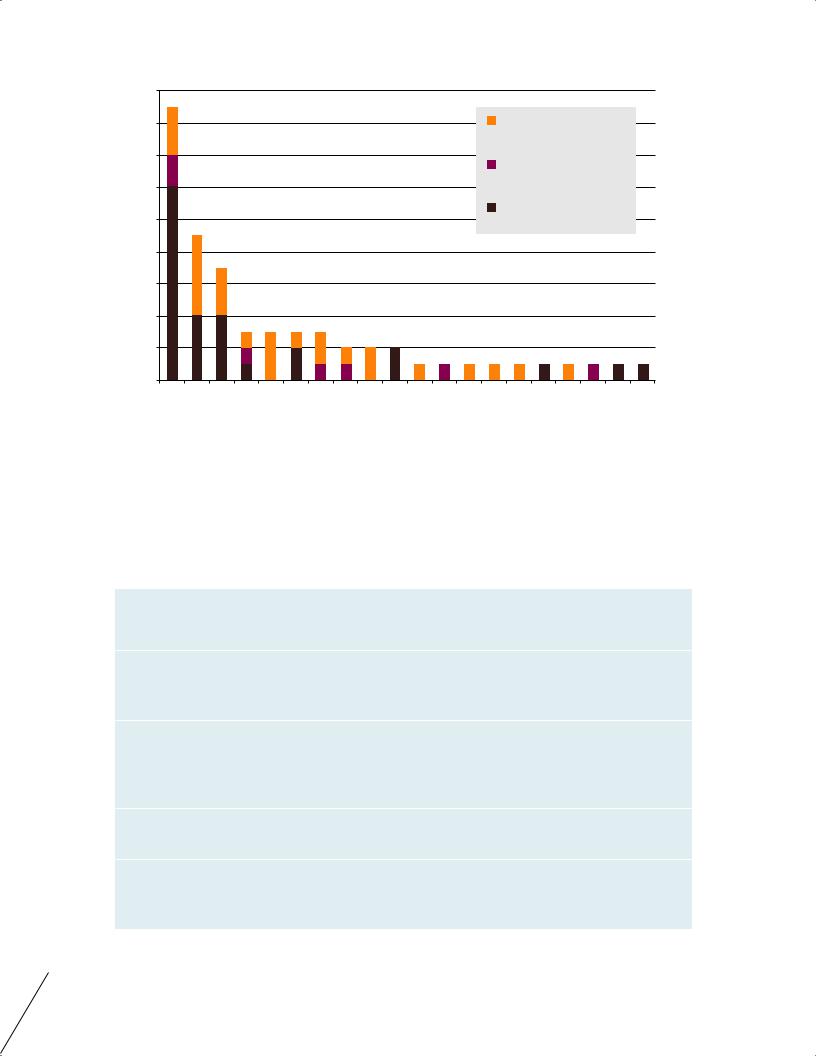
Of those initially contacted, a total of 61 individuals across 20 countries were interviewed for the study, as illustrated in Figure 2.
Interviews were typically of one hour in length. The questions used to frame each interview are provided in Figure 3.
During the later stages of the study, interviewees located at the emerging top-ranked universities were asked a broader set of questions to explore the E&I strategy and performance of the university
ecosystem in more depth. All questions were provided to each expert in advance. Two individuals chose to respond to these questions by email.
5
leaders world emerging from evidence :ecosystems entrepreneurial based-university creating
|
‚€ |
|
|
|
|
|
|
|
|
|
|
|
|
|
|
|
|
|
|
|
|
‚- |
|
|
|
|
|
|
|
|
|
|
|
|
|
Expert |
|
|
|
|
|
|
|
|
|
|
|
|
|
|
|
|
|
|
|
recommendations |
|
|
||||
|
|
|
|
|
|
|
|
|
|
|
|
|
|
|
|
|
||||
consulted |
‚ |
|
|
|
|
|
|
|
|
|
|
|
|
|
Literature |
|
|
|
|
|
|
|
|
|
|
|
|
|
|
|
|
|
|
|
|
|
|
|
|||
‚ |
|
|
|
|
|
|
|
|
|
|
|
|
|
|
|
|
|
|
|
|
‚ |
|
|
|
|
|
|
|
|
|
|
|
|
|
MIT-Skoltech team |
|
|||||
|
|
|
|
|
|
|
|
|
|
|
|
|
|
|
|
|
|
|
||
of experts |
€ |
|
|
|
|
|
|
|
|
|
|
|
|
|
|
|
|
|
|
|
- |
|
|
|
|
|
|
|
|
|
|
|
|
|
|
|
|
|
|
|
|
Number |
|
|
|
|
|
|
|
|
|
|
|
|
|
|
|
|
|
|
|
|
|
|
|
|
|
|
|
|
|
|
|
|
|
|
|
|
|
|
|
|
|
|
|
|
|
|
|
|
|
|
|
|
|
|
|
|
|
|
|
|
|
|
|
|
|
|
|
|
|
|
|
|
|
|
|
|
|
|
|
|
|
|
|
|
US |
UK |
Russia |
Australia |
Canada |
Italy |
Switzerland |
Belgium |
Finland |
Netherlands |
China |
Croatia |
France |
Germany |
Israel |
Mexico |
New Zealand |
Norway |
Saudi Arabia |
Singapore |
Figure 2. Experts interviewed, n=61, by country and how the individual was initially identified as a candidate for consultation (three categories: by the MIT/Skoltech team, by the study literature review or through recommendation from another expert).
1.What do you consider to be the most appropriate metrics to evaluate the performance/ success of a university-based technology innovation ecosystem?
2.Which universities would you identify as having created/supported the world’s most successful technology innovation ecosystems? For each university-based ecosystem, what factors do you feel are most responsible for their success?
3.Which universities, from across the world, would you identify as having created/ supported highly effective technology innovation ecosystems despite a challenging environment? For each university-based ecosystem, what factors do you feel are most responsible for their success?
4.What do you see as the critical factors in achieving success within your technology innovation ecosystem? What role have university activities/policies played?
5.Could you recommend any other individuals whom you feel should be consulted as part of this study?
Figure 3. Overarching questions used to frame expert interviews in Phase 1 of the study.
6

Two groups of experts were targeted for invitation:
1.Highly-cited research experts in the field with professional experience across multiple regions of the world. These individuals comprised around 25% of those invited for interview and they were largely identified through the snapshot literature review conducted as part of this study.
2.Individuals with direct experience within a technology innovation ecosystem at a well-regarded university and with professional experience across the world. These individuals comprised around 75% of those invited for interview, of which around a half were based within the university TTO (or equivalent) and the remaining half were engaged in other key roles (entrepreneur, government funding sponsor, company manager, university president etc.). These experts were identified as suitable candidates for interview either through recommendation from the MIT/ Skoltech team or through recommendation from other interviewees.
3. Metrics of ecosystem success
3.1. Metrics recommended by experts
All experts were asked to identify metrics through which the performance/success of a university-based technology innovation ecosystem should be measured (see question 1 in Figure 3). A wide range of indicators was considered to be relevant. The metrics most commonly identified by the experts are summarised in Figure 4, where they have been grouped into three broad categories:
1.Input indicators: metrics concerned with the university strategy and approach. Such metrics were seen to highlight, in the words of one expert, “whether entrepreneurship and innovation is at the core of the [university’s] mission”, a metric widely-regarded to be a key measure of institutional commitment to supporting long-term ecosystem development. Interviewees with a research background in innovation and entrepreneurship were particularly likely to identify metrics of this type. Two sets of metrics were described in particular: firstly, the prominence of E&I in the university’s policies and activities including resourcing levels and, secondly, the extent to which E&I education and training are available to all staff and students.
2.Process indicators: metrics concerned with entrepreneurial culture and innovation capacity within the university. Three types of metric were described: firstly, attitudes to and participation in entrepreneurial activities by staff and students; secondly, the extent of connectivity between the university and industry and/or other ecosystem stakeholders, particularly where no shortterm monetary gain was involved for any party; thirdly, the research quality and reputation of the university and the extent of its relevance to industry. As one expert commented, “… it is important to measure the climate, the entrepreneurial behaviour or intention to do something – how many people inside and outside of the university are capable of working together, how many students are interested in joining entrepreneurship classes – all of these things will tell you where [the university] is and where they will be going in the future”.
3.Output indicators: metrics concerned with the impact of the university on the ecosystem. Four types of metrics were recommended; firstly, the standard metrics for technology transfer throughput; secondly, the extent to which university-generated intellectual property (IP) has led to the creation of sustainable companies; thirdly, the entrepreneurial impact and wealth creation of university graduates; fourthly, the broader development of the ecosystem and beyond. US
experts in particular talked about the significant role played by university graduates in ecosystem |
7 |

leaders world emerging from evidence :ecosystems entrepreneurial based-university creating
development and the value of the Kauffman Foundation study of the impact of MIT alumni1 in this regard – “… this tells us about the number of entrepreneurs we are turning out. This tells us about creating the fishermen and not the fish”.
Experts were also asked to identify metrics of early ecosystem development, against which it may be possible to measure the performance of newly-established universities with an E&I focus, such as Skoltech, five years after their foundation. Generally speaking, their recommendations focused on two categories of process indicator; firstly, the individual student/staff attitudes and aspirations listed in section 2.1 of Figure 4; secondly, the relevance and quality of the university research, listed in section 2.3 of Figure 4. Most also cautioned against “overly ambitious targets in terms of research commercialisation”. They noted that the stable development of such activity, outside a one-off “blockbuster” innovation, would take at least 10-15 years.
3.2. Overall expert feedback on the influence of ecosystem metrics
Most experts noted that identifying a set of metrics to evaluate the performance of a university-based ecosystem was a considerable challenge, with concerns expressed about whether the standard metrics collected by organisations such as AUTM (Association of University Technology Managers)2 were fit for purpose. Indeed, the issue of metrics was clearly an emotive topic for a high proportion of the experts consulted. Many spoke at length about how the application of currently-accepted metrics (see
section 3.1 in Figure 4) can be misleading at best and retard ecosystem growth at worst. Expert feedback centred around two key issues: firstly, that these measures do not adequately reflect the true knowledge transfer capability or performance of a university; secondly, that their widespread application has had a significantly detrimental impact on entrepreneurship and innovation strategy at an institutional level in universities across the world. Each of these issues is addressed in turn below.
Many experts, particularly those based outside the US, were highly critical of the “standard metrics” (see section 3.1 in Figure 4) that are “convenient to collect, keep the funding bodies happy but do not tell you much about what is really happening”. Many also saw them as highly “manipulable” and “easily distorted by a single blockbuster”. Their primary focus on the university outputs was also noted as a cause of concern – “…you can’t understand a system by only looking at the outputs and not the inputs… At a lot of the so-called successful universities, the input is enormous amounts of government funding and what comes out is only a tiny fraction of that”. Overall, the views are well summarised by the feedback from one expert, “… there is no doubt that these metrics are easy to measure and no doubt that they tell us something about what is happening. But it is just one tiny piece of the whole picture. They tell us something about the outputs of the licensing office and the number of US Dollars that has been put into maintaining that. They tell us much less about the university as a whole and its contribution to the economy and its contribution to society”.
Given these concerns, it is perhaps not surprising that many experts spoke of the need to develop a new set of metrics. Like the existing metrics, these would capture and track activity at an institutional level, but would provide a much richer picture of the university’s role in knowledge transfer and ecosystem development. A number of experts noted that the 2008 Unico-commissioned report3 “has probably come
1Roberts, E. B and Eesley, C. Entrepreneurial Impact: The Role of MIT. Kauffman Foundation, Feb 2009.
2The US-based AUTM Licensing Survey gathers information such as the number of university startups, number of licences, number of invention disclosures, numbers of patents filed and licensing income.
3Holi, M. T., Wickramasinghe, R., & van Leeuwen, M. (2008). Metrics for the evaluation of knowledge transfer activities at universities. Cambridge: Library House.
8

1. Input indicators: institutional approach
1.1 University policies and activities:
Extent to which knowledge transfer and E&I activities are apparent within each school/centre in the university Connections between the E&I activities/policies across the university
Whether the university has sought to employ international experts in E&I to deliver programs
Breadth of activity/resources in place at the university (e.g. incubator/accelerator, student competitions, proof of concept centre) Level of university resource allocated to university/industry interactions
Extent to which innovation and entrepreneurship are considered in faculty recruitment/promotions procedures Whether opportunities are offered by the university for partnership with regional companies
1.2 Education and development opportunities offered:
Amount of curricular time devoted to entrepreneurship and innovation across all engineering and physical science disciplines Whether entrepreneurship and innovation training are offered to all university employees (including post-docs)
2. Process indicators: entrepreneurial culture and innovation capacity within the university
2.1 Individual student/staff attitudes and aspirations:
Student and staff career intentions and options (self reported) The prominence of faculty entrepreneurs as role models
The extent to which peer entrepreneurial talent is recognised and admired amongst the student body
Percentage of engineering/technology students and staff involved in voluntary entrepreneurship and innovation activities Whether student and staff participation in voluntary entrepreneurship activities is increasing
Faculty attitudes towards and level of trust in the university technology transfer office (or equivalent) Percentage of faculty engaged in disclosures/patenting activity
2.2 Connectivity and university/industry engagement:
Levels of web connectivity between the university and industry Number of students who combine study with jobs with high-tech firms
Proportion of engineering/technology students undertaking industry-based projects Numbers of joint publications between faculty and industry
The number of joint university/industry initiatives launched (for any purpose)
Involvement of practitioners in teaching and mentorship (numbers of professors of practice, entrepreneurs in residence etc.) The free movement of faculty in and out of the university
Growth in external attendee numbers (professional service providers, industry and investors) at networking events Number of university patents that are transferred to industry partners at no cost
Amount of pre-transactional interaction with industry (i.e. engagement that it not directed at securing a contract or licence)
2.3 Relevance and quality of university research:
Volume of industry-sponsored research (for some, this should be measured as a percentage of the total R&D budget) Average impact factor of faculty publications
Volume of faculty consultancy with industry (measured by both the percentage of faculty engaged and by the total income) International league table ranking for university
3. Output indicators: Ecosystem impact
3.1 Technology transfer office throughput (from university generated IP):
Number of disclosures and patents Number of start-ups/spin-offs
Number of licences or licensing success rates (number of licences per year/number of invention disclosures) Number of licences bearing royalties
Income generated from licences
3.2 The creation of sustainable companies (from university generated IP):
Company survival rate after 10-15 years
Numbers of companies with more than 20 employees (for some, total number of jobs created by companies)
Total money raised from external investors (for some, this should be measured as a percentage of research income) Total sales in the marketplace resulting from commercialisations
Total financial value of the companies created
3.3 The impact of the university graduates:
Percentage of alumni remaining in or returning to ecosystem Percentage of graduates working in technology-related businesses
Percentage of alumni (aged 30-40) engaged in starting new companies or engaged in innovation (self-reported) Wealth created by companies founded by university graduates
3.4 Broader development of the ecosystem and beyond:
Whether people (companies, entrepreneurs, investors, professional service providers) are moving into the region for opportunities Growth rate of all startups and high tech companies in the region (job growth, new investment etc.)
The extent to which university PhD students are employed by startup and new companies in the ecosystem Total employment generated by the ecosystem
Whether the university attracts entrepreneurially-minded, successful and ambitious students and faculty
Whether the university has contributed to changing policies in the country/region (such as creating national IP legislation)
Figure 4. A summary of expert responses to the question “What do you consider to be the most appropriate |
|
metrics to evaluate the performance/success of a university-based ecosystem?” |
9 |

leaders world emerging from evidence :ecosystems entrepreneurial based-university creating
as close as anyone” to achieving this to date. One expert commented, “the [Unico] metrics report appeals to me because it was very culturally sensitive. The matrix varies by institution and country, and the spider graphs are very different for each university”.
The second major focus of expert feedback was how “the easy-to-measure metrics of technology transfer office performance have somehow become a proxy [measure] for the university’s approach to E&I”, thereby skewing the strategy and focus of the whole institution. As a result of the widespread use of these metrics, universities were seen to have been focused on “making sure the graph of their patent numbers or startup numbers goes up and to the right” and “churning the handle of the licensing office” rather than developing a long-term strategy for ecosystem development. In particular, an overriding focus on faculty-generated IP is seen by many to have come at the cost of elements such as alumni
entrepreneurship or long-term strategic industry collaborations – “universities develop the entrepreneurs of the future not the ventures of today… We need to be measuring our activity not our output”. As one expert noted, “…a few startup companies will make little difference in the long-run. It is our students that will make by far the biggest impact [to the ecosystem], but we pay this very little attention”. Indeed, when describing the world’s most effective universities for this study, experts commonly spoke about “enlightened leadership” who “understand that knowledge transfer is not all about making a fast buck” and developing broad-reaching and long-term strategies that “look[ed] beyond the short-term gains of licences or spin-offs and nurture[ed] a culture of entrepreneurship in the staff and students that will stand the test of time”.
4. The expert ecosystem ‘rankings’
4.1. The most highly-regarded university-based ecosystems
All the experts were asked to identify the universities that they felt had created/supported the world’s most successful technology innovation ecosystems (see question 2 in Figure 3). A total of 120 different universities across 25 countries were identified by the 61 experts consulted.
The ten institutions most commonly cited by experts are summarised in Figure 5. It makes clear the dominance of MIT, Stanford University and the University of Cambridge, identified by over 80% (MIT and Stanford) and over 60% (Cambridge) of the experts.
To ensure that the leading positions held by these three institutions in the experts’ ‘top ten’ was not skewed by the relatively high proportion of interviewees from the US and UK, the data were reanalysed to take account of the country of residence of the expert. This second analysis excluded from the experts’ ‘top ten’ those institutions located in their country of residence; for example, it excluded recommendations for US universities made by US-based experts. As Figure 6 indicates, MIT, Stanford and Cambridge retain their premier position within this revised ranking. We can therefore be confident that the high proportion of USand UK-based experts is not skewing the results.
Figure 7 presents the data on the leading universities by their country location. As expected, successful technology innovation ecosystems are seen as most firmly embedded in the US and the UK. Again, the analysis has taken account of the country of residence of the experts.
Experts were also asked to discuss the reasons for their selections and the critical success factors for each of these universities. Selected feedback is summarised in Section 5 of this report.
10