

Tools and Applications of Biochemical Engineering Science
.pdf26 |
E. Stärk et al. |
Table 1. On-line estimation of the biomass concentration for different microorganisms by using culture fluorescence
Microorganisms |
References |
|
|
Pseudomonas putida |
57, 58 |
Zymomonas mobilis |
59, 60 |
Sporotrichum thermophile |
50 |
Bacillus subtilis |
50, 61 |
Alcaligenes eutrophus |
62 |
Eschericia coli |
50, 63, 64, 65, 71, 72 |
Clostridium acetobutylicum |
39, 54 |
Pedicoccus sp. |
73 |
Streptomyces sp. |
45, 74 |
Thermoactinomyces sp. |
74 |
Saccharomyces cerevisiae |
38, 45, 47, 50, 51, 66, 73, 75 |
Candida tropicalis |
47 |
Candida utilis |
66, 67, 74, 76 |
Penicillium chrysogenum |
49, 56 |
Cephalosporium acremonium |
77 |
Mucor mucosa |
78 |
Pseudomonas putida |
66 |
Spodoptera frugiperda |
77 |
Plant cells |
79 |
Human melanoma cells |
80 |
Mouse hybridoma cells |
53, 73, 81 |
|
|
Different simple correlations between biomass and fluorescence data showed that on-line estimation is possible under strictly defined culture conditions. Even a strictly linear relation between biomass and culture fluorescence was found for the growth of Zymomonas mobilis, Methylomonas mucosa, and
Pseudomonas putida under non-limited conditions [47].
As soon as the culture conditions were changed or limiting conditions occurred during the cultivation model deviations occur due to drastic changes of the intracellular coenzyme concentrations.
The monitoring of viable cell mass even in technical media is possible with this technique. However, fluorescence medium components might drastically interfere with the NADH-dependent fluorescence and signal disturbances occur caused by air bubbles (lowering the sensor readings) or large amounts of scattering particles.
While most applications were performed in suspended cell cultures some authors showed that the application of NADH-dependent fluorescence monitoring is also possible in immobilized cell systems. Here the growth of
Clostridium acetobutylicum and the Saccharomyces cerevisiae immobilized in different calcium alginate structures was studied. However, calibration of the culture fluorescence signal with the biomass concentration was not possible but qualitatively an increasing biomass also led to an increase in the fluorescence signals.
In conclusion it can be stated that accurate biomass estimation based on the culture fluorescence monitoring is possible, when the NAD(P)H-pool per cell is
In-Situ-Fluoresence-Probes: A Useful Tool for Non-invasive Bioprocess Monitoring |
27 |
constant and no interfering fluorescence occurs during the monitoring process. Thus, this technique is an excellent device for repeated standard cultivations (e.g., in industry) to provide an on-line monitoring of the biomass concentration. Under these controlled cultivation conditions an accurate estimation of the biomass is still possible, even when metabolic changes occur (aerobic/anaerobic transitions) [52]. It becomes obvious from all the publications that the bottleneck limitation of the fluorescence monitoring in regard to biomass estimation is the restriction to one single wavelength monitoring, since no verification of the signals is possible in regard to interfering fluorophors or disturbing factors (air bubbles, scattering particles).
6
Mixing Time Experiments
In order to quantify the physical environment of a bioreactor, fluorescence assays can be applied for on-line monitoring of the mixing time behavior of all types of bioreactors. In this case the fluorosensor probe can be installed in the bioreactor at different locations of interest. Afterwards, selected fluorophores can be injected in order to study the overall mixing time. These fluorophores must fit to the excitation and emission behavior of the probe and should be selected in regard to the pH-dependency of the bioprocess, and when used during cell cultivation experiments they should not interfere with the cells. Scheper and Schügerl reported on the use of different coumarins for mixing time experiments under bioprocess relevant conditions [49].
7
Cell Metabolism
Since the monitoring of the culture fluorescence is based on the NAD(P)H pools inside the cells, the observation of the fluorescence signals can be used to detect environmental and metabolic changes as a function of the culture conditions. Different applications are presented in the relevant literature as shown in Table 2. Metabolic changes during the growth, such as glycolytic oscillations in yeast or the metabolic shift in Clostridium acetobutylicum as a function of the process state, become obvious in the culture fluorescence signals. In chemostat cultures the changes in dilution rates are also reflected in the fluorescence signal, indicating that the metabolic pool and intracellular redox state changes depending on the dilution rate.
The dynamic behavior of the cell metabolism initiated by different external effects (addition of substrates or inhibiting reagents) can be followed via this instantaneous method. These effects can be used to control the overall process and optimize the bioprocess. Meyer and Beyeler [50] developed a control system for a continuous yeast cultivation process. Here the increase up to the optimal dilution rate was controlled via fluorescence monitoring. The dilution rate was only increased when no negative effect on the metabolic state of the cells was observed. During the cultivation of Candida utilis the fluorescence signal was used for the addition of substrate ethanol. The addition was started when
28 |
|
E. Stärk et al. |
Table 2. Metabolic studies on different microorganisms by using culture fluorescence |
||
|
|
|
On-line monitoring |
Microorganisms |
References |
|
|
|
Aerobic-anaerobic transition |
Klebsiella aerogenes |
44 |
|
Saccharomyces cerevisiae |
45, 60, 73, 82 |
|
Candida tropicalis |
47 |
|
Eschericia coli |
50, 65 |
|
C. guilliermondi |
83 |
Aeration rate |
Penicillium chrysogenum |
49, 56 |
Addition of carbon source to starved cells |
S. cerevisiae |
45, 73, 75, 82 |
|
C. tropicalis |
84 |
|
E. coli |
50 |
Diauxic growth |
S. cerevisiae |
82 |
Dilution rate changes |
S. cerevisiae |
75 |
|
E. coli |
64 |
|
Pseudomonas putida |
85 |
Culture synchrony |
S. cerevisiae |
60, 77 |
Glycolytic oscillations |
S. cerevisiae |
86, 87, 88 |
Metabolic shifts |
Thermoactinomyces sp. |
45 |
|
Clostridium acetobutylicum |
54, 89, 90, 91 |
|
S. cerevisiae |
51, 67 |
|
Hybridoma cells |
53 |
|
Penicillium chrysogenum |
56 |
Addition of metabolic uncoupler |
S. cerevisiae |
82, 86 |
|
|
|
the first signal decreased below a certain critical value. In calibration experiments this critical value was determined as an indicator for a low ethanol concentration. The same concept was also used in cultivation of thermo monospora species for optimal growth conditions.
The different applications listed in Table 2 show that culture fluorescence offers the opportunity to have non-invasive insight not only into the fluorophor behavior of the medium but also in the metabolic state. It gives information about the redox status of the cultivation, but still the danger of interference cannot be excluded. Thus, the interpretation of the data measured is often complicated and only successful for a standard cultivation process [51–65].
8
Multi-Wavelength Monitoring
In the early 1990s more and more research groups tried to circumvent the restrictions of single wavelength monitoring by developing different multi-wave- length systems. Again the research group of Humphrey was one of the pioneers in this area [66–68]. They reported on the use of different filter systems or modified spectrofluorometer systems, which were used to study the ethanol fermentation of Candida utilis and the phenol fermentation of Pseudomonas pu-
In-Situ-Fluoresence-Probes: A Useful Tool for Non-invasive Bioprocess Monitoring |
29 |
tina and the glucose fermentation of Saccharomyces cerevisiae. Excitation wavelengths of 289 nm, 313 nm, 365 nm, and 404 nm were used in the experiments. More information was available; however the interpretation was still complex. Based on tryptophan monitoring the amino acid concentration and protein expression could be followed. Even the use of a scanning spectrofluorometer interfaced to a bioreactor was reported; however mostly the restriction to only five or six wavelengths is reported [69, 70]. Tartakovsky and Sheintuch [71] were the first to report the use of the overall spectrum obtained, via the coupling of a spectrofluorometer to a bioreactor using fiber light guide cable. Here the information content of the scanning fluorometry signal during the cultivation of wild type or recombinant Escherichia coli and Saccharomyces cerevisiae is reported. It becomes obvious that different process parameters can be derived from this highly informative monitoring system.
9
BioView Sensor
The BioView sensor (DELTA Light & Optics, Denmark) was developed especially for industrial applications. It is capable of completely automatic optical measurement for monitoring and control of different bioprocesses. The instrument is conceived to withstand harsh industrial environments (e.g., high temperature, moisture) and electromagnetic interference. For data transfer a single-fiber asynchronous modem is used, which allows a distance between the computer and spectrometer of up to several hundred meters.
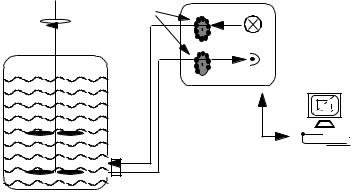
For on-line measurement the BioView sensor is connected directly by a 1.5-m bifurcated liquid light conductor (Lumatec, Germany) to a quartz window in a 25-mm electrode standard port of vessel bioreactor (Fig. 2). Contamination and sterilization problems could be avoided, because there is no contact between sensor and fermentation broth.
|
BioView Sensor |
Rotating Filter |
|
Wheels for |
Excitation |
Xe-Flash Lamp
Photomultipier
 Emission
Optical
Light-conducter
Data Aquisition and
Spectrometer Control
Optical Well
Bioreactor
Fig. 2. Schematic set-up of the 2D-fluorescence spectrometer (BioView sensor)
30 |
E. Stärk et al. |
The system uses independent filter wheels (Fig. 2) with up to 16 different filters for excitation (270–550 nm) and emission (310–590 nm) and performs measurements in steps of 20 nm, which was found to be most suitable without any loss of information. The number of measurements for each filter position can be individually chosen. Adapted to the different industrial processes, properties and steps of filters can be designed individually to cover most of the information potential. In addition it is possible to monitor single-wave- length pairs continuously. A high measuring frequency (10/s) enables in situ mixing time experiments for bioreactor characterization [49]. The singlewavelength pairs could be selected dependent of the available or suitable fluorophores.
The BioView sensor includes a software package (CAMO ASA, Norway) for data analysis and on-line estimation of different bioprocess variables simultaneously. Thus, the instrument is able to predict the trends of the concentration courses of different variables during a cultivation and is used to give information about important process steps (e.g., feeding time, harvesting time, etc.). The instrument is able to monitor on-line several fluorophores in situ and non-invasively during cultivation processes and permits an estimation of different bioprocess variables simultaneously. The increasing of cell mass concentration and the product formation as well as the actual metabolic state of the cells is simultaneously detectable by this fluorescence technique.
Problems like overlapping and interfering of fluorophores is overcome by the BioView sensor, which offers a comprehensive monitoring of the wide spectral range. Multivariate calibration models (e.g., partially least squares (PLS), principal component analysis (PCA), and neuronal networks) are used to filter information out of the huge data base, to combine different regions in the matrix, and to correlate different bioprocess variables with the courses of fluorescence intensities.
The potential of the application of 2D-fluorescence spectroscopy has been investigated by the cultivation of various microorganisms [3, 42]. Information about cell growth and metabolism was obtained and correlations to fluorescent product and substrate can be made. Marose et al. [42] correlated the off-line cell mass concentration during Saccharomyces cerevisiae cultivation with the culture fluorescence in the different regions of protein, NAD(P)H, riboflavin, and pyridoxine. This method for the on-line detection of biomass is especially suitable if the cells cannot be counted or solid particles in the medium exclude the method of weighing biomass. Even metabolic changes such as aerobic–anaero- bic transitions were detected by the 2D-fluorescence spectroscopy. Changes in the relation of oxidized to reduced form of NADH, FADH2 during the aero- bic–anaerobic transitions are obvious in the region of NADH fluorescence (Ex350/Em450 nm) and FAD/FMN (Ex450/Em530 nm).
Moreover, uncoupling experiments using Escherichia coli cells were described. An addition of glucose to stationary E. coli cells leads to an increase of fluorescence intensity in the region of NAD(P)H, because it is formed in the glycolysis. This increase was stopped abruptly by addition of 2,4 dinitrophenol (DNP), which effects a decrease in the fluorescence signal according to the theory of uncoupled oxidative phosphorylation. The dynamics of this process,
In-Situ-Fluoresence-Probes: A Useful Tool for Non-invasive Bioprocess Monitoring |
31 |
which takes place within seconds, can be seen with the 2D-fluorescence spectroscopy by performing the time scan.
During the cultivation of Claviceps purpurea the ergot alkaloids formation can be observed as the ergot alkaloids fluoresce by 2D-fluorescence spectroscopy as well. Quantitative analytical techniques for the determination of ergot alkaloids with a modified Van-Urk-assay [107] are invasive and time-consum- ing. Applying this technique the on-line determination of the exact harvesting time is possible. A further powerful application of BioView sensor is the on-line monitoring of biomass for this organism. Growth in micelles makes it impossible to count cells and also optical density could not be correlated to biomass during Claviceps purpurea cultivations. The method of 2D-fluorescence spectroscopy offers a variety of information about this complex organism and the product [42]. Also, for various cultivations of microbial degradation of the pollutant, 2D-fluorescence spectroscopy was used. The decrease of the fluorescence intensity of the substrate phenanthrene during the cultivation of Sphingomonas yanoikuyae could be observed on-line.
An on-line monitoring of an industrial chromatographic process was realized by using the BioView sensor. 2D-fluorescence spectroscopy allows automatic real time measurements directly at the outlet of the chromatographic columns. The fluorescence technique for separating different amino acids is faster and more accurate than conventional methods. The application of the BioView sensor will reduce costs and will increased the productivity of further chromatographic separations [92, 93].
10
The Application of a 2D-Spectrofluorometer for the Monitoring of High-Cell-Density Cultivations
High-cell-density cultivation (HCDC) is required to improve microbial biomass yield and product formation substantially. An overview of HCDC is given by Riesenberg and Guthke [94] for different microorganisms (bacteria, archeae, and eukarya) and by Lee and Blanch [95] for different recombinant Escherichia coli. The application of on-line fluorescence measurement by the BioView sensor has a favorable effect on the bioprocess monitoring and control, leading to economic and ecological advantages.
Historically, HCDC was first established for yeasts to produce single-cell protein, ethanol, and biomass. Later, dense cultures of other mesophiles producing various types of products were developed, e.g., by Suzuki et al. [96]. The combination of recombinant DNA technology and large-scale culture processes has enabled human proteins to be produced in a number of hosts, in particular in Escherichia coli [97–100]. Approaches to optimize the production of recombinant proteins are the subject of recent reviews from Winter et al. [101].
A major objective of fermentation in research industry is to maximize the volumetric productivity to obtain the highest possible amount of product in a given volume within in a certain time. The main problems arising from HCDC are limitation and/or inhibition of substrates with respect to growth, accumulation of products or metabolic by-products to a growth-inhibitory level, a high
32 |
E. Stärk et al. |
oxygen demand, as well as an increasing viscosity of the medium in very dense cultures [94]. Different types of bioreactors and fermentation strategies were developed to overcome these problems.
The membrane dialysis reactor designed by Märkl et al. [102] consists of two cylindrical chambers. Each chamber has its own stirrer and accessories for nu- trient-split feeding. The main advantage of the dialysis reactor is the continuous removal of inhibitory or toxic low-molecular-mass compounds from the fermentation broth without additional stress to cells [103]. The dialysis technique has turned out to be very efficient and reliable for obtaining high cell densities. If metabolites inhibiting cell growth are eliminated, the efficiency of several microbial or mammalian cell culture processes can be increased significantly. Ogbonna and Märkl [104] suggested a novel “nutrient-split” feeding strategy where the medium is split into a concentrated nutrient solution which is fed directly into the cultivation chamber and a dialyzing buffer solution containing inorganic salts for stabilization of the osmotic pressure. By applying a nutrientsplit feeding strategy, the loss of nutrients can be avoided and the medium is used very efficiently.
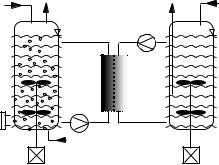
A scale-up of the dialysis reactor system for suspended cells is feasible by application of external dialysis modules, which are coupled between a culture vessel and a dialysis vessel (Fig. 3). The culture broth and dialysis medium are pumped in an external loop through the dialysis module.
High cell densities are not only a prerequisite for high productivity; additionally an effective on-line control and modeling of the bioprocesses is necessary. For industrial applications, optical measurement methods are more attractive because they are non-invasive and more robust. The potential of the BioView sensor for on-line bioprocess monitoring and control was tested. For high-cell- density cultivation of Escherichia coli, maintaining aerobic conditions and removal of inhibitory by-products are essential. Acetic acid is known to be one of the critical metabolites. Information about changes in the cell metabolism and the time of important process operations is accessible on-line for optimization
nutrient |
exhaust air |
waste |
buffer |
|
|
|
|
concentrate |
|
|
|
optical well
stirrer |
air |
stirrer |
|
dialysis |
|||
culture |
dialysis |
||
module |
|||
vessel |
|
vessel |
Fig. 3. Schematic design of a two-vessel arrangement for a scale-up of the dialysis technique
|
In-Situ-Fluoresence-Probes: A Useful Tool for Non-invasive Bioprocess Monitoring |
|
|
33 |
|
|
|
|||
|
|
|
|
|
|
|
|
|
|
|
|
|
|
|
|
|
|
|
|
|
|
|
|
|
|
|
|
|
|
|
|
|
Fluorescence intensity [rel. units] |
Ex470/Em510 nm |
|
|
|
Ex370/Em470 nm |
|
|
|
||
|
|
Fluorescence intensity [rel. units] |
|
|
|
|
||||
|
|
|
|
|
|
|
|
|||
|
|
|
|
|||||||
Ex330/Em390 nm |
|
|
|
Ex290/Em350 nm |
|
|
|
|||
|
|
|
|
|
|
|
|
|
|
|
|
|
|
|
|
|
|
|
|
|
|
|
|
|
|
|
|
|
|
|
|
|
|
|
|
|
|
|
|
|
|
|
|
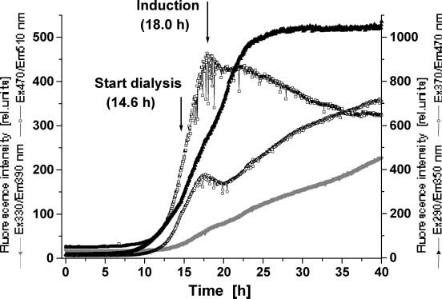
Fig. 4. Courses of culture fluorescence during a high-cell-density cultivation of E. coli
of these bioprocesses especially in regard to scale-up. Thus the BioView sensor is interfaced directly to an optical port of a 300-l culture vessel (Fig. 3). For the HCDC a minimal medium was used in a 300-l culture vessel, a pH of 7,1 and a temperature of 35°C [105].
2D-fluorescence spectra were automatically measured every 3 min. Courses of culture fluorescence during the HCDC of 40 h are shown in Fig. 4. The figure shows the increase of the relative fluorescence intensities (RFI) at the beginning of the exponential growth phase. After 14.6 h the dialysis was started for removal of inhibitory by-products and the slope of the protein dependent RFI at Ex290/Em350 nm increases. The induction of the protein synthesis is performed at an optical density of 100 or a cell dry mass concentration of about 40 g/l. This leads to a change in the cell metabolism after 18 h. The changes in cell physiology become obvious in a decrease of the NAD(P)H (Ex370/Em470 nm) and flavin dependent (Ex470/Em530 nm) fluorescence intensities.
During the process the optical properties of the medium also change in the protein-dependent fluorescence region (Ex290/Em350 nm) due to high intraand extracellular protein concentration. Thus no further increasing in fluorescence intensity can be observed at Ex290/Em350 nm after 25 h. However, the NAD(P)H and pyridoxine (Ex330/Em390 nm)-dependent RFI increase till the end of the HCDC (40 h), although an optical density of about 400 and a cell dry mass concentration of about 110 g/l was reached.
Fluorescence spectra include information about cell, metabolite, and product concentrations and the actual metabolic state of the cells, leading to a very complex system with interfering signals and overlapping of fluorescence regions.
34 |
E. Stärk et al. |
|
|
|
|
|
|
Fluorescence intensity [rel. units] Ex350/Em450 nm |
|
|
|
|
Cell dry mass [g/l] |
|
|
|
|
|
|
Time [h]
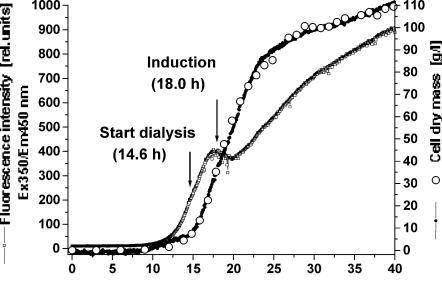
Fig. 5. Courses of predicted and off-line measured cell dry mass concentration and NAD(P)H-dependent relative fluorescence intensity during a high-cell-density cultivation of
E. coli
This problem is overcome by the BioView sensor, which offers the possibility to monitor the whole spectral range simultaneously, and by using suitable data analysis and mathematical methods like chemometric regression models [106]. Real-time fluorescence measurement can be used more effectively comparing time-consuming off-line methods. Partial least squares (PLS) calibration models were developed for simultaneous on-line prediction of the cell dry mass concentration (Fig. 5), product concentration (Fig. 6), and metabolite concentrations (e.g., acetic acid, not shown) from 2D spectra.
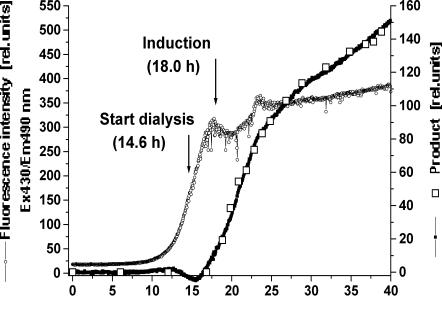
Figure 5 shows a good correlation (r = 0.9991) between off-line and predicted cell dry mass concentration. The root mean square error of calibration (RMSEC) amounts to 1.85 g/l. The regression model includes only information about cell growth and cell mass formation, but not about change in cell metabolism recognized in the NAD(P)H dependent RFI at Ex350/Em450 nm. Online prediction of bioprocess variables offers the possibility to start the dialysis and production steps at optimal process times. Also, Fig. 6 shows a good correlation (r = 0.9983) between off-line and predicted product concentration with an RMSEC of 3.07 rel. units. Product formation as well as the end of production could be observed on-line. The exact process time for harvest is recognizable, providing a ideally running bioprocess. The 2D fluorescence spectroscopy offers the possibility of controlling an optimal production run and productivity. Moreover the technique is also able to estimate non-fluorescent variables online, for instance the production of acetic acid and citric acid (not shown), de-
In-Situ-Fluoresence-Probes: A Useful Tool for Non-invasive Bioprocess Monitoring |
35 |
|
|
|
|
|
|
Fluorescence intensity [rel. units] Ex430/Em490 nm |
|
|
|
|
Product [rel. units] |
||
|
|
|
|
Time [h]
Fig. 6. Courses of predicted and off-line measured product concentration and pyridox- alphosphate-dependent relative fluorescence intensity during a high-cell-density cultivation of E. coli
pending on the biological activity of the cells. Riesenberg and Guthke [94] described the dependency of the cell physiology of Escherichia coli of the chemical (e.g., pH, medium compounds) and the physical (e.g., temperature, dissolved oxygen) environment. 2D fluorescence spectroscopy supported by mathematical models is even able to monitor the metabolic state of the cells. Based on these data the optimal cultivation conditions for higher production rate and yield can be obtained.
11 Conclusion
Modern optical sensors offer interesting applications in various fields of biotechnology. These sensors measure non-invasively and are able to detect different components inside and outside cells without time delay. Different educt, metabolite, and product concentrations can be monitored simultaneously with the cell count or cell mass and the actual metabolic state of the cells by using these sensitive optical analysis techniques. Based on multivariate calibration models a highly sophisticated process monitoring and control can be achieved, resulting in improved ecological and economical process management. Thus industrial application of optical sensor systems appears bright.