

AutoPeri(NM)
.pdfINTERPRETATION OF AUTOMATED PERIMETRY
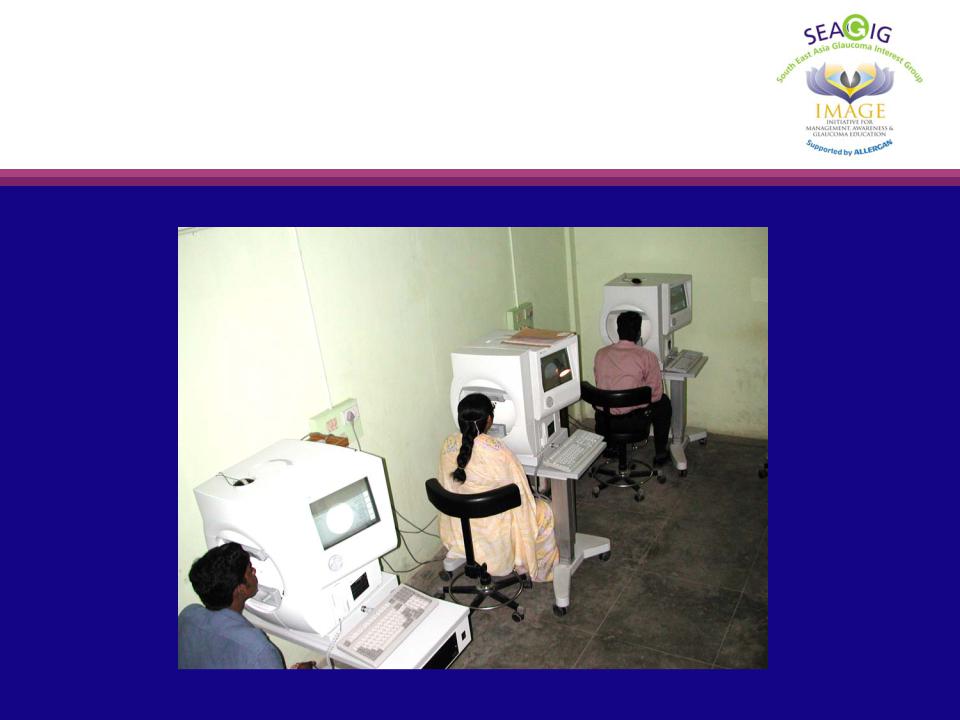
Automated perimetry
© Thomas R

Automated perimetry
I.Perimetry logic
II.Identifying field defects
III. Criteria for glaucomatous defects IV. Detecting glaucomatous progression
V.Advanced field defects
© Thomas R
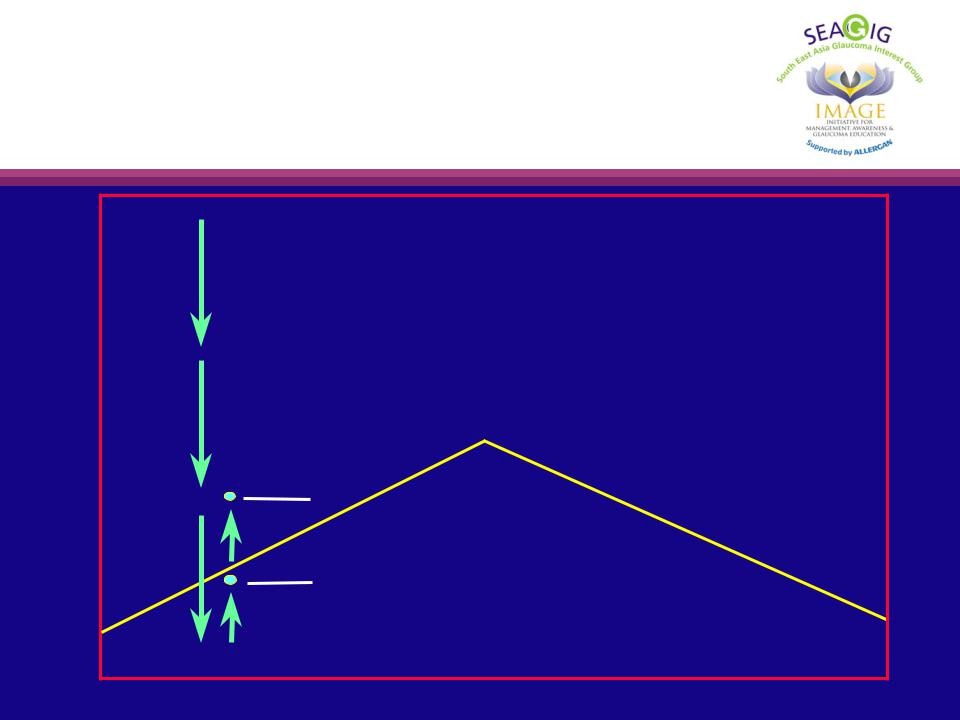
Bracketing strategy
B |
A |
© Thomas R |

Normal thresholds
•Mean threshold in disease-free fields
•In a given age group
•At a given location in the visual field
•Mean normal values are stored in the automated perimeter and compared against patient data
© Thomas R
Computers and ease of interpretation
Sensitivity
+
Simple set of rules
Computer
Diagnosis
© Thomas R

Perimeter logic (1)
•Sensitivity determined at each location
•Normal range developed
•Normal range is arbitrary
–Includes the values of 95% of the normal population
© Thomas R

Perimeter logic (2)
•‘Abnormal’ values include the lowest 5% of those in normal individuals
•Therefore, 5% of normal individuals will be labelled abnormal
‘Abnormal’ is not the same as diseased
© Thomas R

Perimeter logic (3)
•General population – 100 tested
•1% glaucoma; 99% normal
•Six will have abnormal tests:
•1 glaucoma patient
•5 normal individuals
© Thomas R

Perimeter logic (4)
•Clinic population – 100 tested
•30% glaucoma; 70% normal
•33 will have abnormal tests
•30 glaucoma patients
•3 normal individuals
© Thomas R