

getpdf
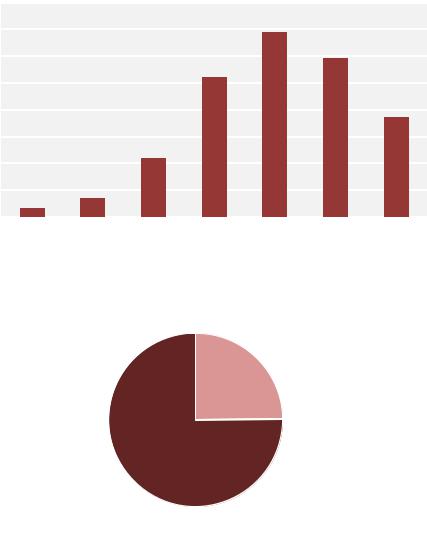
.pdfFigure 9. Initiation year of cluster initiative
Number of CIs
35 |
|
|
|
|
|
30 |
|
|
|
|
|
25 |
|
|
|
|
|
20 |
|
|
|
|
|
15 |
|
|
|
|
|
10 |
|
|
|
|
|
5 |
|
|
|
|
|
0 |
|
|
|
|
|
before 1985 |
1990 |
1995 |
2000 |
2005 |
2010 |
Cluster initiative staff size and website
Cluster initiatives typically are organised through small and nimble organisations. There is often an entrepreneurial spirit driving the organisation, walking across the gaps between actors inside clusters, and receiving financial support from a range of both public and private sources. Half of the organisations have 3 or fewer employees (Figure 10).
Figure 10. Number of employees in the cluster organisation
|
50 |
|
|
|
|
|
|
|
|
40 |
|
|
|
|
|
|
|
of CIs |
30 |
|
|
|
|
|
|
|
|
|
|
|
|
|
|
|
|
Number |
20 |
|
|
|
|
|
|
|
|
|
|
|
|
|
|
|
|
|
10 |
|
|
|
|
|
|
|
|
0 |
|
|
|
|
|
|
|
|
None |
1 empl |
2 empl |
3 empl |
4 empl |
5 empl |
6 10 |
11+ |
|
|
|
|
|
|
|
empl |
empl |
Participating firms
To succeed in bridging innovation gaps cluster organisations can facilitate dense networks and frequent face-to-face contact. Typically more than 50% of member firms are within one-hour driving distance (Figure 11). This is not to say that cluster initiatives are only local. There is also a global dimension to clusters, and many cluster organisations have networks with clusters around Europe and in some cases all around the world (closing the gap to global markets and value chains will be
15
discussed below), but rarely these are formal members. Regarding membership 75% of clusters have formal members, whereas 25% work in more loosely-coupled partnerships (Figure 12).
Figure 11. Share of cluster firms within one-hour driving distance from office
Number of CIs
80
70
60
50
40
30
20
10
0
~0% |
~5% |
~25% |
~50% |
~75% |
~95% |
~100% |
Figure 12. Share of CIs with formal membership
No formal membership
Has formal membership
The number of formal members varies. A majority of cluster organisations have from 20 and up to 100 members (Figure 13). Only a few CIs have limitations to formal membership (Figure 14). As well-functioning clusters are open innovation systems, this is well in line with earlier results (Greenbook, 2003). Limitations on firms outside the target region (almost 20%) are in line with the regional focus we expect from CIs.
16
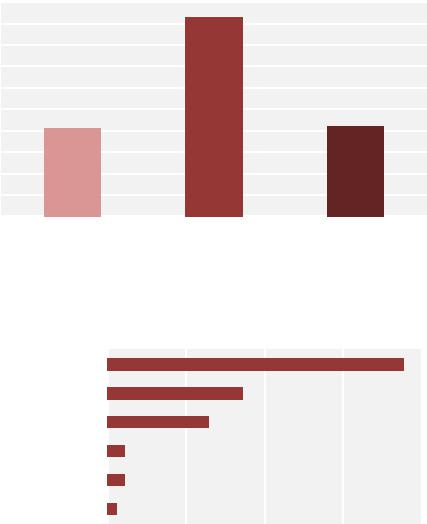
Figure 13. Number of formal members
Number of CIs
100
90
80
70
60
50
40
30
20
10
0
1 19 members |
20 99 members |
100+ members |
Figure 14. Share of CIs with limitations to formal membership
0% |
5% |
10% |
15% |
20% |
No firms outside "target region"
No foreign-owned firms
No non-firms
No large firms
No competing firms
Maximum number of firms
Trigger and funding
Cluster organisations are truly public-private partnerships. This can be seen from Figure 15, where public sector and private sector initiatives are equally common. The public-private partnership status is also underlined by the fact that some 40% of funding, on average (excluding “other”, see Figure 16) is private and 60% public. Older CIs tend to have somewhat higher revenues from sales of services (consulting) and somewhat less national public funding (Figure 17).
17
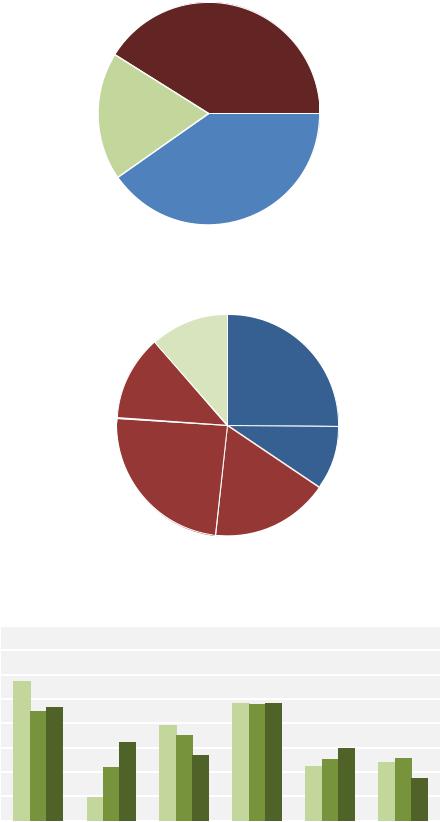
Figure 15. Original trigger for the initiation of the CI
Public sector 41%
Other
19%
Private sector 40%
Figure 16. Sources of CI revenues
Other
12% Membership fees
25%
International public 13%
Sales of services 9%
Regional / local public
24% Nat public
17%
Figure 17. Sources of CI revenues, by age of CI
40%
 0-4 yrs
  5-9 yrs
  10+ yrs
35%
30%
25%
20%
15%
10%
5%
0%
Membership |
Sales of |
National public Regional/ |
International |
Other |
fees |
services |
local |
public |
|
|
|
public |
|
|
18

The larger CIs have fewer revenues from membership fees and more income from services (Figure 18).
Figure 18. Sources of CI revenues, by size of CI staff
40%
|
0-1 empl |
|
2-5 empl |
|
6+ empl |
|
|
|
|||
|
|
|
35%
30%
25%
20%
15%
10%
5%
0%
Membership |
Sales of |
National public Regional/ |
International |
Other |
fees |
services |
local |
public |
|
|
|
public |
|
|
Objectives
Cluster organisations pursue a range of objectives. There most prioritised include building a cluster identity and branding the cluster/region, initiating innovation projects and R&D investment, and building a strategy and vision for the cluster. Business development objectives such as joint purchasing and export promotion attract less attention (Figure 19).
Figure 19. Level of priority for ten objectives
|
|
High prio |
|
Mid prio |
|
Low prio |
|
Not done |
|
|
|
|
|
|
|
||||
|
|
|
|
|
|
||||
0% |
20% |
40% |
60% |
80% |
100% |
||||
Identity and brand
Innovation and R&D
Strategy and vision
Business environment
Growth and investment
Export promotion
Value chain development
HR uppgrading
HR supply
Joint purchasing
Younger CIs have a strong focus on identity and cluster/region branding. After a few years of existence strategy and vision becomes more critical (Figure 20).
19
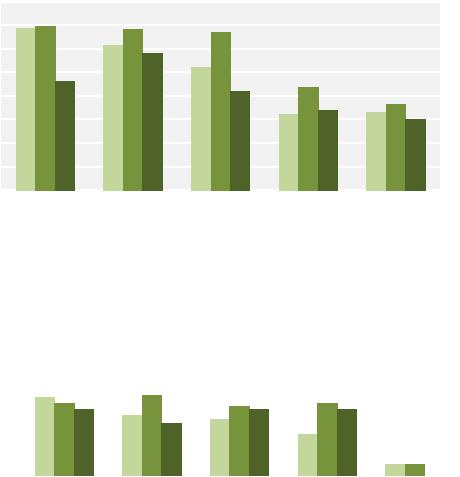
Figure 20. High-priority shares for ten objectives, by CI age group
 0-4 yrs
  5-9 yrs
  10+ yrs
80%
70%
60%
50%
40%
30%
20%
10%
0%
Identity and brand Innovation and |
Strategy and |
|
|
Business |
Growth and |
||||||
|
R&D |
vision |
|
|
environment |
investment |
|||||
80% |
|
|
0-4 yrs |
|
5-9 yrs |
|
10+ yrs |
|
|||
|
|
|
|
|
|||||||
|
|
|
|
|
|||||||
|
|
|
|
|
|
|
|
|
|
||
|
|
|
|
|
|
|
|
|
|
||
70% |
|
|
|
|
|
|
|
|
|
|
|
60% |
|
|
|
|
|
|
|
|
|
|
|
50% |
|
|
|
|
|
|
|
|
|
|
|
40% |
|
|
|
|
|
|
|
|
|
|
|
30% |
|
|
|
|
|
|
|
|
|
|
|
20% |
|
|
|
|
|
|
|
|
|
|
|
10% |
|
|
|
|
|
|
|
|
|
|
|
0% |
|
|
|
|
|
|
|
|
|
|
|
Export promotion Value chain |
HR uppgrading |
HR supply |
Joint purchasing |
||||||||
|
|||||||||||
|
development |
|
|
|
|
|
|
|
|||
Innovation and R&D objectives are most critical to the larger cluster organisations (Figure 21). Larger CIs are also more prone to work with cluster growth and investment attraction from the outside.
20
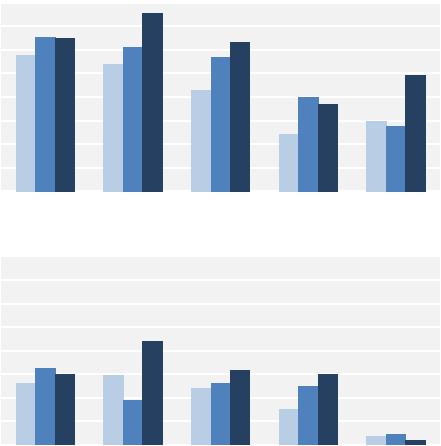
Figure 21. High-priority shares for ten objectives, by staff size group
 0-1 empl
  2-5 empl
  6+ empl
80%
70%
60%
50%
40%
30%
20%
10%
0%
Identity and brand Innovation and |
Strategy and |
Business |
Growth and |
|||||
R&D |
|
vision |
environment |
investment |
||||
|
|
0-1 empl |
|
2-5 empl |
|
6+ empl |
|
|
|
|
|
|
|
||||
|
|
|
|
|
||||
80%
70%
60%
50%
40%
30%
20%
10%
0%
Export promotion |
Value chain |
HR uppgrading |
HR supply |
Joint purchasing |
|
development |
|
|
|
The cluster manager
To manage cluster organisations has become a profession. During the 1990s this was a novelty and many cluster mangers were true entrepreneurs, or as we labelled them in the Greenbook “clusterpreneurs”. Now, cluster initiatives have turned into more stable organisations, and many cluster managers have been trained in cluster schools (e.g. Clusterland in Linz, IESE in Barcelona, REG X in Kolding). Furthermore, there is an organisation for cluster accreditation (ESCA), and a special club for cluster managers (ECMS). Many cluster managers are newcomers but some 20% now have more than 10 years of experience (see Figure 22).
21

Figure 22. Cluster manager’s experience with cluster initiatives
Number of CIs
90
80
70
60
50
40
30
20
10
0
<1 yr |
1-2 yrs |
3-5 yrs |
6-10 yrs |
10+ yrs |
Governance
Cluster organisations typically follow a life-cycle, beginning with a project initiative that later evolves into a formal organisation. Out of all surveyed CIs in Europe, 65% are legal entities (e.g. nonprofit, endowments), whereas 35% are projects belonging to some form of organisation (e.g. regional economic development unit or formal cluster umbrella organisation), see Figure 23. Private sector dominates CI boards (59%), with academia second (17%) and public sector officials third (15%). Board members from the financial sector play very limited roles (2%), see Figure 24.
Figure 23. Legal status of Cluster Initiative
Not a legal entity Legal entity 35%
65%
22
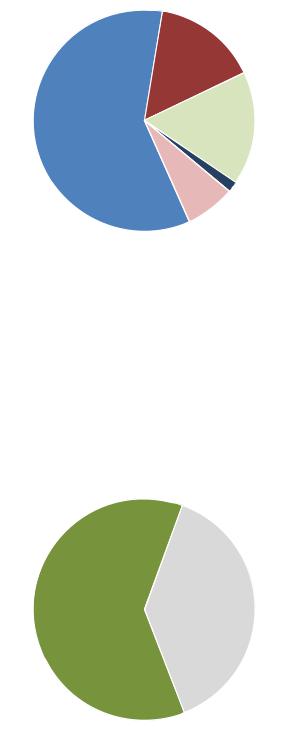
Figure 24. Average sectoral composition of main governing board
Public sector 15%
Private sector |
Academia |
|
17% |
||
59% |
||
|
Financial inst. 2%
Non-profit 7%
Evaluation
61% of European CIs are formally evaluated as opposed to 39% that do not have this as a requirement (Figure 25). As we discussed above cluster programmes should include rules regarding evaluation, and thus we think that 61% is still a very low figure. Formal cluster evaluation is critical for learning and adjustment of strategies, and ultimately for improved competitiveness of clusters in Europe. For CIs that are evaluated the frequency is high with yearly evaluations for some 90% of the organisations (Figure 26).
Figure 25. Share of CIs that are subject to a formal evaluation program
Subject to formal |
Not subject to |
evaluation |
formal evaluation |
61% |
39% |
23

Figure 26. Frequency of data collection for evaluation
Number of CIs
140
120
100
80
60
40
20
0
Every year |
Less than every year |
Never |
Data for evaluations range from surveys, to interviews, to peer benchmarking and industry statistics (Figure 27). Official statistics are used to a lesser extent which can pose a problem. As was discussed earlier, statistical control groups are for example critical to pick up outside explanatory factors.
Figure 27. Sources used for evaluation of CI performance
Share of CIs
|
Every year |
|
Less often than every year |
|
Never |
|
|
|
|||
|
|
|
100%
80%
60%
40%
20%
0%
Member |
Stakeholder |
Peer |
Industry |
surveys |
interviews |
benchmarking |
statistics |
Performance of Cluster Initiatives
Three questions were used to measure external performance of the cluster initiative over the last three years: growth of cluster (number of firms, employment); innovation (new products and services); and international competitiveness of the cluster firms. Four questions referred to internal performance over the last three years: ability to meet deadlines; ability to meet goals; financial sustainability; and ability to attract new members and participants.
24