

Varian Microeconomics Workout
.pdf(d) The Paasche quantity index for 1890 with base year 1850 is the ratio of the value of the 1890 bundle at 1890 prices to the value of the 1850 bundle at 1890 prices. Calculate the Paasche quantity index for 1890 with
base year 1850. |
|
. |
(e) The Laspeyres price index for 1890 with base year 1850 is calculated using 1850 quantities for weights. Calculate the Laspeyres price index for
1890 with base year 1850 for this group of four staple foods. |
|
. |
(f) If a Swede were rich enough in 1850 to a®ord the 1890 bundle of staple
foods in 1850, he would have to spend |
|
|
times as much on these |
|
|||
foods as does the typical Swedish worker of 1850. |
|
||
(g) If a Swede in 1890 decided to purchase the same bundle of food staples that was consumed by typical 1850 workers, he would spend the fraction
of the amount that the typical Swedish worker of 1890 spends on these goods.
7.11 (0) This question draws from the tables in the previous question. Let us try to get an idea of what it would cost an American family at today's prices to purchase the bundle consumed by an average Swedish family in 1850. In the United States today, the price of °our is about $.40 per kilogram, the price of meat is about $3.75 per kilogram, the price of milk is about $.50 per liter, and the price of potatoes is about $1 per kilogram. We can also compute a Laspeyres price index across time and across countries and use it to estimate the value of a current US dollar relative to the value of an 1850 Swedish kronor.
(a) How much would it cost an American at today's prices to buy the bundle of staple food commodities purchased by an average Swedish working-
class family in 1850? |
|
. |
|
(b) Myrdal estimates that in 1850, about 2=3 of the average family's budget was spent on food. In turn, the four staples discussed in the last question constitute about 2=3 of the average family's food budget. If the prices of other goods relative to the price of the food staples are similar in the United States today to what they were in Sweden in 1850, about how much would it cost an American at current prices to consume the same overall consumption bundle consumed by a Swedish working-class
family in 1850? |
|
. |

(c) Using the Swedish consumption bundle of staple foods in 1850 as weights, calculate a Laspeyres price index to compare prices in current
American dollars relative to prices in 1850 Swedish kronor.
If we use this to estimate the value of current dollars relative to 1850 Swedish kronor, we would say that a U.S. dollar today is worth about
1850 Swedish kronor.
7.12 (0) Suppose that between 1960 and 1985, the price of all goods exactly doubled while every consumer's income tripled.
(a) Would the Laspeyres price index for 1985, with base year 1960 be
less than 2, greater than 2, or exactly equal to 2? |
|
What |
||
about the Paasche price index? |
|
|
. |
|
(b) If bananas are a normal good, will total banana consumption in-
crease? If everybody has homothetic preferences, can you determine by what percentage total banana consumption must have in-
creased? Explain.
.
7.13 (1) Norm and Sheila consume only meat pies and beer. Meat pies used to cost $2 each and beer was $1 per can. Their gross income used to be $60 per week, but they had to pay an income tax of $10. Use red ink to sketch their old budget line for meat pies and beer.

Beer |
|
|
|
|
|
|
60 |
|
|
|
|
|
|
50 |
|
|
|
|
|
|
40 |
|
|
|
|
|
|
30 |
|
|
|
|
|
|
20 |
|
|
|
|
|
|
10 |
|
|
|
|
|
|
0 |
10 |
20 |
30 |
40 |
50 |
60 |
|
|
|
|
|
Meat pies |
|
(a) They used to buy 30 cans of beer per week and spent the rest of their
income on meat pies. How many meat pies did they buy? .
(b)The government decided to eliminate the income tax and to put a sales tax of $1 per can on beer, raising its price to $2 per can. Assuming that Norm and Sheila's pre-tax income and the price of meat pies did not change, draw their new budget line in blue ink.
(c)The sales tax on beer induced Norm and Sheila to reduce their beer consumption to 20 cans per week. What happened to their consumption
of meat pies? |
|
|
How much revenue did this tax |
|
raise from Norm and Sheila? |
|
|
. |
|
(d) This part of the problem will require some careful thinking. Suppose that instead of just taxing beer, the government decided to tax both beer and meat pies at the same percentage rate, and suppose that the price of beer and the price of meat pies each went up by the full amount of the tax. The new tax rate for both goods was set high enough to raise exactly the same amount of money from Norm and Sheila as the tax on
beer used to raise. This new tax collects $ |
|
|
for every bottle of beer |
||
sold and $ |
|
for every meat pie sold. |
(Hint: If both goods are |
||

taxed at the same rate, the e®ect is the same as an income tax.) How large an income tax would it take to raise the same revenue as the $1 tax
on beer? Now you can ¯gure out how big a tax on each good is equivalent to an income tax of the amount you just found.
(e) Use black ink to draw the budget line for Norm and Sheila that corresponds to the tax in the last section. Are Norm and Sheila better o® having just beer taxed or having both beer and meat pies taxed if both
sets of taxes raise the same revenue? |
|
(Hint: Try to use the |
principle of revealed preference.) |
|
|

It is useful to think of a price change as having two distinct e®ects, a substitution e®ect and an income e®ect. The substitution e®ect of a price change is the change that would have happened if income changed at the same time in such a way that the consumer could exactly a®ord her old consumption bundle. The rest of the change in the consumer's demand is called the income e®ect. Why do we bother with breaking a real change into the sum of two hypothetical changes? Because we know things about the pieces that we wouldn't know about the whole without taking it apart. In particular, we know that the substitution e®ect of increasing the price of a good must reduce the demand for it. We also know that the income e®ect of an increase in the price of a good is equivalent to the e®ect of a loss of income. Therefore if the good whose price has risen is a normal good, then both the income and substitution e®ect operate to reduce demand. But if the good is an inferior good, income and substitution e®ects act in opposite directions.
A consumer has the utility function U(x1; x2) = x1x2 and an income of $24. Initially the price of good 1 was $1 and the price of good 2 was $2. Then the price of good 2 rose to $3 and the price of good 1 stayed at $1. Using the methods you learned in Chapters 5 and 6, you will ¯nd that this consumer's demand function for good 1 is D1(p1; p2; m) = m=2p1 and her demand function for good 2 is D2(p1; p2; m) = m=2p2. Therefore initially she will demand 12 units of good 1 and 6 units of good 2. If, when the price of good 2 rose to $3, her income had changed enough so that she could exactly a®ord her old bundle, her new income would have to be (1 £12) + (3 £6) = $30. At an income of $30, at the new prices, she would demand D2(1; 3; 30) = 5 units of good 2. Before the change she bought 6 units of 2, so the substitution e®ect of the price change on her demand for good 2 is 5 ¡ 6 = ¡1 units. Our consumer's income didn't really change. Her income stayed at $24. Her actual demand for good 2 after the price change was D2(1; 3; 24) = 4. The di®erence between what she actually demanded after the price change and what she would have demanded if her income had changed to let her just a®ord the old bundle is the income e®ect. In this case the income e®ect is 4 ¡ 5 = ¡1 units of good 2. Notice that in this example, both the income e®ect and the substitution e®ect of the price increase worked to reduce the demand for good 2.
When you have completed this workout, we hope that you will be able to do the following:
²Find Slutsky income e®ect and substitution e®ect of a speci¯c price change if you know the demand function for a good.
²Show the Slutsky income and substitution e®ects of a price change on an indi®erence curve diagram.

²Show the Hicks income and substitution e®ects of a price change on an indi®erence curve diagram.
²Find the Slutsky income and substitution e®ects for special utility functions such as perfect substitutes, perfect complements, and Cobb-Douglas.
²Use an indi®erence-curve diagram to show how the case of a Gi®en good might arise.
²Show that the substitution e®ect of a price increase unambiguously decreases demand for the good whose price rose.
²Apply income and substitution e®ects to draw some inferences about behavior.
8.1(0) Gentle Charlie, vegetarian that he is, continues to consume
apples and bananas. His utility function is U(xA; xB) = xAxB. The price of apples is $1, the price of bananas is $2, and Charlie's income is $40 a day. The price of bananas suddenly falls to $1.
(a) Before the price change, Charlie consumed |
|
apples and |
bananas per day. On the graph below, use black ink to draw Charlie's original budget line and put the label A on his chosen consumption bundle.
(b) If, after the price change, Charlie's income had changed so that he could exactly a®ord his old consumption bundle, his new income would
have been |
|
|
With this income and the new prices, Charlie would |
|||
consume |
|
|
|
apples and |
|
bananas. Use red ink to draw |
the budget line corresponding to this income and these prices. Label the bundle that Charlie would choose at this income and the new prices with the letter B.
(c) Does the substitution e®ect of the fall in the price of bananas make
him buy more bananas or fewer bananas? |
|
|
|
How many |
||
|
|
|
||||
more or fewer? |
|
|
|
|
. |
|
(d) After the price change, Charlie actually buys |
|
|
apples and |
|||
bananas. Use blue ink to draw Charlie's actual budget line after the price change. Put the label C on the bundle that he actually chooses after the price change. Draw 3 horizontal lines on your graph, one from A to the vertical axis, one from B to the vertical axis, and one from C to the vertical axis. Along the vertical axis, label the income e®ect, the substitution e®ect, and the total e®ect on the demand for bananas. Is the

blue line parallel to the red line or the black line that you drew before?
.
Bananas
40
30
20
10
0 |
10 |
20 |
30 |
40 |
|
|
|
|
Apples |
(e) The income e®ect of the fall in the price of bananas on Charlie's demand for bananas is the same as the e®ect of an (increase, decrease)
|
in his income of $ |
|
per day. |
Does the income |
||||
e®ect make him consume more bananas or fewer? |
|
|
How many |
|||||
more or how many fewer? |
|
|
|
|
. |
|||
(f) Does the substitution e®ect of the fall in the price of bananas make
Charlie consume more apples or fewer? |
|
How many more or |
||||
|
||||||
fewer? |
|
Does the income e®ect of the fall in the price of |
||||
bananas make Charlie consume more apples or fewer? |
|
What |
||||
is the total e®ect of the change in the price of bananas on the demand for
apples? .
8.2 (0) Neville's passion is ¯ne wine. When the prices of all other goods are ¯xed at current levels, Neville's demand function for highquality claret is q = :02m ¡ 2p, where m is his income, p is the price of claret (in British pounds), and q is the number of bottles of claret that he demands. Neville's income is 7,500 pounds, and the price of a bottle of suitable claret is 30 pounds.
(a) How many bottles of claret will Neville buy? |
|
. |
|
(b) If the price of claret rose to 40 pounds, how much income would Neville have to have in order to be exactly able to a®ord the amount of claret and the amount of other goods that he bought before the price change?
At this income, and a price of 40 pounds, how many
bottles would Neville buy? |
|
. |
(c) At his original income of 7,500 and a price of 40, how much claret
would Neville demand? |
|
. |
(d) When the price of claret rose from 30 to 40, the number of bottles
that Neville demanded decreased by |
|
|
|
The substitution e®ect (in- |
||||||||
creased, reduced) |
|
his demand by |
|
|
bottles and the |
|||||||
|
|
|||||||||||
income e®ect (increased, reduced) |
|
|
|
his demand by |
|
|
|
|||||
|
|
|
|
|
|
|
|
. |
|
|||
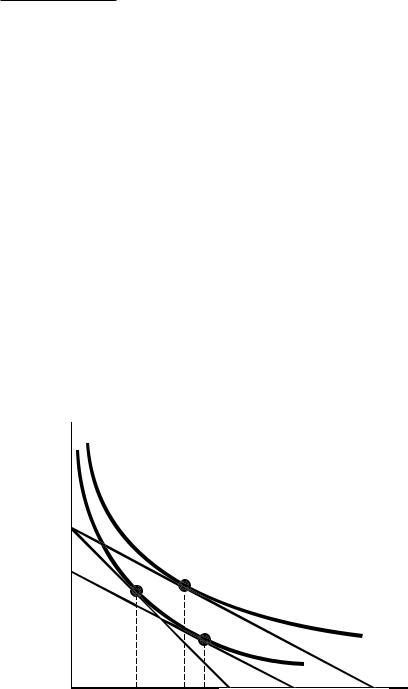
8.3 (0) Note: Do this problem only if you have read the section entitled \Another Substitution E®ect" that describes the \Hicks substitution effect". Consider the ¯gure below, which shows the budget constraint and the indi®erence curves of good King Zog. Zog is in equilibrium with an income of $300, facing prices pX = $4 and pY = $10.
Y
3 0
22.5
|
|
|
|
|
X |
|
30 |
35 43 |
75 |
90 |
120 |
||
|
(a) How much X does Zog consume? |
|
. |

(b) If the price of X falls to $2.50, while income and the price of Y stay
constant, how much X will Zog consume? |
|
. |
(c) How much income must be taken away from Zog to isolate the Hicksian income and substitution e®ects (i.e., to make him just able to a®ord to
reach his old indi®erence curve at the new prices)? |
|
. |
(d) The total e®ect of the price change is to change consumption from
the point |
|
to the point |
|
. |
(e) The income e®ect corresponds to the movement from the point
|
to the point |
|
|
while the substitution e®ect corresponds |
|||
to the movement from the point |
|
to the point |
|
. |
|||
(f) Is X a normal good or an inferior good? |
|
. |
(g) On the axes below, sketch an Engel curve and a demand curve for Good X that would be reasonable given the information in the graph above. Be sure to label the axes on both your graphs.

8.4 (0) Maude spends all of her income on delphiniums and hollyhocks. She thinks that delphiniums and hollyhocks are perfect substitutes; one delphinium is just as good as one hollyhock. Delphiniums cost $4 a unit and hollyhocks cost $5 a unit.
(a) If the price of delphiniums decreases to $3 a unit, will Maude buy
more of them? What part of the change in consumption is due to the income e®ect and what part is due to the substitution e®ect?
.
(b) If the prices of delphiniums and hollyhocks are respectively pd = $4 and ph = $5 and if Maude has $120 to spend, draw her budget line in blue ink. Draw the highest indi®erence curve that she can attain in red ink, and label the point that she chooses as A.
Delphiniums
40
30
20
10
0 |
10 |
20 |
30 |
40 |
|
|
|
Hollyhocks |
|