

exploring-splunk
.pdfExploring Splunk
distance |
time |
< elds. . . > |
|
|
distance |
time |
velocity |
< elds. . . > |
50 |
10 |
. . . |
|
|
50 |
10 |
5 |
. . . |
100 |
10 |
. . . |
|
100 |
10 |
10 |
. . . |
|
200 |
5 |
. . . |
|
200 |
5 |
40 |
. . . |
|
previous |
nal results |
search results |
|
...| |
eval velocity=distance/time |
|
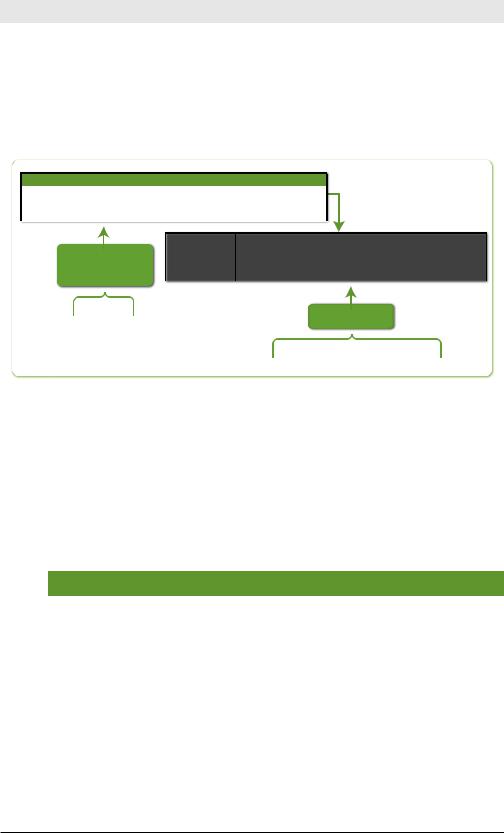
Figure 4-14. eval Command Example
The eval command results create a new velocity field. (If a velocity field exists, the eval command updates its value.) The eval command creates or overrides only one field at a time.
rex
The rex command extracts fields whose value matches a specified Perl
Compatible Regular Expression (PCRE). (rex is shorthand for regular expression.)
What Are Regular Expressions?
Think of regular expressions as “wildcards on steroids.” You’ve probably looked for files with expressions like *.doc or *.xls. Regular expressions let you take that to a whole new level of power and flexibility. If you’re familiar with regular expressions, you’re probably not reading this box. To learn more, see http://www. regular-expressions.info —easily the best site on the topic.
Table 4-15. rex Command Examples
Command |
Result |
|
… | rex “From: (?<from>.*) |
Extract from and to fields using regu- |
|
To: (?<to>.*)” |
lar expressions. If a raw event con- |
|
|
||
|
tains “From: Susan To: Bob”, then |
|
|
from=Susan and to=Bob. |
|
|
|
|
rex field=savedsearch_id |
Extract user, app, and SavedSearch- |
|
(?<user>\w+);(?<app>\w+); |
Name from a field called saved- |
|
(?<SavedSearchName>\w+) |
||
search_id. If savedsearch_id = |
||
|
||
|
“bob;search;my_saved_search”, |
|
|
then user=bob, app=search, and |
|
|
SavedSearchName=my_saved_ |
|
|
search. |
52
Chapter 4: SPL: Search Processing Language
rex mode=sed “s/(\\d{4}-){3}/ |
Use sed syntax to match the regex to |
XXXX-XXXX-XXXX-/g” |
a series of numbers, and replace them |
|
|
|
with an anonymized string. |
|
|
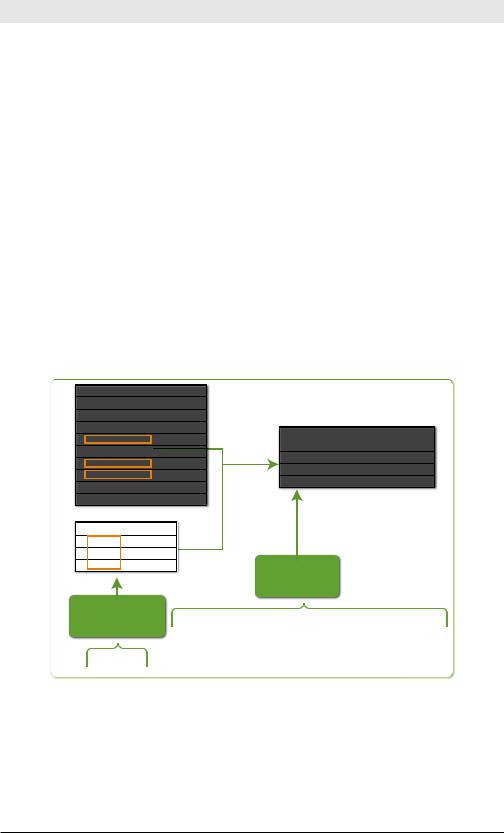
Figure 4-15 illustrates the first example inTable 4-15, extracting from and to fields.
_raw
From: Susan To: Bob Subject: current to-do list Message Hi Bob, I wanted to …
From: Meenu Subject: version 6 docs Message Hi Jan, Let's set up a time to …
From: John To: Miguel Message Here's what we need to arrange for the . . .
|
from |
to |
_raw |
previous |
Susan |
Bob |
Subject: current to-do list Message Hi Bob, I wanted to … |
Meenu |
|
Subject: version 6 docs Message Hi Jan, Let's set up a time to … |
|
search results |
John |
Miguel |
Message Here's what we need to arrange for the . . . |
...| |
|
|
nal results |
|
|
|
|
|
|
|
rex "From: (?<from>.*) |
|
|
|
To: (?<to>.*)” |
Figure 4-15. rex Command Example
lookup
The lookup command manually invokes field lookups from a lookup table, enabling you to add field values from an external source. For example, if you have 5-digit zip codes, you might do a lookup on the street name to apply a ZIP+4 9-digit zip code.
Table 4-16. Command Examples
|
Command |
Result |
|
… | lookup usertogroup user |
For a lookup table with fields user |
||
as local_user OUTPUT group as |
and group, specified in stanza name |
||
user_group |
|||
usertogroup in transform.conf,1 |
|||
|
|
||
|
|
look up the value of each event’s |
|
|
|
local_user field. For entries that |
|
|
|
match, the value of the lookup table’s |
|
|
|
group field is written to the event’s |
|
|
|
user_group field. |
|
|
|
|
|
|
|
||
1 |
Lookup tables can be configured through Manager » Lookups. |
||
|
|
||
53
Exploring Splunk
… | lookup dnslookup host |
Given a field lookup named dns- |
|
OUTPUT ip |
lookup, referencing a Python script |
|
|
||
|
that performs a reverse DNS lookup |
|
|
and accepts either a host name or |
|
|
IP address as arguments, match the |
|
|
host name values (host field in your |
|
|
events to the host name values in the |
|
|
table, and then add the correspond- |
|
|
ing IP address values to your events |
|
|
(in the ip field). |
|
|
|
|
… | lookup local=true user- |
For a local lookup table that is pres- |
|
ziplookup user as local_user |
ent only in the search head, look up |
|
OUTPUT zip as user_zip |
||
the value of each event’s user field. |
||
|
||
|
For entries that match, the value of |
|
|
the lookup table’s zip field is written |
|
|
to the event’s user_zip field. |
|
|
|
Figure 4-16 illustrates the first example in Table 4-16, lookup usertogroup user as local_user OUTPUT group as user_group.
usergroup lookup table |
|
|
|
|
|
||
user |
group < elds. . . > |
|
|
|
|
||
User10 |
A |
. . .. |
|
|
|
|
|
User9 |
B |
. . .. |
|
|
|
|
|
|
search results |
||||||
|
|
|
. . .. |
|
|
||
User7 |
|
|
|
local_user |
user_group |
< elds. . . > |
|
D |
. . .. |
|
|||||
|
User1 |
C |
. . .. |
||||
|
|
|
. . .. |
|
|||
|
|
|
|
User2 |
E |
. . .. |
|
|
|
|
. . .. |
|
|||
User27 |
|
|
|
User3 |
F |
. . .. |
|
G |
. . .. |
|
|||||
|
|
|
|
||||
User98 |
H |
. . .. |
|
|
|
|
|
|
|
|
|
|
|
|
|
local_user |
< elds. . . > |
|
|
|
|
|
|
|
. . .. |
|
|
|
|
|
|
|
. . .. |
|
|
|
|
|
|
. . .. |
nal results |
|
previous
search results lookup usertogroup user as local_user OUTPUT group as user_group
...|
Figure 4-16. lookup Command Example
This chapter has provided a crash course in the commands in the SPL. The next chapter describes how you can enrich your data with tags and event types and tell Splunk to watch for certain patterns and alert you about them.
54

5 Enriching Your Data
To make your data more useable, add knowledge to it. What do we mean by that? When you tell Splunk how to extract fields from your data, you can start reasoning about those fields and give Splunk the knowledge to classify your data for deeper analysis. When you save reports and dashboards, your data becomes easier to understand for you and others. And when you create alerts, Splunk proactively reveals potential issues so that you don’t have to look for them manually after the fact.
This chapter covers three areas:
•Using Splunk to Understand Data shows how to explore, categorize, and become familiar with your data.
•Displaying Data shows the basics of visualizing data.
•Creating Alerts about Potential Problems shows how to track and send alerts when metrics cross thresholds.
Using Splunk to Understand Data
When you first encounter a new source of machine data, it can look like a mess of meaningless numbers and cryptic text. The more you know about the system pumping out machine data, however, the more the data will make sense to you. But even if you know a data set well, further exploration can still bring new insights.
The first step in getting to know data is using Splunk to identify fields in the data. You can think of this like looking at all the pieces in a puzzle, first noticing their shapes. The next step is to categorize data as a preamble to aggregation and reporting. This is like sorting the puzzle pieces into border pieces and interior pieces. The more you are able to understand the data and piece the puzzle together, the clearer the picture becomes. At last, the picture is complete (displaying the data) and you can share it with others.
55

Exploring Splunk
Identifying Fields: Looking at the Pieces of the Puzzle
Splunk recognizes many common types of data, referred to as source types. If you set the right source type, Splunk can use preconfigured settings to try to identify fields.This is the case with most types of web server logs, for example.
But there are often hidden attributes embedded in machine data. For example, a product category may be part of a URL. By examining events that have certain product categories in their URLs, you can determine response times and error rates for different sections of the site or information about which products are viewed the most.
Automatic Field Discovery
When you search, Splunk automatically extracts fields by identifying common patterns in the data, such as the presence of an equal sign (=) between a key and a value. For example, if an event contains “… id=11 lname=smith … ” Splunk automatically creates id and lname fields that have the example values. And, as mentioned in Chapter 2, some fields
(such as source, sourcetype, host, _time, and linecount) are always identified.
Don’t see what you’re looking for? Start searching for it. Splunk displays only a certain number of fields in the UI by default. Hundreds more may be extracted perfectly. Searching for them brings them to the top.
The Field Discovery switch on the Fields sidebar in the UI turns this behavior on and off. You can see some selected fields (fields that Splunk selected by default or that you have selected), followed by fields that
Splunk pulled out because they appeared in multiple events. If you click
Edit, Splunk lists more fields that you can add to the group of selected fields. Clicking any field shows you the top values extracted from your search results.
For more information on automatic field extraction, see http://splunk.com/goto/ book#auto_fields.
Configuring Field Extraction
Configuring field extraction can happen in two ways. You can let Splunk automate the configuration for you by using the Interactive Field Extractor, or you can manually specify the configuration yourself.
56
Chapter 5: Enriching Your Data
The Interactive Field Extractor
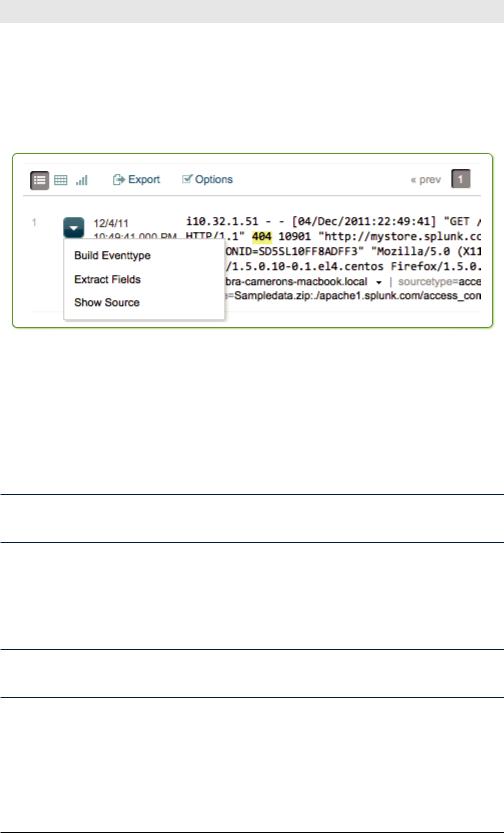
From any event in your search results, you can start the Interactive Field Extractor (IFX) by selecting Extract Fields from the Event options menu, which you reach by clicking the down arrow to the left of an event in the events list (see Figure 5-1).
Figure 5-1. Choosing Extract Fields from the Event Options menu starts the
Interactive Field Extractor
The IFX appears in another tab or window in your browser. By entering the kinds of values you seek (such as a client IP address in web logs), Splunk generates a regular expression that extracts similar values (this is especially helpful for the regular expression-challenged among us). You can test the extraction (to make sure it finds the field you’re looking for) and save it with the name of the field.
To learn more about the Interactive Field Extractor, see http://splunk.com/goto/ book#ifx.
Manually Configuring Field Extraction
From Manager » Fields » Field extractions, you can manually specify regular expressions to extract fields, which is a more flexible but advanced method for extracting fields.
To learn about manually specifying regular expressions, see http://splunk.com/ goto/book#config_fields.
Search Language Extraction
Another way to extract fields is to use search commands. The most common command for extracting data is the rex command, described in the last chapter. It takes a regular expression and extracts fields that match that expression.
57
Exploring Splunk
Sometimes the command you use depends on the kind of data from which you’re extracting fields. To extract fields from multiline tabular events (such as command-line output), use multikv, and to extract from XML and JSON data, use spath or xmlkv.
To learn about commands that extract fields, see http://splunk.com/goto/ book#search_fields.
Exploring the Data to Understand its Scope
After fields are extracted, you can start exploring the data to see what it tells you. Returning to our analogy of the puzzle, you begin by looking for patterns. What pieces help define the borders of the puzzle? How else can you categorize the pieces? By shape or color?
The Search dashboard’s Fields sidebar gives you some immediate information about each field:
•The basic data type of the field, indicated by a character to the left of the field name (“a” is text and “#” is numeric).
•The number of occurrences of the field in the events list (in parentheses following the fieldname).
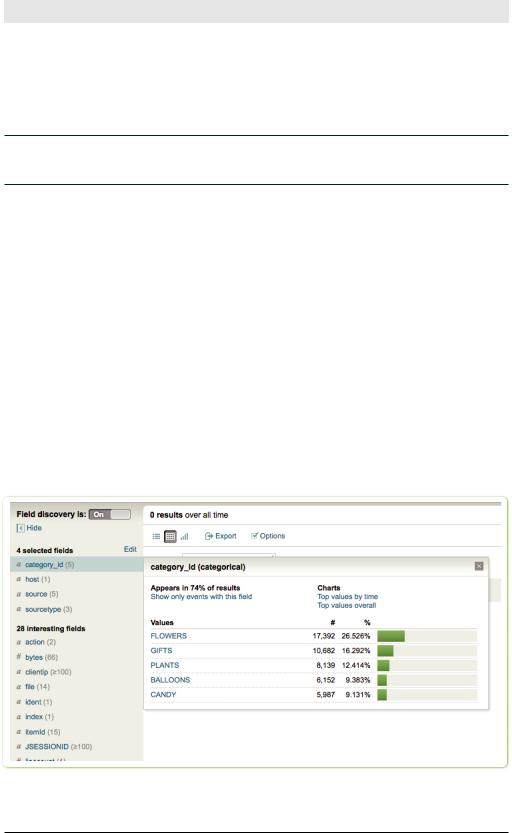
When you click a field name in the Fields sidebar, a summary of the field pops up, including top values and links to additional charts.
Figure 5-2.View a field summary by clicking on a field name in theFields sidebar.
58

Chapter 5: Enriching Your Data
You can also narrow the events list to see only events that have a value for that field.
Exploring data using top
The top command gives you the most common field values, defaulting to the top ten. You can use the top command to answer questions like these:
•What are my top 10 web pages?
sourcetype=”access*” | top uri
•Who are the top users for each host?
sourcetype=”access*” | top user by host
•What are the top 50 source and destination IP pairs?
…| top limit=50 src_ip, dest_ip
Exploring data using stats
The stats command provides a wealth of statistical information about your data.
Here are a few simple ways to use it:
•How many 503 response errors2 have I had?
sourcetype=”access*” status=503 | stats count
•What is the average kilobytes per second for each host?
sourcetype=”access*” | stats avg(kbps) by host
•How many people bought flowers yesterday? Use stats dc (distinct count) to ensure that each IP address is counted only once.
sourcetype=”access*” action=purchase category_id=flowers | stats dc(clientip)
•What is the 95th percentile of time the servers took to respond to web requests?
sourcetype=”access*” | stats perc95(spent)
Adding sparklines to the mix
As of Splunk 4.3, you can add simple line graphs, known as sparklines, to your tabular results. Sparklines let you quickly visualize a data pattern without creating a separate line chart.
For example, this search uses sparklines to show the number of events over time for each host:
* | stats sparkline count by host
2 |
A status of 503 in web server logs is a server-side error. The web server |
|
responded with a “service unavailable” message. The business meaning is that someone came to your site and didn’t get through. It’s time to look at operations if you keep seeing these errors.
59

Exploring Splunk
Figure 5-3 shows sparklines in the table.
Figure 5-3. Sparklines show patterns in the data in the Events table
Here are a few more commands that demonstrate ways to use sparklines:
•What is the number of events for each status and category combination, over time?
sourcetype=”access*” | stats sparkline count by status, category_id
•What is the average time response time for each product category, over time?
sourcetype=”access*” | stats sparkline(avg(spent)) by category_id
Using a different data set (earthquake magnitude data), see how earthquake magnitude varies by region and over 6 hour chunks of time, with the more popular regions first.3
source=eqs7day-M2.5.csv | stats sparkline(avg(Magnitude),6h) as magnitude_trend, count, avg(Magnitude) by Region | sort count
Preparing for Reporting and Aggregation
After you have identified fields and explored the data, the next step is to start understanding what’s going on. By grouping your data into categories, you can search, report, and alert on those categories.
The categories we are talking about are user-defined.You know your data, and you know what you want to get out of your data. Using Splunk, you can categorize your data as many ways as you like.
There are two primary ways that Splunk helps with categorizing data: tagging and event types.
3 |
We offer this as an example, but you can download real data and try it out by |
going to: http://earthquake.usgs.gov/earthquakes/catalogs/. |
|
60
Chapter 5: Enriching Your Data
Tagging
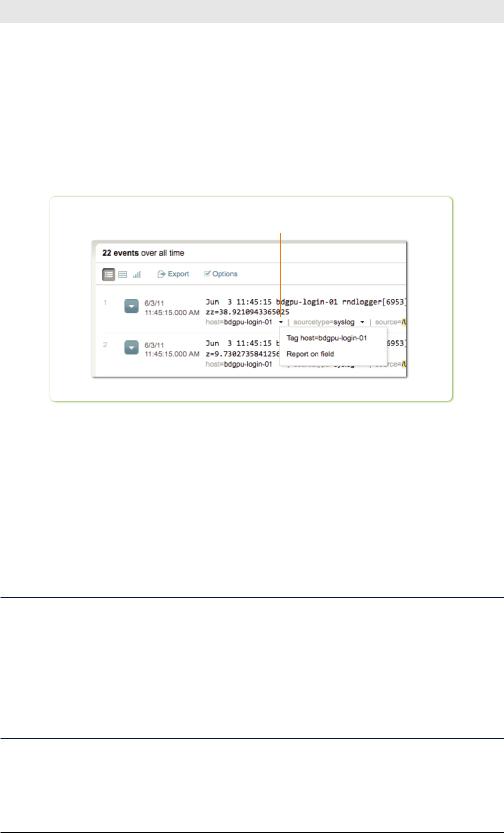
Tags are an easy way to label any field value. If the host name bdgpu-log- in-01 isn’t intuitive, give it a tag, like authentication_server, to make it more understandable. If you see an outlier value in the UI and want to be able to revisit it later and get more context, you might label it follow_up.
To tag a field value in the events list, click the down arrow beside the field value you want to tag (see Figure 5-4).
Click on the down arrow to tag the host
Figure 5-4. Tagging hosts
You can manage all your tags by going to Manager » Tags.
Let’s suppose you’ve labeled your various host values with tags such as webserver, database_server, and so on. You can then report on those custom tags to see your data the way you want instead of how it happens to be named. Again, you decide how you want to look at your data. For example, to compare how the various host types perform over time, run a search such as:
… | timechart avg(delay) by tag::host
Reporting and the Joy of Negative Searching
From the moment you start looking at data, you should be thinking about reporting. What would you like to know about the data? What are you looking for? What “noise” would you like to remove from the data so that you can easily find what you’re looking for?
This last point bears further explanation as an example of something Splunk does very well that few if any other data analysis software can: negative searching.
61