

книги / Разработка нефтяных и газовых месторождений
..pdfor gas, and pressure difference. That is why, air or inert gas (nitrogen and helium) are used for absolute permeability measuring.
Phase or effective permeability means the permeability of a porous medium for a given fluid or gas in the presence of several phases in the rock. It depends not only on physical properties of rocks but also on degree of saturation of purous space with fluidss or gases, and on their physicochemical properties.
Relative permeability of porous rock medium is ratio of the effective permeability of such porous rock medium to the absolute permeability.
As a rule, rock permeability is measured using Darcy linear law (1856), under which the fluid filtration rate in porous rock medium is proportional to the pressure gradient and inversely proportional to the dynamic viscosity:
v = (Q/F) = (K/ ) (∆p/L), |
(9) |
where v is linear filtration rate; Q is volumetric flow rate of fluid per unit of time; F is filtration area; is dynamic viscosity of fluid; ∆р is pressure difference; and L is length of porous rock medium. In the above equation the ability of rock to let fluid, gas and water go through is characterized by proportionality factor K that is termed permeability factor. At L = l m; F = 1 m2; Q = 1 m3/sec; р =1 Pa and= 1 Pa·sec, we obtain the permeability factor К=1 m2.
In the International System of Units (SI), permeability factor is measured by m2; and in the CGS (centimeter-gram-second) system [kp] in cm2; and in the NPG (petroleum field geology) [kp] in D (Darcy):
1 Darcy = 1,02 10–8 cm2 = 1,02 · 10–12 m2 = 1,02 mcm2 ≈ 1 mcm2. |
(10) |
In the International System of Units (SI), the unit of permeability 1 m2 is permeability of porous rock medium, during the filtration through the sample of which with area 1 m2, length 1 m and pressure difference 1 Pa, the flow rate of fluid with viscosity 1 Pa sec is 1 m3/sec.
The physical content of unit of measurement К (area) is that permeability characterizes the section area of porous medium channels through which filtration occurs.
8. PHASE AND REALTIVE PERMEABILITY OF ROCKS
Under the natural conditions, voids of oil and gas reservoir rocks are filled with water, gas or oil, i.e. two or three phases are present in them simultaneously. When flowing, permeability of rock for any phase is less than absolute permeability. Studies show that phase and relative permeability for various phases depends on oil, gas and water saturation of porous space of rock, physicochemical properties of fluids and porous media, and pressure gradient.
Saturation is an important characteristic of productive formations. There are water saturation (Sw), gas saturation (Sg) and oil saturation (So). Oil, gas and
11
water saturation is ratio of volume occupied in pores by relevant phase to the volume of all open pores in the rock sample. For oil reservoirs the residual water saturation ranges from 6 % to 35 %, average Sw < 25 %; oil saturation is 65–94 %. For reservoirs,
saturation parameter is standardized and equal to 1 (Ssaturation= 1), i.e. for oil reservoirs the below ratio is correct:
For gas-and-oil reservoirs
Sw + So + Sg = 1; |
Sg = 1 – (Sw + So). |
(11) |
Saturation is determined by Dyne and Stark instrument during rock extraction.
If a part of rock pores is filled with any phase, permeability of the rock for other phase becomes lower. Phase permeability mainly depends on degree of pore saturation with various phases. Nature of each multi-phase flow has been experimentally studied. The obtained data are usually presented in the form of plot of relative permeability versus degree of saturation of porous space with various phases. The analysis of them makes it possible to make important conclusions on regularities of oil, water and gas inflow. They are used in the course of pool development, reservoir engineering and solving process tasks of oil, gas and gas condensate field development for determining well production rates, forecasting reservoir performance and well drive mechanism
phase |
of unit |
Oil |
Water |
|
0,20 |
|
|||
0,18 |
|
|||
Relative oil and water |
permeability, fractions |
0,16 |
|
|
0,14 |
|
|||
0,12 |
|
|||
0,10 |
|
|||
0,08 |
|
|||
0,06 |
|
|||
0,04 |
|
|||
0,02 |
|
|||
0,00 |
|
|||
0,0 0,1 0,2 0,3 0,4 0,5 0,6 0,7 0,8 0,9 1,0 |
||||
|
|
|||
Water saturation, fractions of unit
Fig. 2. Relationship between oil and water relative permeability and carbonate rock sample porous space saturation:
Кp=0.128 fr.; Кg=0.0239 mcm2; Кrw=0.2112 fr.; Кro=0.35 fr.
Fig. 2 provides the relative phase permeability of carbonate rocks of Batyrbai field, Perm Territory. Specific points of the graph: the crossing point of curves reflects the equality of permeability for oil and permeability for water, the crossing points of curves with water saturation axis characterize the number of residual phases in pores (Кro and Кrw), and area restricted by bottom parts of curves and Sw axis describes the area of the 2-phased filtration of fluids.
However, it should be noted that due to extremely complex nature of mechanism of simultaneous filtration of several phases in porous medium, the above curves of relative permeability versus saturation are often used in calculations regardless to the
12
particular properties of rocks of the field under consideration. In doing so, it is assumed that the curves for one and the same lithological type of rocks, irrespective to their absolute permeability, are approximately equal and characterized, mainly, only by degree of saturation of rocks with various phases.
9. PERMEABILITY AND POROSITY RELATIONSHIP
There is no direct relationship between rock permeability and porosity. For instance, permeability of fractured limestone with low porosity is often high, and vice versa, clay characterized by high porosity is practically impermeable for fluid and gas as its pore space is formed by channel of subcapillary size. However, based on the average data, we can say that high permeable rocks often have high porosity factor. Relationship between permeability and pore size can be characterized by Darcy and Poiseuille laws. For ideal porous rock medium in the form of straight channel system of equal cross-section, the radius of pore channels R (mcm) can be determined by formula:
R= (8Kϕ /m)1/2. |
(12) |
Magnitude R characterizes the pore radius of ideal porous rock medium with porosity т and permeability К. For real medium, the structural factor ϕ is introduced. It characterizes the distinguishing features of the pore space structure of real reservoirs. Value of ϕ can be determined by measuring rock resistivity. For ceramic porous rock media such structural factor ϕ ranges from 1.7 up to 2.6 if porosity changes from 0.39 up to 0.28.
10. VOID CONTENT STRUCTURE
The principle property of porous rock medium – ability to store and deliver fluid and gas – depends on the void content structure. The void content structure means the geometrical dimensions (diameter and length) of voids in the form of pores, caverns, fractures and pore channels, and distribution of them in the rock volume. The pore space structure of natural reservoir rocks is very complex, and their study is associated with considerable difficulties. First of all, let us discuss the structural parameters which distinguish the real porous rock medium from the ideal one.
Tortuosity factor λ is a parameter that characterizes the difference between the average length of pore channels l and porous rock medium length L: λ=l/L >1, due to tortuosity. Flowage factor of pore channels ε characterizes decrease of flow-through pores due to presence of dead and stagnant zones, and numerically it is equal to ratio of the effective porosity to the total porosity ε = me/mp. Based on tortousity and flowage, the structural factor is determined as follows:
13
ϕ = λ2/ε ≈ 0.5035/mp1.1. Pore channel dimensions can be determined by various methods based on Laplace equation that connects the capillary pressure рc with pore radius r, surface tension σ and contact angle of wetting θ :
рк = 2σ cos θ/r. |
(13) |
Liquid pore metering is based on building-up of relationship between so termed capillary pressure curves and saturation рк = F(S), by which the integral and differential functions of pore distribution (similar to grain-size curves, fig. 1) are determined.
11. SPECIFIC SURFACE
Rock specific surface (Ssp) means the total surface of all grains in the rock volume unit. The specific surface characterizes the rock dispersion degree. The specific surface increases as dispersion becomes higher, and as grain diameter and porosity factor are diminished. Experimentally, it is very difficult to measure the specific surface of real reservoirs, as they always contain pores of various diameters. In addition, the specific surface depends on rock phase permeability and adsorption capacity. The specific surface is measured by empirical ratios using porosity (m) and permeability (kp), for instance, by Cauzeni formula:
Ssp = 7·105 (m·√m) / (√kp.). |
(14) |
If we express permeability in mcm2, the specific surface is in m2/m3.
12. ROCK CARBONATE CONTENT
Rock carbonate content means rock content of limestone – СаСО3, dolomite – СаСО3· МgСО3, soda – Na2СО3, potash – K2СО3, siderite – FeСО3 and other. The total quantity of carbonates, as a rule, relate to СаСО3, because calcium carbonate most widely occurs in rocks and constitutes the main part of the above carbonates. Pay zone rock carbonate content is determined in laboratory by core gasometry using Clarke instrument. This method is based on chemical decomposition of carbonates under the action of hydrochloric acid and change of carbon dioxide volume formed by reaction:
СаСО3 +2HCl = CO2 + CaCO3 + H2O. |
(15) |
The weight percent of rock carbonate content in terms of СаСО3 is determined based on volume of evolved CO2.
14
13. MECHANICAL PROPERTIES OF ROCKS
Under natural conditions, all rocks are in a complex stressed state which is periodically disturbed and restored due to changes in sedimentary cover, tectonic and other underground processes. Term “stressed state” means that the particular element of rock volume, for instance, the element of cubic form (see fig. 2) is impacted from all sides by external forces which tend to deform and disturb integrity (destruct) of solid body. Mechanical properties of rocks express, in whole, the ability of rocks to resist the impact of eternal forces. Numerically, the physical properties of rocks are evaluated by parameters which are qualitative unit of measurement of mechanical properties.
The mechanical properties of rocks are subdivided into three groups:
1.Elastic-capacitive properties (compressibility, tension, thrust fault, torsion and fold);
2.Deformation properties (elasticity, plasticity, brittleness and swelling); and
3.Strength properties (strength and hardness).
Under natural thermodynamical equilibrium in formation, rocks are impacted by the following types of loads: external underground pressure (σ), internal formation pressure (р) and thermal stresses caused by subsurface heat. There are normal (vertical) and lateral (horizontal) underground pressure. The vertical component of stresses depends on weight of overlying rocks with fluid, and can be calculated by formula:
σz = ρgH, |
(16) |
where ρ is rock density, kg/m3; g is gravity acceleration, m/sec2; and Н is depth of occurrence, m.
If two lateral components are equal (horizontal plane), then
σх =σy= nρgH, |
(17) |
where n is horizontal stress factor. Rock horizontal stress is less than <1 if depth of occurrence is small. At large depth of occurrence, rocks are horizontally compressed and thrust is formed. In such case, the horizontal stress can exceed vertical underground pressure.
13.1. Elastic-Capacitive Properties
Elastic properties of rocks are manifested in the rock ability to restore its original form and sizes when load, which does not exceed the rock elastic strength σ Е, is removed. If we introduce the relative longitudinal deformation of the body ε=∆l/l,
then under Hooke law of elasticity:
σ= Еε,
15
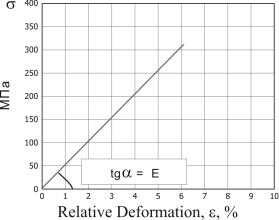
Fig. 3. Rock Load Curve
where Е is Young’s modulus of elasticity, Pa. Young’s modulus is proportionality factor between acting normal stress (tension or compression) and relative longitudinal deformation (fig. 3). The range of E for rocks is 109–1011 Pa.
Since, given that nature of deformation is associated with stress direction, the ratio of lateral (radial) deformation of reduction or enlargement (εr) to longitudinal deformation of lineation or compression (εl) under uniaxial normal stress is termed Poison's ratio ν = εr/εl. Theoretically, this ratio is ranged from 0 up to 0,5, and it is used for determining horizontal stress n and, respectively, lateral underground pressure:
n = ν/(1–ν). |
(18) |
13.2. Rock Compressibility
Compressibility factor is ratio of the relative volume change ∂V/V to the net overburden pressure change:
β = –(1/V)(∂V/∂σ). |
(19) |
Volumetric deformation of rocks can be described by 3 compressibility factors: skeleton (βsk), pore (βp) and solid phase-mineral particles of rock (βs). Calculations show that the skeleton compressibility depends on compressibility of pore volume and solid phase:
βsk = mβp + βs. |
(20) |
In practice, compressibility of formation is often used for calculations. Compressibility of formation considers the fluid elastic energy margin in the formation volume unit with porosity m under formation pressure change per unit:
β* = mβж + βс. |
(21) |
16
13.3. Deformation and Strength Properties
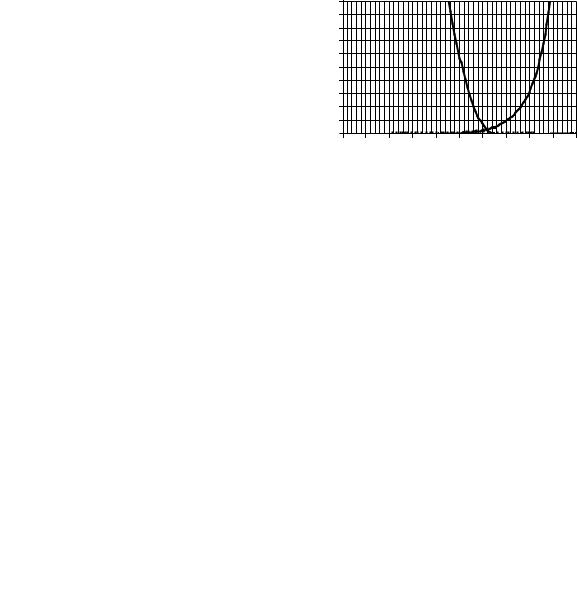
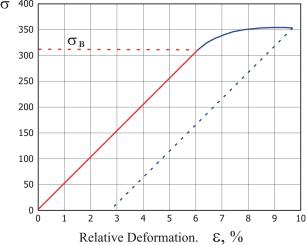
The major part of rocks obeys Hooke’s law if there is no high confining pressure under both uniaxial and complex stressed state at fast loading or unloading. As compressive stress is increased, deformation is also increased. If load is higher than elasticity strength σЕ, the load curve will be gradually deviate from linearity (fig. 4).
Relative Deformation. ε, %
Fig. 4. Rock Plastic Deformation
14. SURFACE-MOLECULAR PROPERTIES OF RESERVOIR-WATER-OIL-GAS SYSTEM
Petroleum reservoir is sedimentary rock-bedding in the form of the body with enormous accumulation of capillary channels and fractures of very large surface area. That is why the regularities of petroleum flow in reservoir and its displacement from the porous rock medium also depend on properties of boundary layers of contacting phases and processes on the oil, gas and water contact surface with rock.
Physicochemical properties of interfacial area and regularities of phase interaction are characterized by number of parameters: surface tension in the interfacial area, wettability and yield, work of adhesion and cohesion, and wetting heat.
Surface tension is associated with free energy of fluid surface layer, surface tension force and work of surface tension. By surface tension of formation fluids on various interfacial areas we can estimate the properties of contacting phase, regularities of liquid and solid body interaction, adsorption, quantitative and qualitative composition of the polar components in fluid, capillary force intensity and other.
17
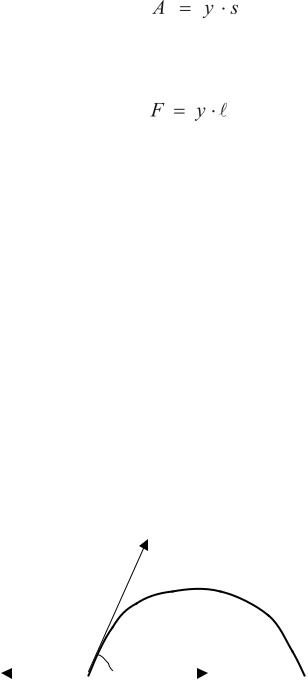
In terms of physics, surface tension σ is work А of forming a unit of new surface s under isothermal conditions:
. |
(22) |
Unit of measurement of surface tension is J/m2.
Surface tension force is a force F acting on a unit of two phase interaction perimeter length (wetting line):
, |
(23) |
where A is wetted perimeter. In this case, the unit of measurement σ is N/m. It should be noted that J/m2=N.m/m2=N/m=1000 mN/m. Thus, for mercury σ is equal to 480 mN/m; for water – 72,7 mN/m; for benzene – 28,9 mN/m; and for ester – 17,4 mN/m.
Surface tension factor σ depends on pressure, temperature, gas-oil ratio and fluid properties.
If surface tension in interfacial area of two liquids, gas and liquid can be measured, surface tension in interfacial area of rock-liquid and rock-gas is difficult to measure. That is why, the indirect methods are used for studying surface phenomena in rock-liquid interfacial area: measurement of adhesion and cohesion work, wettability and yield study, and wetting heat study.
Wetting is a complex of phenomena in interfacial area of three phases, one of which is, as a rule, a solid body and two others are either immiscible liquids or liquid and gas. Wetting rate is characterized by contact angle of wetting Θ formed by solid body surface with tangent to liquid surface from the point of contact with the surface (fig. 5).
|
|
|
σ12 |
|
Phase 2 |
|
|
|
|
θ |
Phase |
σ23 |
|
|
|
|
Phase 3 |
σ13 |
|
|
|
||
Fig. 5. Water drop form conditioned by surface tension in different interfacial areas
Contact angle of wetting Θ is changed to the direction of the more polar phase from the less polar phase (in the given case, to the direction of water). It is generally accepted to indicate water phase by 1, hydrocarbon liquid or gas by 2 and solid body by 3. Contact angle of wetting is determined by Young’s equation considering work of adhesion Wa and cohesion Wc:
18
. (24)
If the angle is 90 > Θ > 0 – acute (advancing), the surface is well wetted with water and is termed hydrophilic surface.
If the angle is 90 > Θ >180 – obtuse (receding), the surface is poorly wetted and is termed hydrophobic surface.
Silicates, carbonates and iron oxides relate to the hydrophilic surfaces. Paraffin, fats, wax and pure metals relate to the hydrophobic surfaces.
Under reservoir conditions the contact angle of wetting varies according to liquid flow rate and direction (liquid meniscus) in pore channels and fractures. It is accepted to term variation of contact angle of wetting under flowing along the solid surface of the three-phase wetting perimeter as kinetic hysteresis of wetting.
15. PHYSICS OF OIL, CONDENSATE AND GAS DISPLACEMENT
FROM POROUS ROCK MEDIUM
15.1. Reservoir Energy Sources
Fluid influx is caused by forces, which nature and value depend on kind and margin of reservoir energy. Depending on geological structure of area and deposit, oil, gas and water influx depends on:
1)edge-water drive;
2)gas cap gas drive;
3)energy of oiland water-dissolved gas and gas evolved from toil and water under drawdown;
4)elasticity of compressed rocks and fluids; and
5)gravitational energy.
Depending on the predominant energy, drive can be: water drive, gas cap drive (gas drive), dissolved gas drive, elastic or elastic water drive, gravitational drive and combination drive.
Reservoir energy margin is used for overcoming viscous friction forces during liquid and gas flowing to bottomhole, and overcoming capillary and adhesion forces.
15.2. Water Displacement of Oil (Water Drive)
Reservoirs produced by force flow (or such conditions are artificially stimulated and maintained by water or gas reinjection) are most widely occurred in nature. Oil is displaced from such reservoirs by edge or injected water, free gas from gas cap or injected gas.
19
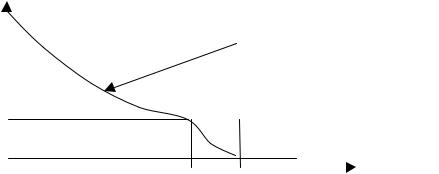
Oil and driving agent flow simultaneously in porous rock medium. But oil is never completely displaced by driving agents, as neither gas, nor water acts on oil as «pistons». Because of inhomogeneity of pore sizes, driving liquid or gas with lower viscosity inevitably are ahead of oil when displacing. And, at the same time, rock saturation with various phases, and, subsequently, effective permeability for oil and driving agents is continuously changed. Water amount in flow is increased as water saturation is increased, for instance, up to 50–50 %, due to effective permeability for water increase. And oil, strictly speaking, is not displaced but carried away from pores with jet of water. Thus, several zones, which are characterized by different water saturation, are formed along the reservoir length. The typical water saturation alteration along the reservoir length at one point of time under water displacement of oil is given in fig. 6. This process flow diagram is accepted by all scientists as overall result of capillary and hydrodynamic forces action.
Smax |
|
Conditional |
|
|
|
displacement outline |
|
|
I |
II |
|
Sф |
|
III |
|
|
|
||
Sп |
|
|
|
|
|
Distance from initial water-flood line |
|
Fig. 6. Oil-and-water saturation alteration along the reservoir length under water drive
Water saturation of reservoir is decreased from maximum value Smax, which relates to the ultimate oil recovery in the initial water injection line, to value of connate water saturation Sc. Three zones can be singled out inn the reservoir. In the first zone, in which water saturation is changed from Smax to Sf, it is smoothly lowers along the direction to the oil-saturated part of the reservoir in the conditional displacement outline. This area characterizes the zone of water-oil mixture, in which oil is gradually displaced. The second area (II zone) with high slope of curve is a transitional zone from oil displacement (I zone) to III zone of pure oil flow. It is accpt4ed to term such zone as stabilized zone. Under natural conditions its length can reach several meters.
20