

85
.pdfN. Yerezhep et al.
decommissioning following the end of the ore excavations in 2019, include four large halls designed for storage, service and maintenance of mining machinery. There are also control rooms, social areas and a restaurant. The 1400 m level is accessible from the ground level by an elevator and by a 12-km long truck-size decline. The elevator ride takes about three minutes while a car ride lasts about half-an-hour. In addition to the main level, there are additional large caverns at the depths of 990, 660 and 400 m.
Currently there are two physics experiment collecting data in the mine: the cosmic ray experiment EMMAat the depth of 75 meters and, at 1410 meters, a radiopurity setup probing the content of 14C in liquid scintillator samples coming from or intended for neutrino experiments such as Borexino [7], SNO+ [8], and JUNO [9].
Experiment with Multi-MuonArray
The EMMA array consists of 11 detector stations, as shown in Fig. 1, situated at the depth of 75 meters in the Callio Laboratory of the Pyhäsalmi
mine, Finland. The three central stations have extended tracking ability with the increased height (flight path) and with segmented, high-granularity scintillator detectors in the middle. The remaining 8 stations are called sampling stations as their tacking performance is inferior, but still sufficient to correlate with the events registered by the tracking stations. In addition to drift chambers and plastic scintillation detectors, there are plans to extend the instrumented surface of EMMA with limited streamertubes.Thegas required for the operationof thedriftchambersissuppliedfromalargeliquidgas tanks on the surface via a 90 m borehole. The array is able to measure muon multiplicity (the number of muontracks),theirlateraldistributionandthearrival direction. The shower core can be located with an accuracy better than three meters in the central area of 300 m2 registering a couple of knee-region air showers per day. The arrival direction (zenith and azimuth angles) of air showers is determined by the tracking stations with an accuracy of 1 degree. This is important as the direction relates to the effective rock thickness (for vertical muons, it is 75 m) and consequently to the muon energy cut-off.
Figure 1 – Schematic layout of the detector stations of the EMMAarray. The footprint of each station is about 15 m2. The key tracking stations: C, G, and F are at the depth of 75 meters. The stations X andYare at 45 meters.
21
Underground investigation of extensive air showers spectra at high energy range of cosmic rays ...
3.2. EMMA detection system
ThemaindetectortypesusedbyEMMAare:drift chambers [10] and plastic scintillation detectors [11]. Theformeristheprimarydetectoroftheexperimental setup providing the total active area of approximately 240 m2. The drift chambers used by EMMA have been recovered from the decommissioned DELPHI experiment [10] at CERN LEP collider. They were designed and built for muon tracking. The plastic scintillation detectors with the total coverage of approximately 24 m2 were designed as ancillary detectors for EMMA but thay can also be used in other underground measurements [12]. Funding permitting, it would be possible to further extend the coverage of EMMA with Limited Streamer Tubes [13]. This would enlarge the total instrumented area by 180 m2 (60 modules, 3 m2 each).
3.2.1. Drift camber
Thedriftchambers,referredtoasplanks,operate in the proportional mode at the anode voltage of approximately 6 kV. Instead of the original gas
mixture of Ar(85.5%):CH4(8.5%):CO2(6%) we chose to use anAr(92%):CO2(8%) mixture to avoid the use of methane gas in the mine environment even if that slightly reduces the performance.
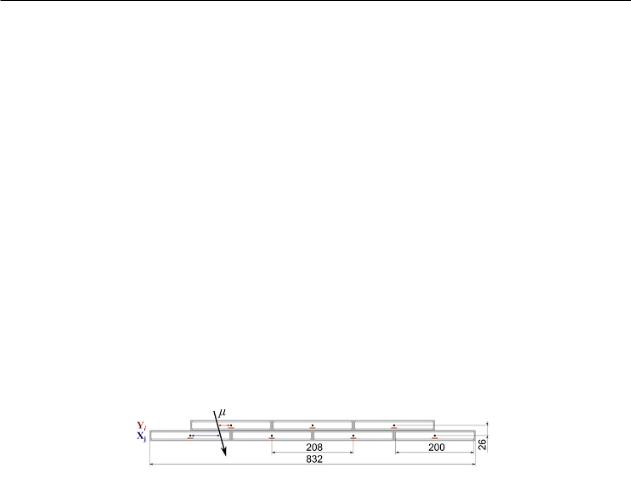
Each plank consists of seven positionsensitive drift chambers (365 × 20 cm2, 20mm thick) arranged in lengthwise half-overlapping groups of 3+4 (the area of 2.9 m2 each). The gas volume of one drift chamber is 16×200×3650 mm3 (height×width×length), or 11.68 l. The total gas volume for the seven chambers is ≈80 l. The crosssection of a plank are shown in Fig.2 [14].
The absolute position calibration in the delayline direction was performed on the surface using a 22Na source and employing cosmic muons and muon tracking. The muon detection efficiency was carried out using tracking to compare the numbers of fired chambers to those not detecting muons even if the track is passing through the given chamber. This takes into account both the geometry and the air pressure changes.
Figure 2 – Schematic cross-section of a plank. The black dot is the anode wire and the red square is the delay line (copper) used for longitudinal position determination. (For interpretation of the references to color in this figure legend, the reader is referred to the web version of this article.)
3.2.2. Plastic scintillation detectors
InadditiontothedriftchambersEMMAemploys plastic scintillation detectors. These detectors were designedforEMMAandweremanufacturedbyINR/ RAS, Moscow. The 3 cm thick plastic scintillation pixels, equipped with Silicon Photomultipliers have an area of 122×122 mm2. They are arranged into units with 16 pixels, called SC16, housed in a 1 mm thick metal shielding. The total active area of SC16 is 0.5×0.5 m2. The electronic is placed above the scintillatorsurface,asshowninFig.3.Thetotalof96 SC16 units was manufactured. Currently 72 SC16s are installed in EMMA providing 72×16=1152 individual detector channels covering the total area of 18 m2. The technical details concerning SC16 are given in [11].
The efficiency calibrations of SC16s were carried out on the surface to benefit from the larger muonflux.Thetimingstudieswereperformedusing
two overlapping sets of SC16s placed in the middle and bottom levels in the Station G. In total, the test setup consisted of 128 + 384 = 512 pixels in two layers separated by the vertical gap of 1125 mm.
3.3 CORSIKA simulations
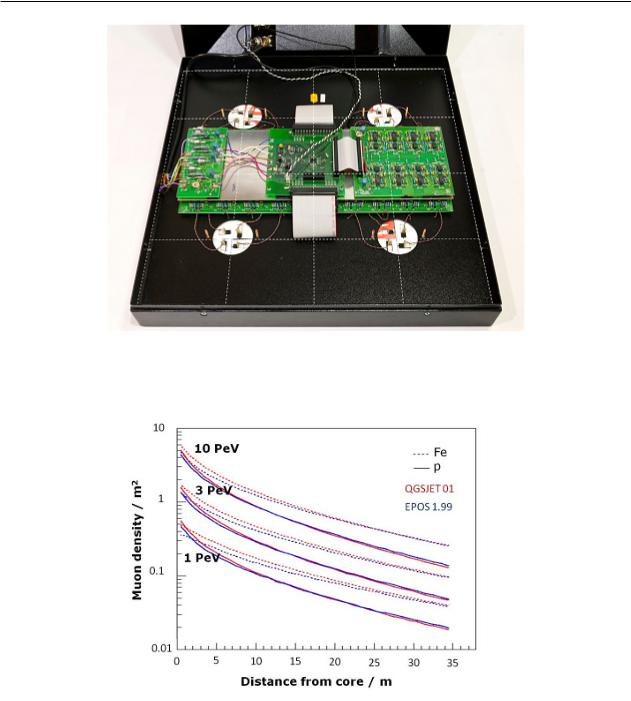
Figure 4 shows CORSIKA simulations [15] of the muon lateral density distribution for the primary CRwithenergiesof1,3and10PeVbothforprotonand for iron-initiated air showers. Energy threshold of Eµ > 50 GeV was applied reflecting the average absorption in the overburden. The figure reveals two important features relevant to EMMA: i) the primary energy translates to the muon density at the shower core and is practically independent on mass, and ii) the slope of muon density distribution differs for proton and iron-initiated showers. These two features provide the basis for the extraction of the energy and of the mass of the primary cosmic ray from the data [16].
22
N. Yerezhep et al.
Figure 3 – SC16 electronics. The dashed white lines outline the areas of 16 individual pixels. The electronics is mounted above the scintillator plane.
Figure 4 – Simulated lateral muon density distributions of high-energy muons (Eµ > 50 GeV) of protonand iron-induced air showers at 1, 3 and 10 PeV energies. CORSIKA+QGSJET 01 and CORSIKA+EPOS 1.99 models indicated by red and blue lines, respectively.
3.4 Significance of EMMA
The novel approach implemented by EMMA is to restrict the detection to the high-energy muonic component of EAS. It is achieved by locating the detector array underground at a shallow depth of about 75 meters (210 m.w.e), corresponding to the muon cutoff energy of about 45 – 50 GeV. If the
instrumentation of the constructed infrastructure is completed and the setup is operated in the full configuration for three years, EMMA would make a significant contribution towards solving of the longstanding puzzle of the presence of the knee in the energy spectrum of cosmic rays. This, in turn, may reveal further information on cosmic-ray sources
23

Underground investigation of extensive air showers spectra at high energy range of cosmic rays ...
and acceleration mechanisms. The current understanding is that the acceleration can take place up to the knee energies in supernova shock fronts that could propagate thousands of years after the explosion. However, there should be also other mechanisms since the supernova shock front mechanism does not produce energies above the knee.Addressing these questions is relevant and important as they are among the major topics in present-day astrophysics.
ThesecondimportanttaskofEMMAistoverify the alleged muon excess in EAS. This problem is extremely important because, if confirmed, it would force a substantial revision of the existing particle interaction models with serious repercussions in multiple fields of science relaying on these models. Forexample,theresultsfromPierreAugerObservatory andYakutsk EASArray indicate that there is an excess of muons in extensive air showers compared with the numbers extracted from the most realistic theoretical models. On the other hand, Ice-Top and EAS-MSU did not find such excess. If the excessive production of muons in EAS would be confirmed by a methodologically different experiment such as EMMA, it would have important implications for the current particle interaction models.
The possible origin of the discrepancy may also be the difference in the energy of detected muons. While the majority of experiments reporting muon excess detect muons with energies around 1 GeV, experiments focusing on energies around 10 GeV, like the EAS-MSU experiment, do not find the excess. The muon energy cut-off at the location of EMMAunderground arrays is even higher: 45 GeV. Because of that EMMA has an opportunity to confirm or disprove the existence of the energy dependence of the muon excess and clarify the origin of the effect itself.
C14 experiment
The beta decay of the long-lived radioactive14C is the main source of background for low-energy (E < 300 keV) neutrino measurements using highpurity liquid scintillation detectors [12]. The lowest 14C concentration has been reported by the Borexino Collaboration for Pseudocumene (PC) amounting to 2 × 10⁻¹⁸ [13]. There are three other published results for the concentration (for PXE and PC+Dodecane) with the highest being (12.6 ± 0.4) × 10−18 [17][18][19]. Such low concentrations are currently below the sensitivity of the Atomic Mass Spectrometry [20].
The preferred solvent for the new generation of large neutrino detectors is LAB (Linear alkylbenzene).LAB,justliketheotherpetrochemical products, is synthesized from the crude gas or oil extracted from old geological deposits where the remanences of the cosmogenic14C are expected to be very low. Therefore, if contamination during processing, transportation and storage can be avoided, it should be possible to manufacture LAB with a low concentration of the radiocarbon [21]. We intended to make systematic analysis of the samples of different origin and composition with the aim of finding concentrations smaller than 1018 for use, for instance, by the SNO+ [8] and the JUNO Collaboration [9].
Future plans and possibilities
5.1 Giant liquid-based neutrino detectors
As mentioned before, the Pyhäsalmi mine has ideal conditions to host underground experiments of the next generation [22]. In fact, Pyhäsalmi was already selected as the prime site for the far detector of the LAGUNA-LBNO project and the feasibility for the construction in Finland of giant caverns, capable of containing 50 kiloton-size detectors in a single cave has been documented [23]. The plan was to produce a high-energy neutrino beam at CERN and send it over the distance of 2288 km to Finland[24].However,followingthenewEuropean strategy on particle physics, Fermilab took over from CERN accelerator-based neutrino physics and the LAGUNA-LBNO was replaced by the DUNE experiment [25].
The second of the LAGUNA detectors that has chosen the Pyhäsalmi mine as its preferred location is LENA (Low Energy Neutrino Astronomy) – a multi-purpose neutrino observatory employing 50 kilotons of liquid scintillator [26]. Unfortunately, LENA Collaboration failed to obtain support from the funding agencies. Instead, the majority of the neutrino scientists involved with the liquid scintillator technology have joined the Jiangmen Underground Neutrino Observatory (JUNO) – a medium-baseline reactor neutrino experiment, currently under construction in South China [7]. Nevertheless, it is conceivable that, in a few years, LENA or a similar project will be reconsidered because JUNO, located at a relatively shallow depth of 600 meters and at the distance of only 53 km from10high-powernuclearreactors,won’thavethe desired sensitivity to address the astroparticle goals of LENA.
24

N.Yerezhep et al.
5.2.Acoustic detection of neutrinos in the rock even proposed before. It is expected that since the
As a legacy of the extended site investigation for LAGUNA-LBNO and decades of mining and exploration activities, there is a network of boreholes surrounding the ore body. These boreholes have a very well documented geological profileandarenowavailableforscientificresearch. Theareacoversthevolumeofabout1km3 reaching from the depth of around 1300 m down to 2500 m. The total length of the new boreholes is 3.5 km. It has been proposed [27] to deposit strings of microphones into the boreholes in a similar fashion it has been done or is going to be done by theANTARES/AMADEUS [28] and the KM3NeT collaborationsforthepurposeofacousticdetection of particleshowers following interactions of ultrahigh energy neutrinos. Performing this type of measurements in the rock has never been tried or
density of the rock is three-times larger and the speed of sound is four-times larger, the amplitude of the generated bipolar pressure pulse in rock following the interaction with an ultra-high energy neutrino should be by an orderof magnitude larger than in water. In addition, a higher density of rock alsoguaranteeshigherinteractionrateforneutrinos while a longer attenuation length in rockreduces signal dissipation.
Acknowledgments
ThisworkispartiallysupportedbyMESRKPTF “Fundamental and applied research in related fields of physics of terrestrial, near-earth and atmospheric processes and their practical application” (IRN: BR05236494)
References
1 Kampert K.H., Mostafa M.A., Zas E. et al. Multi-Messenger Physics With the Pierre Auger Observatory //Front. Astron. Space Sci. – 2019. – Vol. 6, No. 24. – P.6.
2Apel W. D. et al. KASCADE-Grande Collaboration //Astroparticle Physics. – 2013. – Vol.47. – P.54.
3 ZhaoY.,Yuan Q., Bi X.J., Zhu F.R. and Jia H.Y. Perspective of detecting very high energy gamma-ray emission from active galactic nuclei with Large High Altitude Air Shower Observatory (LHAASO) // Intern. J. Of Modern Physics D. – 2016. – Vol.25, Iss. 1. – No. 1650006.
4 Kalliokoski T., Bezrukov L., Enqvist T., Fynbo H., and VirkajärviA.Advantages of locating LAGUNAin Pyhasalmi mine //Progress in Particle and Nuclear Physics – 2011. – Vol. 66, – Iss. 2. – P. 468–472.
5Trzaska W.H. et al., Advantages of locating LAGUNA in Pyhäsalmi mine //Prog. Part. Nucl. Phys. – 2011. – Vol. 66. – P. 463–467.
6Trzaska W.H., Site selection for the new generation of giant neutrino detectors //J. Phys. Conf. Ser. – 2012. – Vol. 375. – P. 042060.
7 Alimonti G. et al. Measurement of the C-14 abundance in a low-background liquid scintillator //Phys. Lett., B. – 1998. – Vol. 422. – P. 349–358.
8 Chen Mark C. The SNO+ Experiment. In Proceedings, 34th International Conference on High Energy Physics (ICHEP 2008): Philadelphia, Pennsylvania, July 30-August 5, 2008.
9An F. et al. Neutrino Physics with JUNO //J. Phys. G. – 2016. – Vol. 43(3). – No. 030401.
10P. Aarnio and The DELPHI Collaboration, The DELPHI detector at LEP //Nucl. Inst. Meth.in Phys.Res.A. – 1991. – Vol. 303. – P. 233-276.
11Akhrameev E.V., et al., Multi-pixel Geiger-mode avalanche photodiode and wavelength-shifting fibre-optics readout of plastic scintillator counters for the EMMAunderground experiment //Nucl.Inst. Meth.in Phys.Res.A. – 2009. – Vol. 610, – Iss. 1. – P. 419-422.
12Bandac, et al., Calculation of total muon flux observed by Muon Monitor experiment //J. Phys.Conf.Ser. – 2017. –Vol. 934.
– No. 012019.
13Antoni T., et al. A large area limited streamer tube detector for the air shower experiment KASCADE-Grande //Nucl.Inst. Meth.in Phys.Res.A. – 2004. – Vol. 533. – P. 387-403.
14Kuusiniemi P., Bezrukov L., Dzaparova I., Enqvisand T., Yanin A. Possibilities for Underground Physics in the Pyhäsalmi mine //Astroparticle Physics. – 2018. – Vol. 102, – P. 67-76.
15Heck D., Capdevielle J.N., Schatz G. and Throuw T., Corsika: A Monte Carlo Code to Simulate Extensive Air Showers // Report FZKA6019. – 1998.
16Kuusiniemi P., Bezrukov L., Enqvist T.and Trzaska W.H., Underground cosmic-ray experiment EMMA //J. Phys.: Conf. Ser. – 2013. – Vol. 409. – No. 012067.
17BackH.O.etal.Studyofphenylxylylethane(PXE)asscintillatorforlowenergyneutrinoexperiments//Nucl.Instrum.Meth. A. – 2008. – Vol.585. – P.48–60.
18Keefer G. Laboratory Studies of Lead Removal from Liquid Scintillator in Preparation for KamLAND’s Low Background Phase //AIPConf. Proc. –2011. – Vol. 1338. – P. 175–178.
25

Underground investigation of extensive air showers spectra at high energy range of cosmic rays ...
19Buck C. et al. Measuring the (14)C isotope concentration in a liquid organicscintillator at a small-volume setup //Instrum. Exp. Tech. – 2012. – Vol. 55. – P. 34–37.
20Accelerator mass spectrometry (AMS) dating. https://www.radiocarbon.com/accelerator-mass-spectrometry.htm.
21Bonvicini G. et al. The chemical history of 14C in deep oilfields // https://cds.cern.ch/record/636433/files/0308025.pdf. – 2003. –16 p.
22Trzaska W.H. et al., Advantages of locating LAGUNA in Pyhäsalmi mine //Prog. Part. Nucl. Phys. – 2011. – Vol.66. – P.463–467.
23TrzaskaW.H. Site selection for the new generation of giant neutrino detectors //J. Phys. Conf. Ser. – 2012. –Vol. 375. – No.
042060.
24Galymov V..The LAGUNA-LBNO neutrino observatory in Europe //Nucl. Part. Phys. Proc. – 2016. – Vol. 273-275. – P.1854–1860.
25http://www.dunescience.org/
26Wurm M. et al. The next-generation liquid-scintillator neutrino observatory LENA //Astropart. Phys. – 2012. – Vol. 35. – P. 685–732.
27Trzaska W.H. et al.Acoustic detection of neutrinos in bedrock // EPJ Web Conf. – 2019. –Vol. 216, No 04009. – P. 6.
28Aguilar J.A. et al.AMADEUS – TheAcoustic Neutrino Detection Test Systemof theANTARES Deep-Sea Neutrino Telescope //Nucl.Instrum.Meth.A. – 2011. – Vol. 626-627. – P.128–143.
References
1 K.H. Kampert et al. Front.Astron. Space Sci., 6 (24) (2019).
2W.D.Apel et al.Astroparticle Physics, 47, 54 (2013).
3 Y. Zhao et al. Intern. J. Of Modern Physics D, 25 (1), 1650006 (2016). 4 T. Kalliokoski et al. Prog. Part. Nucl. Phys., 66, 468–472 (2011).
5 W.H. Trzaska et al., Prog. Part. Nucl. Phys., 66, 463–467, (2011). 6 W.H. Trzaska et al., J. Phys. Conf. Ser., 375, 042060 (2012).
7G.Alimonti et al., Phys. Lett., B422, 349–358 (1998).
8 C. Che. Mark et al., 34th Intern. Conf. on High Energy Physics (ICHEP2008), Philadelphia, Pennsylvania, July 30-August 5 (2008).
9An. Fengpeng et al., J. Phys., G43 (3), 030401 (2016).
10P.Aarnio and the DELPHICollaboration, Nucl.Inst. Meth.in Phys.Res.A303, 233 (1991).
11E.V.Akhrameev et al., Nucl. Inst. Meth. in Phys.Res.A610, 419 (2009).
12Bandac et al., J. Phys.Conf.Ser. 934, 012019 (2017).
13T.Antoni etal., Nucl.Inst. Meth.in Phys.Res.A533, 387 (2004).
14P. Kuusiniemi et al.,Astroparticle Physics, 102, 67–76 (2018).
15D. Heck et al., Report FZKA, 6019 (1998).
16P. Kuusiniemi et al., J. Phys. Conf. Ser., 409, 012067 (2013).
17H.O. Back et al., Nucl. Instrum. Meth.,A585, 48–60 (2008).
18G. Keefer.,AIPConf. Proc., 1338, 175–178 (2011).
19C. Buck et al., Instrum. Exp. Tech., 55, 34–37 (2012).
20Accelerator mass spectrometry (AMS) dating. https://www.radiocarbon.com/accelerator-mass-spectrometry.htm.
21G. Bonvicini et al., https://arxiv.org/abs/hep-ex/0308025v2 (2003).
22W.H. Trzaska et al., Prog. Part. Nucl. Phys., 66, 463–467 (2011).
23W.H. Trzaska et al., J. Phys. Conf. Ser., 375, 042060 (2012).
24Vyacheslav Galymov et al., Nucl. Part. Phys. Proc., 273-275, 1854–1860 (2016).
25Dune. http://www.dunescience.org/.Accessed: 2018-09-30.
26M. Wurm et al.,Astropart. Phys., 35, 685–732 (2012).
27W.H. Trzaska et al., EPJ Web Conf., 216, 04009 (2019).
28J.A.Aguilar et al., Nucl. Instrum.Meth.,A626-627, 128–143 (2011).
26

ISSN1563-0315,еISSN2663-2276 |
RecentContributionstoPhysics.№1(72).2020 |
https://bph.kaznu.kz |
МРНТИ 41.27.25; 41.25.15 |
https://doi.org/10.26577/RCPh.2020.v72.i1.04 |
|
А.Т. Майлыбаев1 , В.А.Захожай 2, Н.Ш. Алимгазинова1
 , А.М. Демесинова1
 , А.Ж. Сагынтаева1
 , А.Б. Манапбаева1
 , А.К. Куратова1
 , А.Ж. Наурзбаева1
 , М.Т. Кызгарина1*
1Казахский национальный университет имени аль-Фараби,
Казахстан, г. Алматы, *е-mail: meir83physics@gmail.com
2Харьковский национальный университет имени В.Н. Каразина, Украина, г.Харьков
ОПИСАНИЕ СЦЕНАРИЯ РАЗВИТИЯ ПРОТОГАЛАКТИК С МАЛЫМИ УГЛОВЫМИ МОМЕНТАМИ
ЧЕРЕЗ КАСКАДНУЮ ФРАГМЕНТАЦИЮ С ОБРАЗОВАНИЕМ ПРОТОСКОПЛЕНИЙ И ПРОТОЗВЕЗД НА ОСНОВЕ ТЕОРИИ ГРАФОВ
В статье рассмотрен процесс развития протогалактик в период охлаждающейся Вселенной, когда их массы равны джинсовским значениям. В результате дальнейшего охлаждения протосистемы подвержены механизму каскадной фрагментации с образованием все новых и новых, меньших по массе фрагментов. Первичные фрагменты – будущие галактики (верхний предел массы фрагментов попадает в интервал масс галактик), во вторичной волне фрагментации образуются прародители будущих звездных скоплений, звезд и субзвезд. На основе общего представления об эволюции звездных систем построен ориентированный граф, описывающий каскадную фрагментацию в протосистемах с чрезвычайно малым угловым моментом. Для протосистем, определяемых степенными спектрами масс, проведены оценки эффективности звездообразования, вычислены вероятности ключевых событий. Рассчитаны долевые содержания вещества, уходящего на формирование нового поколения звезд и субзвезд, в зависимости от μ-го цикла звездообразования (при полном его числе N). Представлена в графическом виде зависимость массовой доли, передаваемой из протосистемы в систему, как функция ряда N фрагментаций. Получены четыре варианта развития эволюции таких звездных систем, как галактики, которые на первом и втором этапах эволюции описываются спектрами масс с разными показателями степени. Показано, что в зависимости от эволюционного сценария, определяемого комбинацией спектров масс на первом и втором этапах эволюции, галактики на конечном этапе эволюции могут иметь различный состав населений. По одному из сценариев галактики должны содержать звездный состав, ограниченный массами карликовых звезд (≤ 0.8 М ). Для рассчитанного максимального значения Nmax ≈ 70 и времени одного цикла фрагментации, который реализуется при одноактном звездообразовании в звездных скоплениях галактик - ~ 107 лет, ожидается, что время полного истощения газа в таких звездных системах, как эллиптические галактики, составит ~ 7•109 лет. Учитывая, что характерное время начала формирования галактик составляет ≈ 12•109 лет, полученный результат удовлетворительно объясняет факт отсутствия звездообразования в эллиптических галактиках за последние 5 миллиардов лет. Дальнейшее развитие исследований в данном направлении может позволить понять причины различий в составах населений различных типов галактик.
Ключевые слова: статистическая космогония, граф, протоскопления, протогалактика, звездные системы, звездообразование, субзвезды, спектр масс, каскадная фрагментация.
A.T. Mailybaev1, V.A. Zakhozhay2, N.Sh. Alimgazinova1, A.M. Demesinova1,
U.Zh. Sagyntayeva1, A.B. Manapbayeva1, A.K. Kuratova1, A.Zh. Naurzbaeva1, M.T. Kyzgarina1*
1Al-Farabi Kazakh national university, Kazakhstan, Almaty, *е-mail: meir83physics@gmail.com 2Kharkov national university named after V.N. Karazina, Ukraine, Kharkov
Description of the scenario for the development of proto galaxies with small angular momentum through cascade fragmentation
with the formation of proto clusters and proto stars based on graph theory
The process of proto galaxies development is considered in the period of Universe cooling, when their masses are equal to the Jeans values. As a result of further cooling, the proto systems are subjected to the cascade fragmentation mechanism under which the more and more new smaller
© 2020 Al-Farabi Kazakh National University |
27 |

Описание сценария развития протогалактик с малыми угловыми моментами через каскадную фрагментацию ...
fragments are formed. Primary fragments are future galaxies (the upper limit of the mass of fragments falls within the mass range of galaxies), the ancestors of future star clusters, stars and sub stars form in the secondary fragmentation wave. In order to describe cascade fragmentation in proto systems with an extremely small angular momentum, a directed graph is constructed based on a general idea about the evolution of stellar systems. Star formation efficiency evaluations are carried out for proto systems, which determined by power-law mass spectra and the probabilities of key events are calculated. The fractional contents of the substance leaving for the formation of a new generation of stars and sub stars are calculated, depending on the μ-th star formation cycle (for its total number N). The dependence of the mass fraction transferred from the proto system to the system is presented in graphical form as a function of the fragments number N. Four options of the evolution of stellar systems such as galaxies are obtained, which are described by mass spectra with different exponents at the first and second stages of evolution. It is shown that, depending on the evolutionary scenario determined by the combination of mass spectra at the first and second stages of evolution, galaxies at the final stage of evolution may have different populations. According to one of the scenarios, galaxies should contain stellar composition limited by the masses of dwarf stars (≤ 0.8 M ). For the calculated maximum value Nmax ≈ 70 and the time of one fragmentation cycle, which occurs during one-star star formation in stellar clusters of galaxies ~ 107 years, it is expected that the time of complete gas depletion in stellar systems such as elliptical galaxies will be ~ 7•109 years. Considering that the characteristic time for the beginning of the formation of galaxies is ≈ 12•109 years, the obtained result explains satisfactorily the absence of star formation in elliptical galaxies over the past 5 billion years. Further development of research in this direction shows that it possible to understand the causes of differences in the composition of populations of various types of galaxies.
Key words: statistical cosmogony, graph, proto systems, proto galaxy, stellar systems, star formation, sub stars mass spectrum, cascade fragmentation.
А.Т. Майлыбаев1, В.А. Захожай2, Н.Ш. Алимгазинова1, А.М. Демесинова1, А.Ж. Сағынтаева1, А.Б. Манапбаева1, А.К. Куратова1, А.Ж. Наурзбаева1, М.Т. Қызғарина1*
1Әл-Фараби атындағы Қазақ ұлттық университеті, Қазақстан, Алматы қ., *е-mail: meir83physics@gmail.com 2 В.Н. Каразин атындағы Харьков ұлттық университеті, Украина, Харьков қ.
Бұрыштық моменттері аз протогалактикалардың даму көрінісін протошоғырлар мен протожұлдыздар қалыптасатын
каскадты фрагментация арқылы графикалық теория негізінде сипаттау
Ғаламның салқындау кезеңінде, яғни олардың массалары Джинс мәндеріне тең болған кездегі протогалактикалардың даму процесі қарастырылды. Әрі қарай салқындату нәтижесінде протосистемалар каскадтық фрагментация механизміне бағынады: барған сайын жаңа ұсақ фрагменттер пайда болады. Алғашқы фрагменттер – болашақ галактикалар (фрагменттер массасының жоғарғы шегі галактикалардың интервалына енеді), ал екінші фрагментация толқынында болашақ жұлдыз шоғырлары, жұлдыздар және субжұлдыздар пайда болады. Жұлдыздық жүйелер эволюциясы туралы жалпы идеяға сүйене отырып, бұрыштық моменті өте аз прото жүйелерде каскадтық фрагментацияны сипаттайтын бағытталған график салынды. Дәрежелік масс-спектрлермен анықталған протожүйелер үшін жұлдыз түзілу тиімділігі бағаланды, маңызды оқиғалардың ықтималдығы есептелді. Жұлдыздар мен субжұлдыздардың жаңа ұрпағын қалыптастыруға кететін заттың бөлшек құрамы μ-ші жұлдыз түзілу циклына (оның жалпы саны N) байланысты есептелді. Протожүйеден жүйеге берілген массалық үлестің тәуелділігі бірқатар N фрагменттер қатарының функциясы ретінде графикалық түрде көрсетілген. Галактикадағы сияқты жұлдыздық жүйелер эволюциясы дамуының төрт нұсқасы алынды, эволюцияның бірінші және екінші сатыларында олар әртүрлі дәрежелік көрсеткіштері бар масс-спектр- лермен сипатталды. Эволюцияның бірінші және екінші сатыларында масса спектрлерінің бірігуімен анықталатын эволюциялық көрініске байланысты, эволюцияның соңғы сатысында галактикалар әртүрлі популяциялық құрамға ие болуы мүмкін екені көрсетілді. Көріністердің біріне сәйкес, галактикалар құрамында ергежейлі жұлдыздардың массаларымен шектелетін жұлдызды құрам болуы керек (≤ 0,8 М ). Есептелген Nmax ≈ 70 максималды мәні үшін және галактикалардың жұлдызшоғырларында бірсатылы жұлдызтүзілу кезінде ~ 107 жыл болатын бір фрагменттік циклдің уақыты үшін, эллипстік галактикалар сияқты жұлдыздық жүйелердегі газдың толық таусылу уақыты ~ 7•109 жыл болады деп күтілуде. Галактика қалыптасуының басталу кезеңі ≈ 12•109 жыл екенін ескерсек, алынған нәтиже соңғы 5 миллиард жыл ішінде эллипстік галактикалардағы жұлдызтүзілу болмауын қанағаттандырарлық түрде түсіндіреді. Осы бағыттағы зерттеулердің одан әрі дамуы әртүрлі типтегі галактикалардың популяциялық құрамындағы айырмашылықтардың себептерін түсінуге мүмкіндік береді.
Түйін сөздер: статистикалық космогония, граф, протошоғырлар, протогалактика, жұлдыздық жүйелер, жұлдызтүзілу, субжұлдыздар масс-спектрі, каскадты фрагментация.
28

А.Т. Майлыбаев и др.
Введение
Звездные системы – это гравитационно-свя- занные группы звезд, имеющие общее происхождение и развитие. К ним, в зависимости от числа компонентов, относят кратные звезды, звездные скопления и ассоциации, галактики.
В исследовании звездных систем актуальными задачами являются изучение их динамического развития, химической эволюции, истории звездообразования, изменения фотометрических свойств. Проведение такого комплекса исследований позволяет представить общий сценарий развития звездных систем: от их зарождения до эволюции на основных стадиях. Несомненно, наиболее близкой нам с точки зрения ее важности и наиболее интересной для исследования звездной системой является Галактика, поскольку именно она является местом «проживания» солнечной системы. Галактика представляет собой сложную многоуровневую систему, которая включает в себя в виде составных элементов множество различных форм видимого и невидимого вещества. Это звезды, вносящие наибольший вклад в видимое вещество, субзвезды, планеты, диффузное межзвездное вещество разнообразного типа как видимого так и невидимого (плазма, атомы, молекулы, вещество в виде пыли), кванты электромагнитного излучения от сверхдлинных радиоволн до высокоэнергичных гамма-квантов, релятивистские частицы сверхвысоких энергий, а также гипотетические, пока неизвестные науке, невидимые доступными средствами наблюдений формы вещества, называемые поэтому темным веществом [1, 2, 3-5].
Зарождение в массивных молекулярных облаках протоскоплений с последующим их развитием в звездные скопления и ассоциации – является основным элементом общего сценария развития звездообразования. В зависимости от числа образовавшихся компонентов такие системы живут разное время, из-за диссипации компонентов. Этот процесс является определяющим в пополнении и формировании звезд и субзвезд поля звездных систем более высокого порядка – галактик. Исследования таких многокомпонтных систем требуют применения к ним специальных разделов математики, поскольку требуется обобщение происходящих процессов и их последствий методами математической статистики. В таких сложных
системах наряду с проявлениями перечисленных эволюционных изменений происходит изменение и их статистических свойств. Ранее в качестве возможного метода описания изменения статистических свойств звездных систем с изменением их возраста впервые было предложено применение элементов дискретной математики – теории графов. Такое направление получило название – статистическая космогония [6,7].
В статистической космогонии конечной задачей является построение эволюционной модели звездной системы, в которой предсказываются все долевые содержания её составляющих. В процессе решения этой задачи возникает необходимость аналитического представления спектров масс звезд, которые они имеют на стадиях развития звезд главной последовательности, гигантов и звездных остатков, в зависимости от начального спектра масс протозвезд [8,9]. Для получения спектра масс протозвезд необходимо рассмотреть те физические условия, которые сложились в межзвездных молекулярных облаках на момент их фрагментации.
При разработке и построении моделей звездных систем определяющее место занимают вычисления вероятностей ключевых событий, происходящих в звездных системах в процессе их эволюции. Ключевыми событиями являются такие события, которые играют первостепенную, определяющую роль в эволюции звездных систем [10]. Для этого необходимо записать аналитические выражения для всех спектров масс, которые фигурируют в таком эволюционном процессе. Целью данной работы и является решение частной задачи: получить алгоритм расчета статистического процесса, описывающего двухактовую фрагментацию протосистемы: сначала на протоскопления с последующей фрагментацией на протозвезды, все составляющие которых имеют малый угловой момент. Для достижения этой цели использовались графы.
1. Описание эволюционного процесса в Галактике с использованием графов
Определение долевых содержаний по массе компонент Галактики, находящихся на различных стадиях эволюции, – звезд, субзвезд, газа, участвующего в эволюционном «круговороте» в Галактике, звездно-субзвездных систем
29

Описание сценария развития протогалактик с малыми угловыми моментами через каскадную фрагментацию ...
различного возраста и принадлежащих различным подсистемам Галактики, удобно проводить с использованием аппарата теории графов [11,12].
Согласно классической схеме эволюции поколениям звезд и субзвезд, возраст которых совпадает с возрастом звездной фазы Галактики, предшествовала протогалактическая газовая туманность с долей реликтового газа – G11 = 1. Образование звезд Галактики, согласно современным представлениям, объясняется каскадной фрагментацией реликтовой газовой туманности на все более мелкие фрагменты, вплоть до минимальных масс порядка масс звезд. На ранних стадиях эволюции Галактики образуются фрагменты с джинсовской массой порядка массы современных крупных шаровых скоплений. Самые большие скопления звезд участвуют в формировании галактического ядра, - они «падают» в центр Галактики из-за эффектов динамического звездного трения.
Эволюцию Галактики представляем, как и в [12], в виде несвязного графа (рис. 1), состоящего из отдельных ориентированных графов (рис. 2). Узлы графов отражают ключевые события в истории Галактики с
вероятностью x . Естественно положить, что они образуют конечное множество вероятностей
x Х ключевых событий, определяющих эволюцию Галактики:
a11i доля массы вещества, оставшаяся в
межзвездной среде после образования скоплений звезд (i = 0) и ушедшая на образование последних (i = 1), соответственно;
vrsj доля массы скоплений, устремившая-
ся к центру Галактики (из-за динамического звездного трения), j = 1, и сохранившаяся в скоплениях звезд (j = 2) до конца r -фазы звездообразования Галактики;
grsk11 доля массы вещества, оставшаяся
после образования звезд и субзвезд в ядре, поле и скоплениях Галактики (k = 1 4);
grsk21 , grsk31 доли массы вещества, ушедшие
на образование субзвезд и звезд, соответственно (смысл k аналогичен предыдущей записи);
– доля массы вещества, принадлежащая ядру (k = 1), полю (k = 2, 3) и скоплениям (k = 4) Галактики;
hk |
доля вещества, содержащаяся в звез- |
|||
rsi |
|
|
|
|
дах главной |
последовательности |
( = 1), |
||
гигантах |
( = 2), звездных |
остатках |
( = 3) |
|
нулевого возраста ( e = 0); |
|
|
||
pk |
доля |
вещества, |
содержащаяся в |
|
rsi |
|
|
|
|
объектах, аналогично hk через время |
e =t; |
|||
|
|
rsi |
|
|
wrsik доля вещества, теряемая объектами
за счет звездного ветра ( = 1, 2) и сверхветра +
потери оболочек - = 3.
Индекс i в вероятностях g, h, p, w означает их принадлежность к i-му ярусу. Вероятности множества X размещены в узлах ориентированного графа G11(X,U) (так, чтобы на каждом уровне выполнялось равенство
xi 1, xi X ), описывающего последова-
i
тельность детерминированных событий, происходивших в Галактике, которые определяются из цепей, состоящих из дуг, входящих в множество U.
На рис. 1 показан граф Grs(X, U), где frsk –
вершины подграфов, описывающих каскадную фрагментацию ядра (k = 1), поля (k = 2, 3) и скоплений (k = 4) Галактики, подграфы которых изображены на рис. 2, где число ярусов, в общем случае, зависит от значения k. К концу первого цикла звездообразования газовая составляющая Галактики состояла из оставшегося газа после первого звездообразования (G21) и газа, образовавшегося в результате переработки вещества в недрах звезд первого
поколения (G22).
Второй, третий и каждый последующий цикл звездообразования можно представить аналогично первому. Только описывается этот процесс не одним, а двумя – G21(X,U) и G22(X,U), тремя – G31(X,U), G32(X,U), G33(X,U)
или несвязными ориентированными графами с вершинами в первом ярусе G21 и G22 для второго цикла, G31, G32, G33 для третьего цикла и Gn1, Gn2, Gn3, … , Gnn для каждого последующего n-го цикла.
30