

Rapid miner lab / DataMiningForTheMasses
.pdfChapter 8: Linear Regression
3)Import both of your data sets into your RapidMiner repository. Be sure to give them descriptive names. Drag and drop them into a new process, and rename them as Training and Scoring so that you can tell them apart.
4)Use a Set Role operator to designate the Salary attribute as the label for the training data.
5)Add a linear regression operator and apply your model to your scoring data set.
6)Run your model. In results perspective, examine your attribute coefficients and the predictions for the athletes’ salaries in your scoring data set.
7)Report your results:
a.Which attributes have the greatest weight?
b.Were any attributes dropped from the data set as non-predictors? If so, which ones and why do you think they weren’t effective predictors?
c.Look up a few of the salaries for some of your scoring data athletes and compare their actual salary to the predicted salary. Is it very close? Why or why not, do you think?
d.What other attributes do you think would help your model better predict professional athletes’ salaries?
139

Chapter 9: Logistic Regression
CHAPTER NINE:
LOGISTIC REGRESSION
 CONTEXT AND PERSPECTIVE
Remember Sonia, the health insurance program director from Chapter 6? Well, she’s back for more help too! Her k-means clustering project was so helpful in finding groups of folks who could benefit from her programs, that she wants to do more. This time around, she is concerned with helping those who have suffered heart attacks. She wants to help them improve lifestyle choices, including management of weight and stress, in order to improve their chances of not suffering a second heart attack. Sonia is wondering if, with the right training data, we can predict the chances of her company’s policy holders suffering second heart attacks. She feels like she could really help some of her policy holders who have suffered heart attacks by offering weight, cholesterol and stress management classes or support groups. By lowering these key heart attack risk factors, her employer’s clients will live healthier lives, and her employer’s risk at having to pay costs associated with treatment of second heart attacks will also go down. Sonia thinks she might even be able to educate the insured individuals about ways to save money in other aspects of their lives, such as their life insurance premiums, by being able to demonstrate that they are now a lower risk policy holder.
 LEARNING OBJECTIVES
After completing the reading and exercises in this chapter, you should be able to:
Explain what logistic regression is, how it is used and the benefits of using it.
Recognize the necessary format for data in order to perform predictive logistic regression.
Develop a logistic regression data mining model in RapidMiner using a training data set.
Interpret the model’s outputs and apply them to a scoring data set in order to deploy the model.
141

Data Mining for the Masses
 ORGANIZATIONAL UNDERSTANDING
Sonia’s desire is to expand her data mining activities to determine what kinds of programs she should develop to help victims of heart attacks avoid suffering a recurrence. She knows that several risk factors such as weight, high cholesterol and stress contribute to heart attacks, particularly in those who have already suffered one. She also knows that the cost of providing programs developed to help mitigate these risks is a fraction of the cost of providing medical care for a patient who has suffered multiple heart attacks. Getting her employer on board with funding the programs is the easy part. Figuring out which patients will benefit from which programs is trickier. She is looking to us to provide some guidance, based on data mining, to figure out which patients are good candidates for which programs. Sonia’s bottom line is that she wants to know whether or not something (a second heart attack) is likely to happen, and if so, how likely it is that it will or will not happen. Logistic regression is an excellent tool for predicting the likelihood of something happening or not.
 DATA UNDERSTANDING
Sonia has access to the company’s medical claims database. With this access, she is able to generate two data sets for us. This first is a list of people who have suffered heart attacks, with an attribute indicating whether or not they have had more than one; and the second is a list of those who have had a first heart attack, but not a second. The former data set, comprised of 138 observations, will serve as our training data; while the latter, comprised of 690 peoples’ data, will be for scoring. Sonia’s hope is to help this latter group of people avoid becoming second heart attack victims. In compiling the two data sets we have defined the following attributes:
Age: The age in years of the person, rounded to the nearest whole year.
Marital_Status: The person’s current marital status, indicated by a coded number: 0–
Single, never married; 1–Married; 2–Divorced; 3–Widowed.
Gender: The person’s gender: 0 for female; 1 for male.
Weight_Category: The person’s weight categorized into one of three levels: 0 for normal weight range; 1 for overweight; and 2 for obese.
Cholesterol: The person’s cholesterol level, as recorded at the time of their treatment for their most recent heart attack (their only heart attack, in the case of those individuals in the scoring data set.)
142

Chapter 9: Logistic Regression
Stress_Management: A binary attribute indicating whether or not the person has previously attended a stress management course: 0 for no; 1 for yes.
Trait_Anxiety: A score on a scale of 0 to 100 measuring the level of each person’s natural stress levels and abilities to cope with stress. A short time after each person in each of the two data sets had recovered from their first heart attack, they were administered a standard test of natural anxiety. Their scores are tabulated and recorded in this attribute along five point increments. A score of 0 would indicate that the person never feels anxiety, pressure or stress in any situation, while a score of 100 would indicate that the person lives in a constant state of being overwhelmed and unable to deal with his or her circumstances.
2nd_Heart_Attack: This attribute exists only in the training data set. It will be our label, the prediction or target attribute. In the training data set, the attribute is set to ‘yes’ for individuals who have suffered second heart attacks, and ‘no’ for those who have not.
 DATA PREPARATION
Two data sets have been prepared and are available for you to download from the companion web site. These are labeled Chapter09DataSet_Training.csv, and Chapter09DataSet_Scoring.csv. If you would like to follow along with this chapter’s example, download these two datasets now, and complete the following steps:
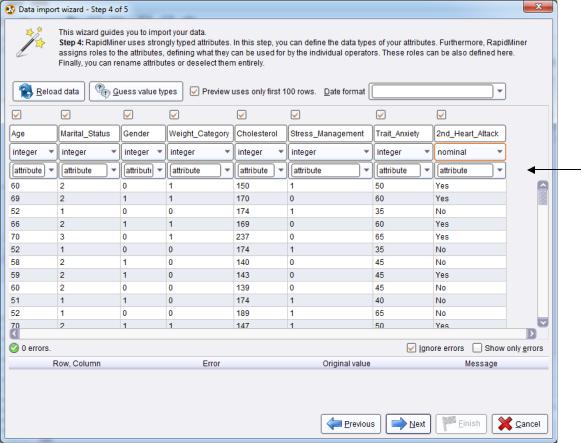
1)Begin the process of importing the training data set first. For the most part, the process will be the same as what you have done in past chapters, but for logistic regression, there are a few subtle differences. Be sure to set the first row as the attribute names. On the fourth step, when setting data types and attribute roles, you will need to make at least one change. Be sure to set the 2nd_Heart_Attack data type to ‘nominal’, rather than binominal. Even though it is a yes/no field, and RapidMiner will default it to binominal because of that, the Logistic Regression operator we’ll be using in our modeling phase expects the label to be nominal. RapidMiner does not offer binominal-to-nominal or integer-to- nominal operators, so we need to be sure to set this target attribute to the needed data type of ‘nominal’ as we import it. This is shown in Figure 9-1:
143
Data Mining for the Masses
Figure 9-1. Setting the 2nd_Heart_Attack attribute’s data type to ‘nominal’ during import.
2)At this time you can also change the 2nd_Heart_Attack attribute’s role to ‘label’, if you wish. We have not done this in Figure 9-1, and subsequently we will be adding a Set Role operator to our stream as we continue our data preparation.
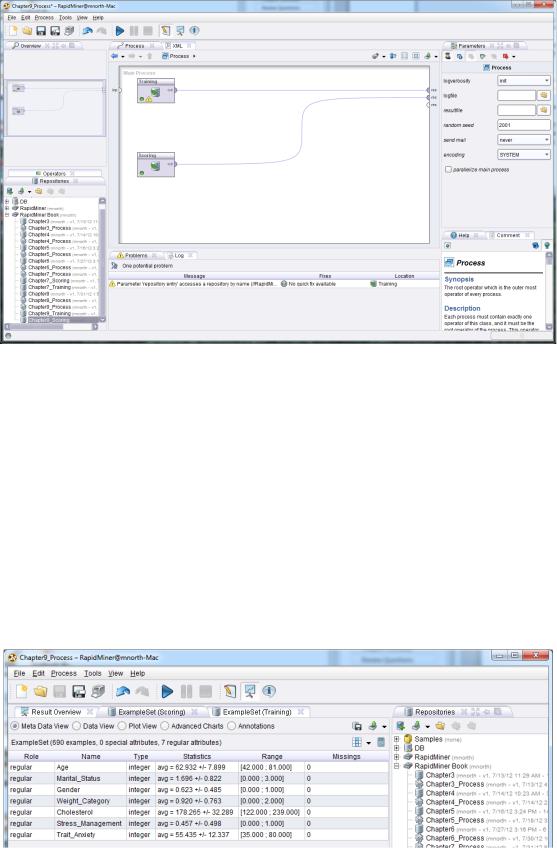
3)Complete the data import process for the training data, then drag and drop the data set into a new, blank main process. Rename the data set’s Retrieve operator as Training.
4)Import the scoring data set now. Be sure the data type for all attributes is ‘integer’. This should be the default, but may not be, so double check. Since the 2nd_Heart_Attack attribute is not included in the scoring data set, you don’t need to worry about changing it as you did in step 1. Complete the import process, drag and drop the scoring data set into your main process and rename this data set’s Retrieve operator to be Scoring. Your model should now appear similar to Figure 9-2.
144
Chapter 9: Logistic Regression
Figure 9-2. The training and scoring data sets in a new main process window in RapidMiner.
5)Run the model and compare the ranges for all attributes between the scoring and training result set tabs (Figures 9-3 and 9-4, respectively). You should find that the ranges are the same. As was the case with Linear Regression, the scoring values must all fall within the lower and upper bounds set by the corresponding values in the training data set. We can see in Figures 9-3 and 9-4 that this is the case, so our data are very clean, they were prepared during extraction from Sonia’s source database, and we will not need to do further data preparation in order to filter out observations with inconsistent values or modify missing values.
Figure 9-3. Meta data for the scoring data set (note absence of 2nd_Heart_Attack attrtibute).
145
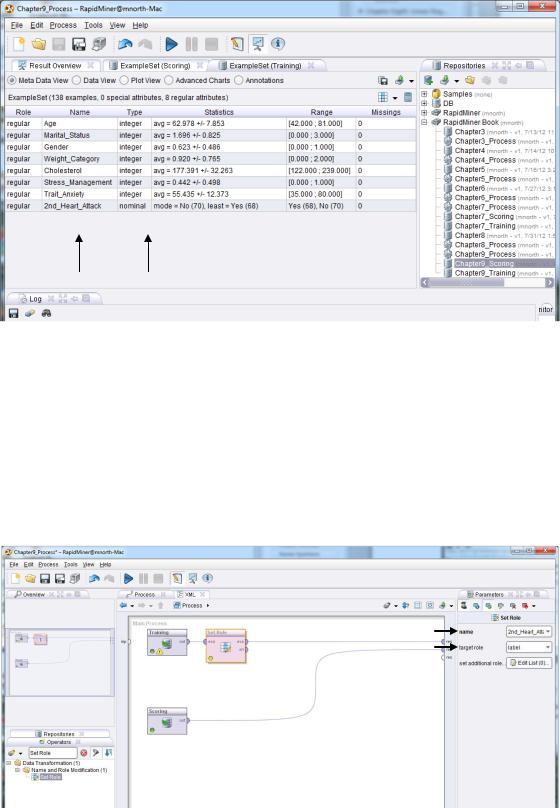
Data Mining for the Masses
Figure 9-4. Meta data for the training data set (2nd_Heart_Attack attribute is present with ‘nominal’ data type.) Note that all scoring ranges fall within all training ranges.
6)Switch back to design perspective and add a Set Role operator to your training stream.
Remember that if you designated 2nd_Heart_Attack to have a ‘label’ role during the import process, you won’t need to add a Set Role operator at this time. We did not do this in the book example, so we need the operator to designate 2nd_Heart_Attack as our label, our target attribute:
Figure 9-5. Configuring the 2nd_Heart_Attack attribute’s role in preparation for logistic regression mining.
146
Chapter 9: Logistic Regression
With the label attribute set, we are now prepared to begin…
 MODELING
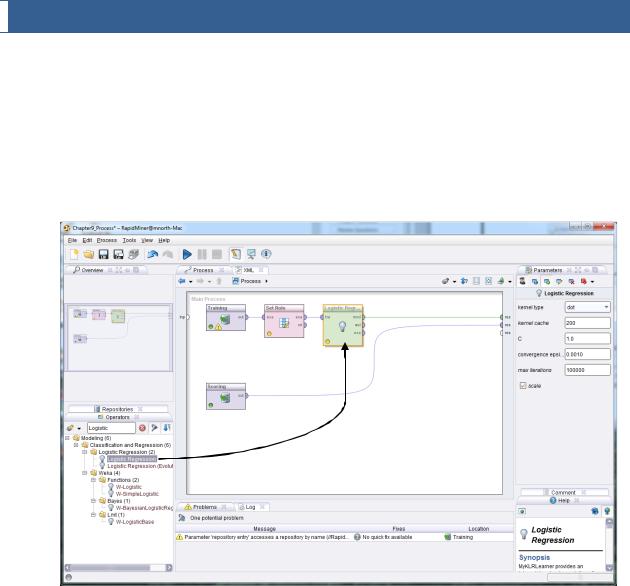
7)Using the search field in the Operators tab, locate the Logistic Regression operator. You will see that if you just search for the word ‘logistic’ (as has been done in Figure 9-6), there are several different logistic, and logistic regression operators available to you in RapidMiner. We will use the first one in this example, however, you are certainly encouraged to experiment with the others as you would like. Drag the Logistic Regression operator into your training stream.
Figure 9-6. The Logistic Regression operator in our training stream.
8)The Logistic Regression operator will generate coefficients for each of our predictor attributes, in much the same way that the linear regression operator did. If you would like to see these, you can run your model now. The algebraic formula for logistic regression is different and a bit more complicated than the one for linear regression. We are no longer calculating the slope of a straight line, but rather, we are trying to determine the likelihood of an observation falling at a given point along a curvy and less well-defined imaginary line through a data set. The coefficients for logistic regression are used in that formula.
147
Data Mining for the Masses
9)If you ran your model to see your coefficients, return now to design perspective. As you have done in our most recent few chapter examples, add an Apply Model operator to your stream, to bring the training and scoring data sets together. Remember that you may need to disconnect and reconnect some ports, as we did in Chapter 7 (step 13), in order to merge your two streams together. Be sure your lab and mod ports are both connected to res ports.
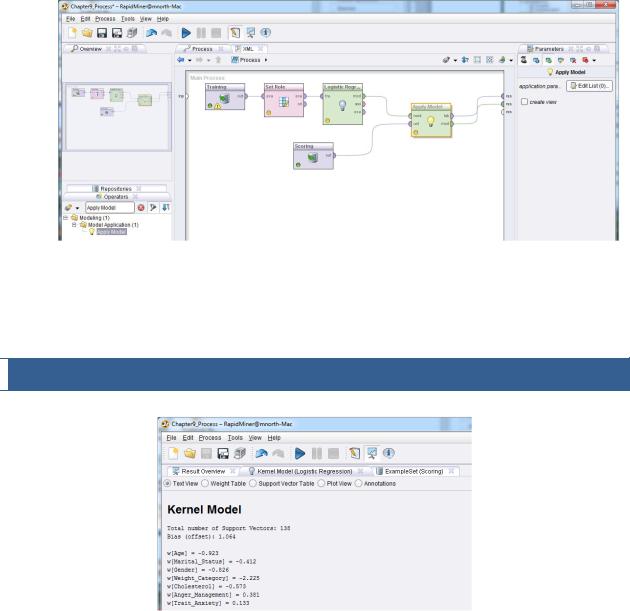
Figure 9-7. Applying the model to the scoring data set.
We are finished building the model. Run it now, and we will proceed to…
 EVALUATION
Figure 9-8. Coefficients for each predictor attribute.
The initial tab shown in results perspective is a list of our coefficients. These coefficients are used in the logistic regression algorithm to predict whether or not each person in our scoring data set
148